


 Arguments


A Historical Perspective on Arctic Warming: Part One
Posted on 28 January 2014 by robert way
During her most recent Senate testimony, Dr. Judith Curry (Georgia Tech) repeated one of the most common misconceptions found in the blogosphere, that the Arctic was warmer than present during the 1940s. This period - known as the Early Century Warm Period (ECWP) - coincides with observations of reduced Arctic sea ice cover and allowed for more widespread ship navigation than during the late 1800s and early 1900s (Johanessen et al. 2004).
There are two elements to the contrarian views on the ECWP in the Arctic. First, they argue that during the ECWP the Arctic was warmer than present. Secondly they have used the ECWP as a means of casting doubt on the main drivers of global warming. These contrarians argue that internal climate variability caused the ECWP and that this internal variability may have contributed to recent Arctic warming, thereby suggesting that climate sensitivity to greenhouse gases may be lower than current estimates. Some of these discussion points have also somehow found themselves in the IPCC AR5's Chapter 10 where the following claim is made.
"Arctic temperature anomalies in the 1930s were apparently as large as those in the 1990s and 2000s. There is still considerable discussion of the ultimate causes of the warm temperature anomalies that occurred in the Arctic in the 1920s and 1930s."
Based on previous examination of the surface temperature record and also reading the literature on the topic, I found myself skeptical of this IPCC claim and by extension the contrarian views. Tamino expressed a similar sentiment in a recent article. In this post I will be examining the first element of the discussion and will evaluate whether "Arctic temperature anomalies in the 1930s were apparently as large as those in the 1990s and 2000s" is an accurate statement.
The challenge with describing Arctic surface air temperature changes is that the observational network is sparse, something we noted and corrected for in Cowtan and Way (In Press). Using a single observational network therefore has the potential to mislead - particularly on short timescales. However, comparison of all available long surface temperature records for the Arctic (here defined as regions North of 60°N) shows relatively strong agreement amongst the various products (Figure 1). 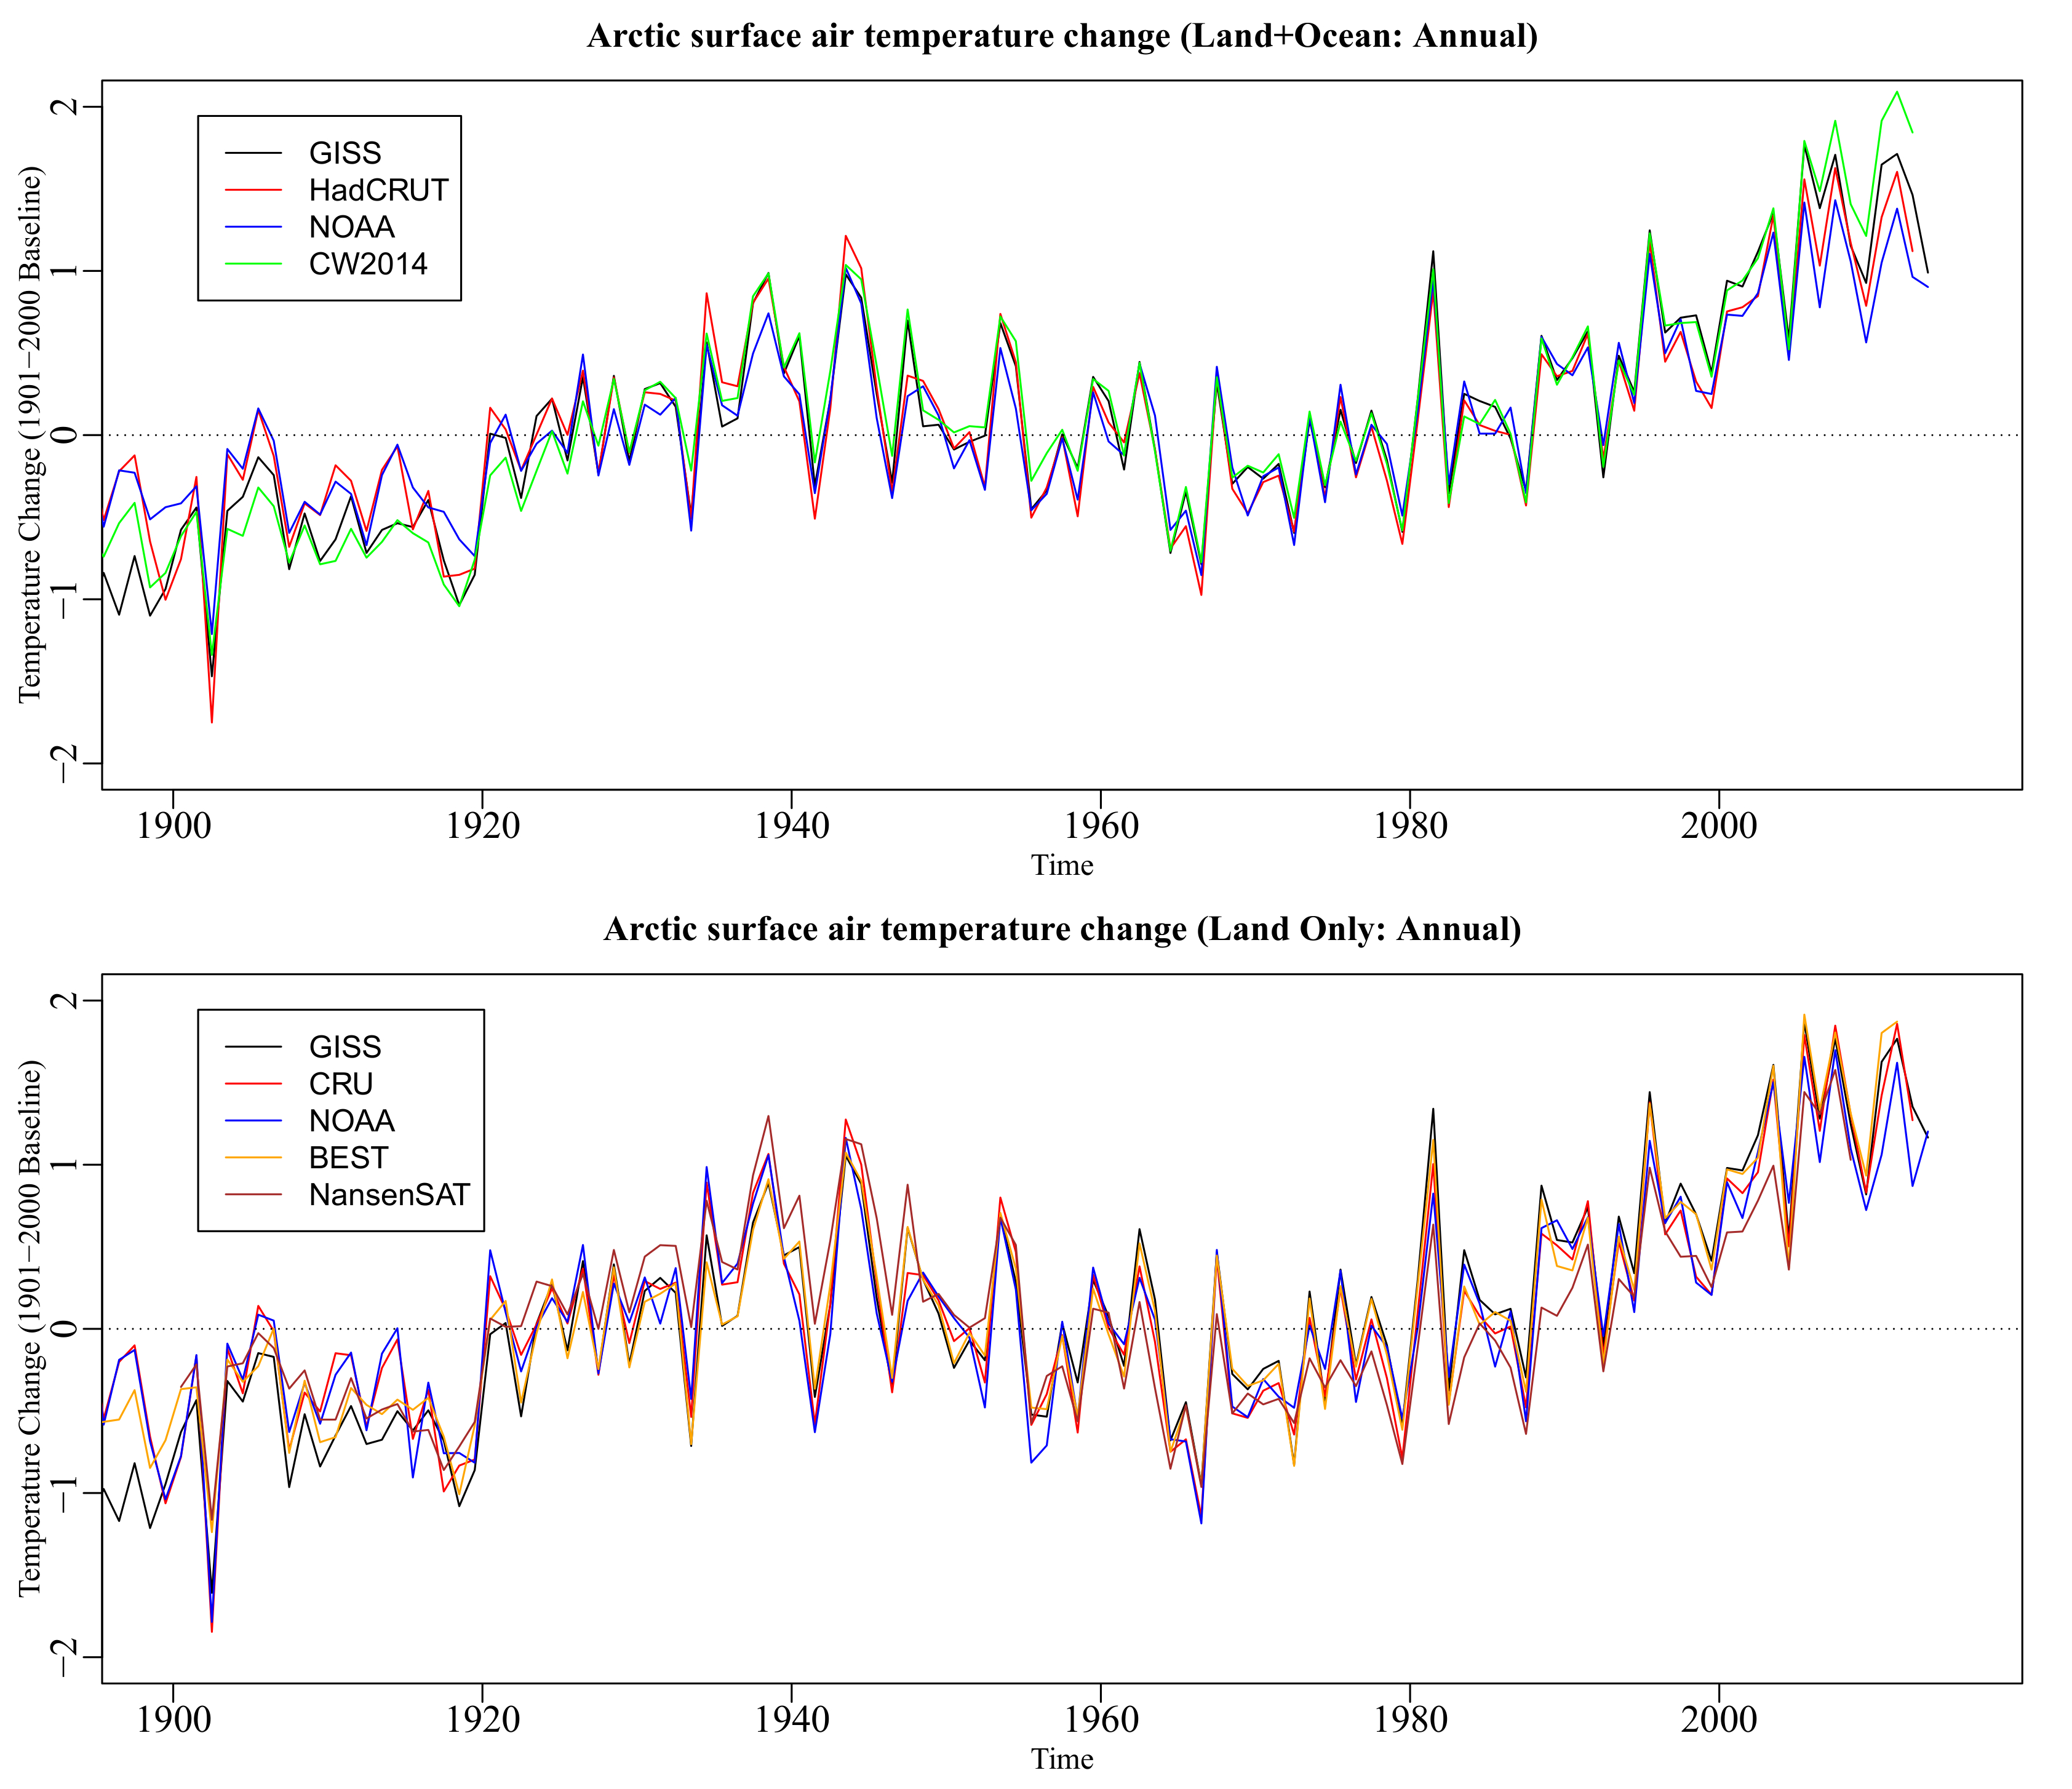
Figure 1: Arctic annual surface air temperature changes from ~1900 to ~2013 relative to the 1901-2000 baseline. (Top Panel) Combined Land & Ocean air temperatures; (Bottom Panel) Land only air temperatures.
From the above graph it is also apparent that some temperature anomalies between 1930 and 1950 were well above the 20th century average, but they do not match the magnitude of those observed over the past decade for any complete record. Over longer timescales (120 months/10 years) this difference becomes more apparent with no records showing similar warmth to present in the Arctic during any previous period (Figure 2). One record (NansenSAT; Johannsen et al, 2008) shows greater mid-century warmth and less recent warmth relative to the other datasets; this dataset includes 20th century data from both Russian drift stations and Argo buoys, but the land station data comes from CRUTEM2v which has limited Arctic coverage. It should be noted that the record terminates in 2008 before several of the warmest years in the Arctic.
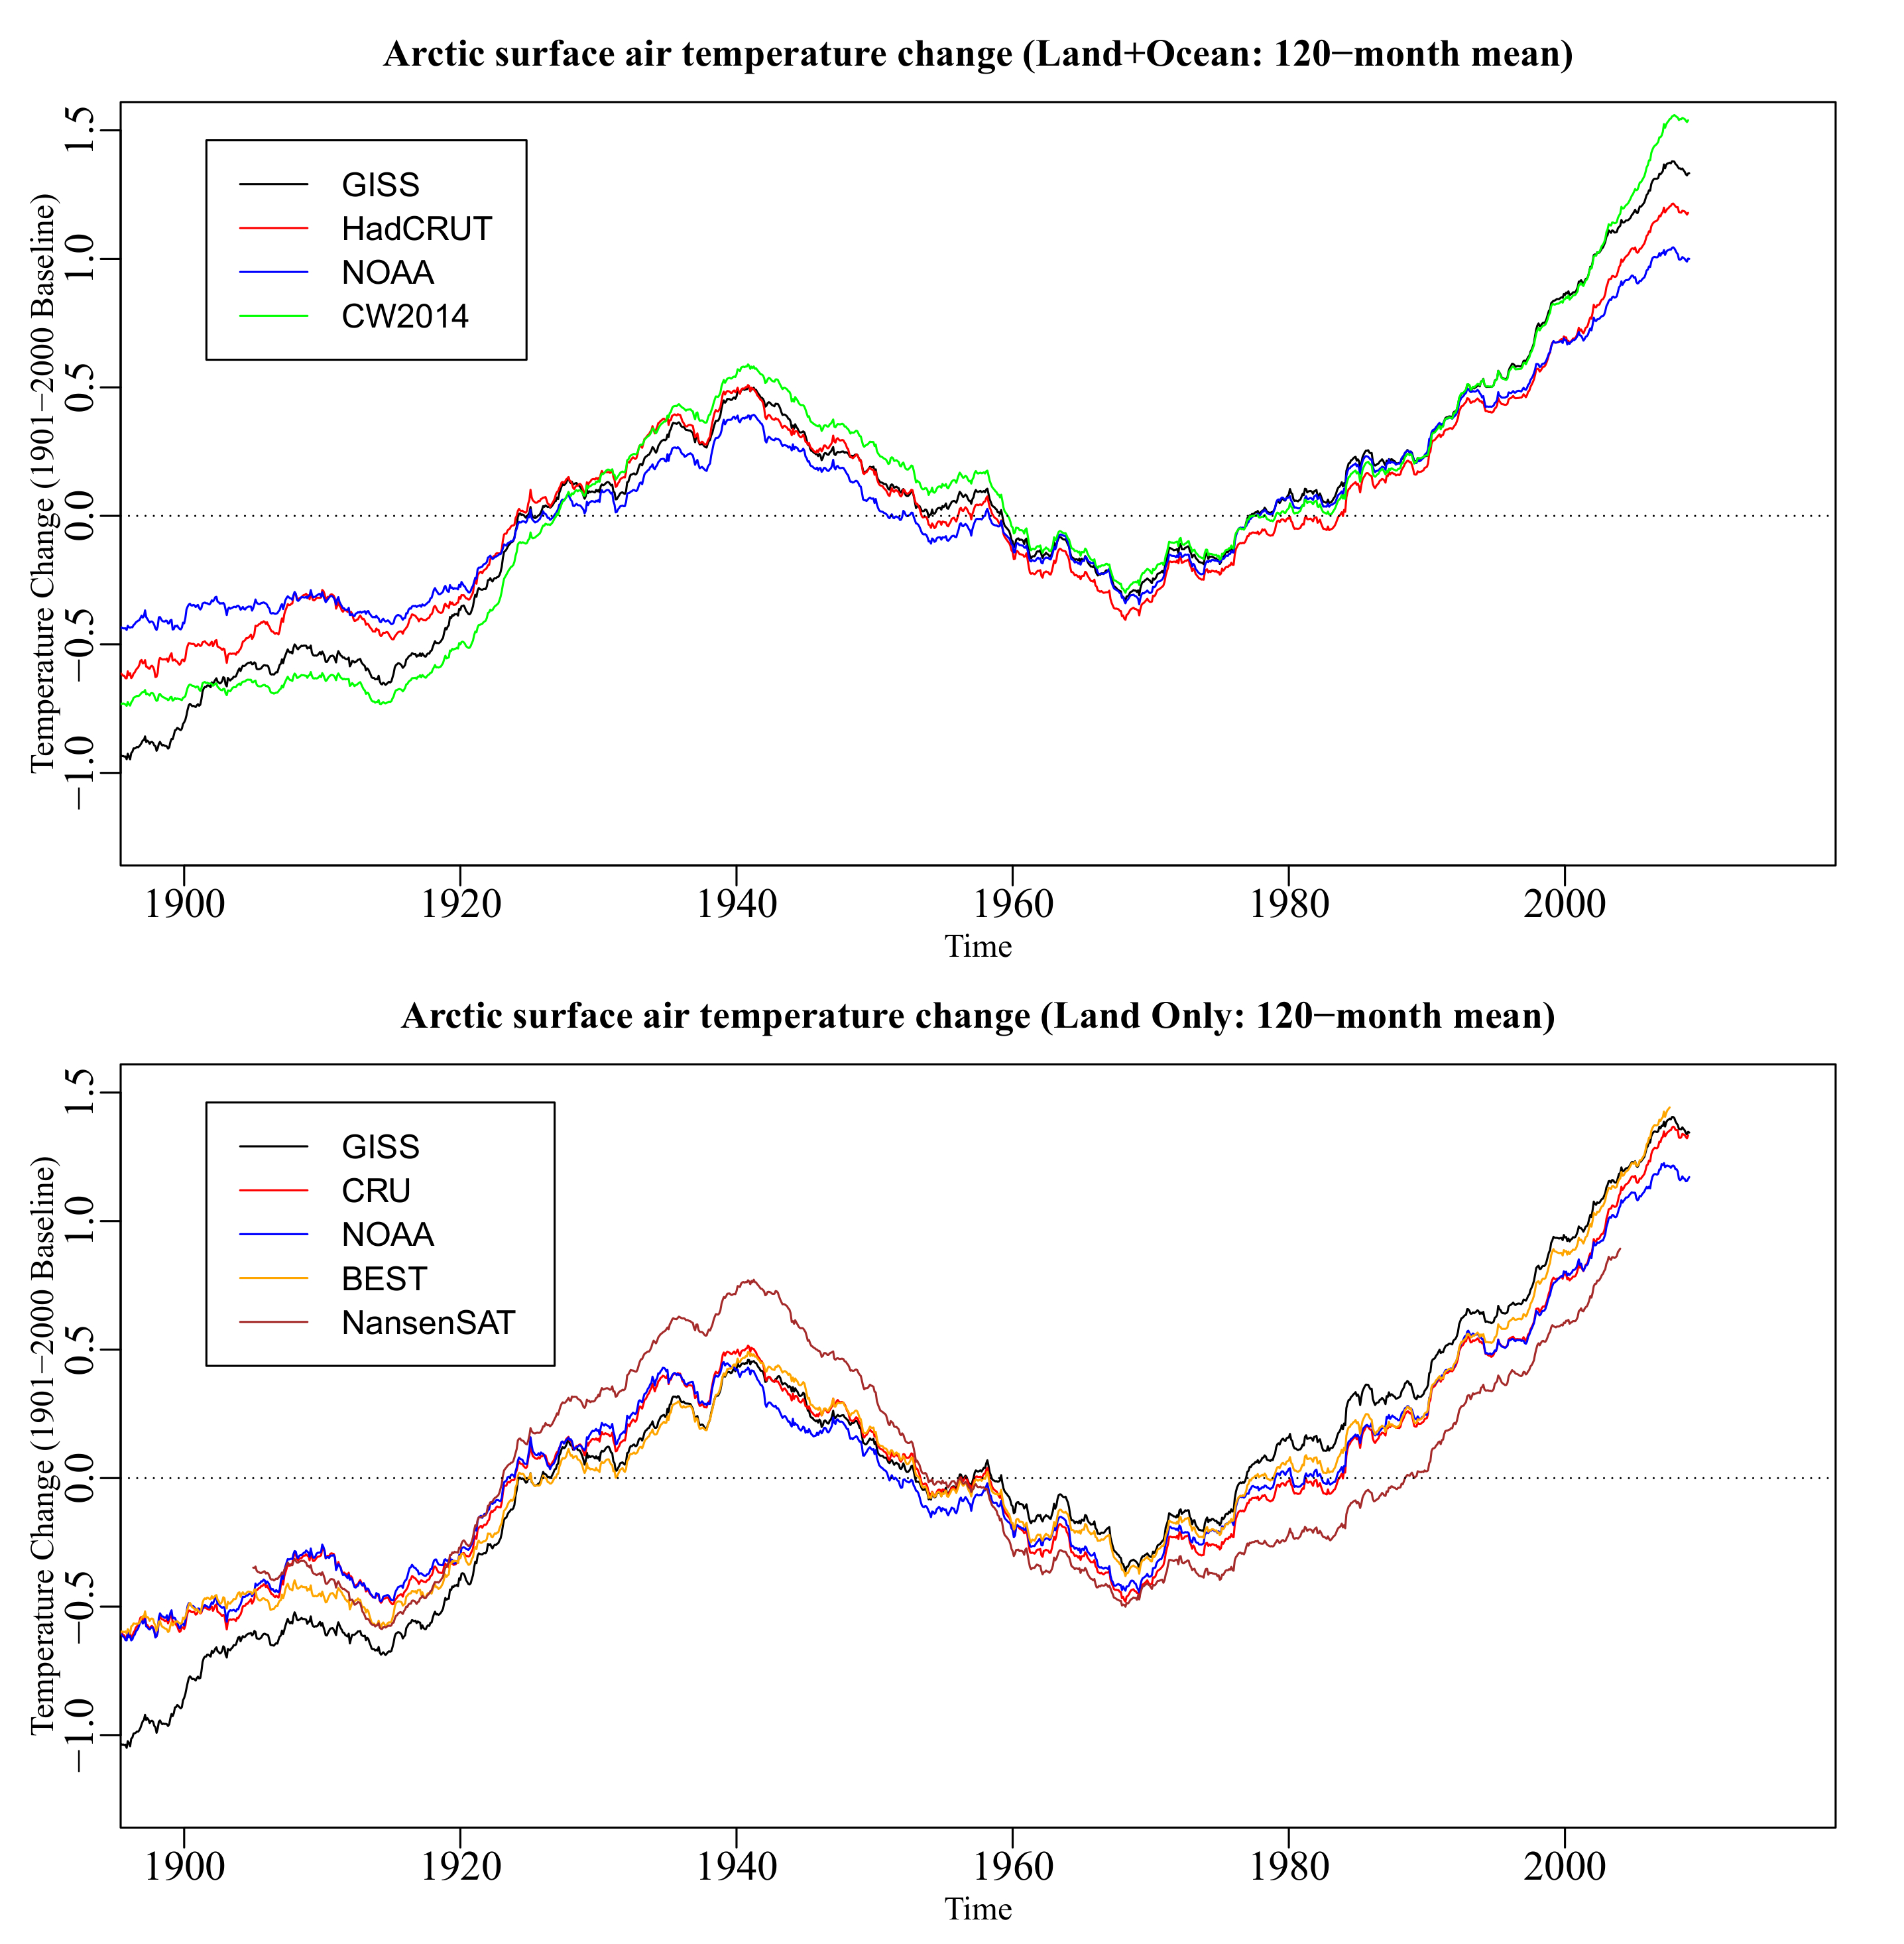
Figure 2: Centered rolling mean (120-month/10-year) of Arctic surface air temperatures from ~1900 to ~2008 (truncated at both ends) relative to the 1901-2000 baseline. (Top Panel) Combined Land & Ocean air temperatures; (Bottom Panel) Land only air temperatures.
The Arctic surface temperature record presented by CW2014 is the most complete spatially due to its incorporation of interpolation (e.g. kriging) and has been validated against both Arctic buoys and satellite records during the recent period. It also shows a greater warming during the ECWP than other Land+Ocean records therefore it is retained for comparing the ECWP and recent Arctic warming.
To compare the relative distributions of monthly anomalies we take the warmest 120 month period (10-year) during the ECWP and compare it to the warmest 120 month period during the recent warm period (Figure 3). Comparison of these two periods reveal a clear shift in the average air temperatures and also an increase in the probabilities of warm months over the past decade. Recently, it has also become increasinly rare for even a single month to have a below normal average temperature in contrast with the ECWP where this was common. 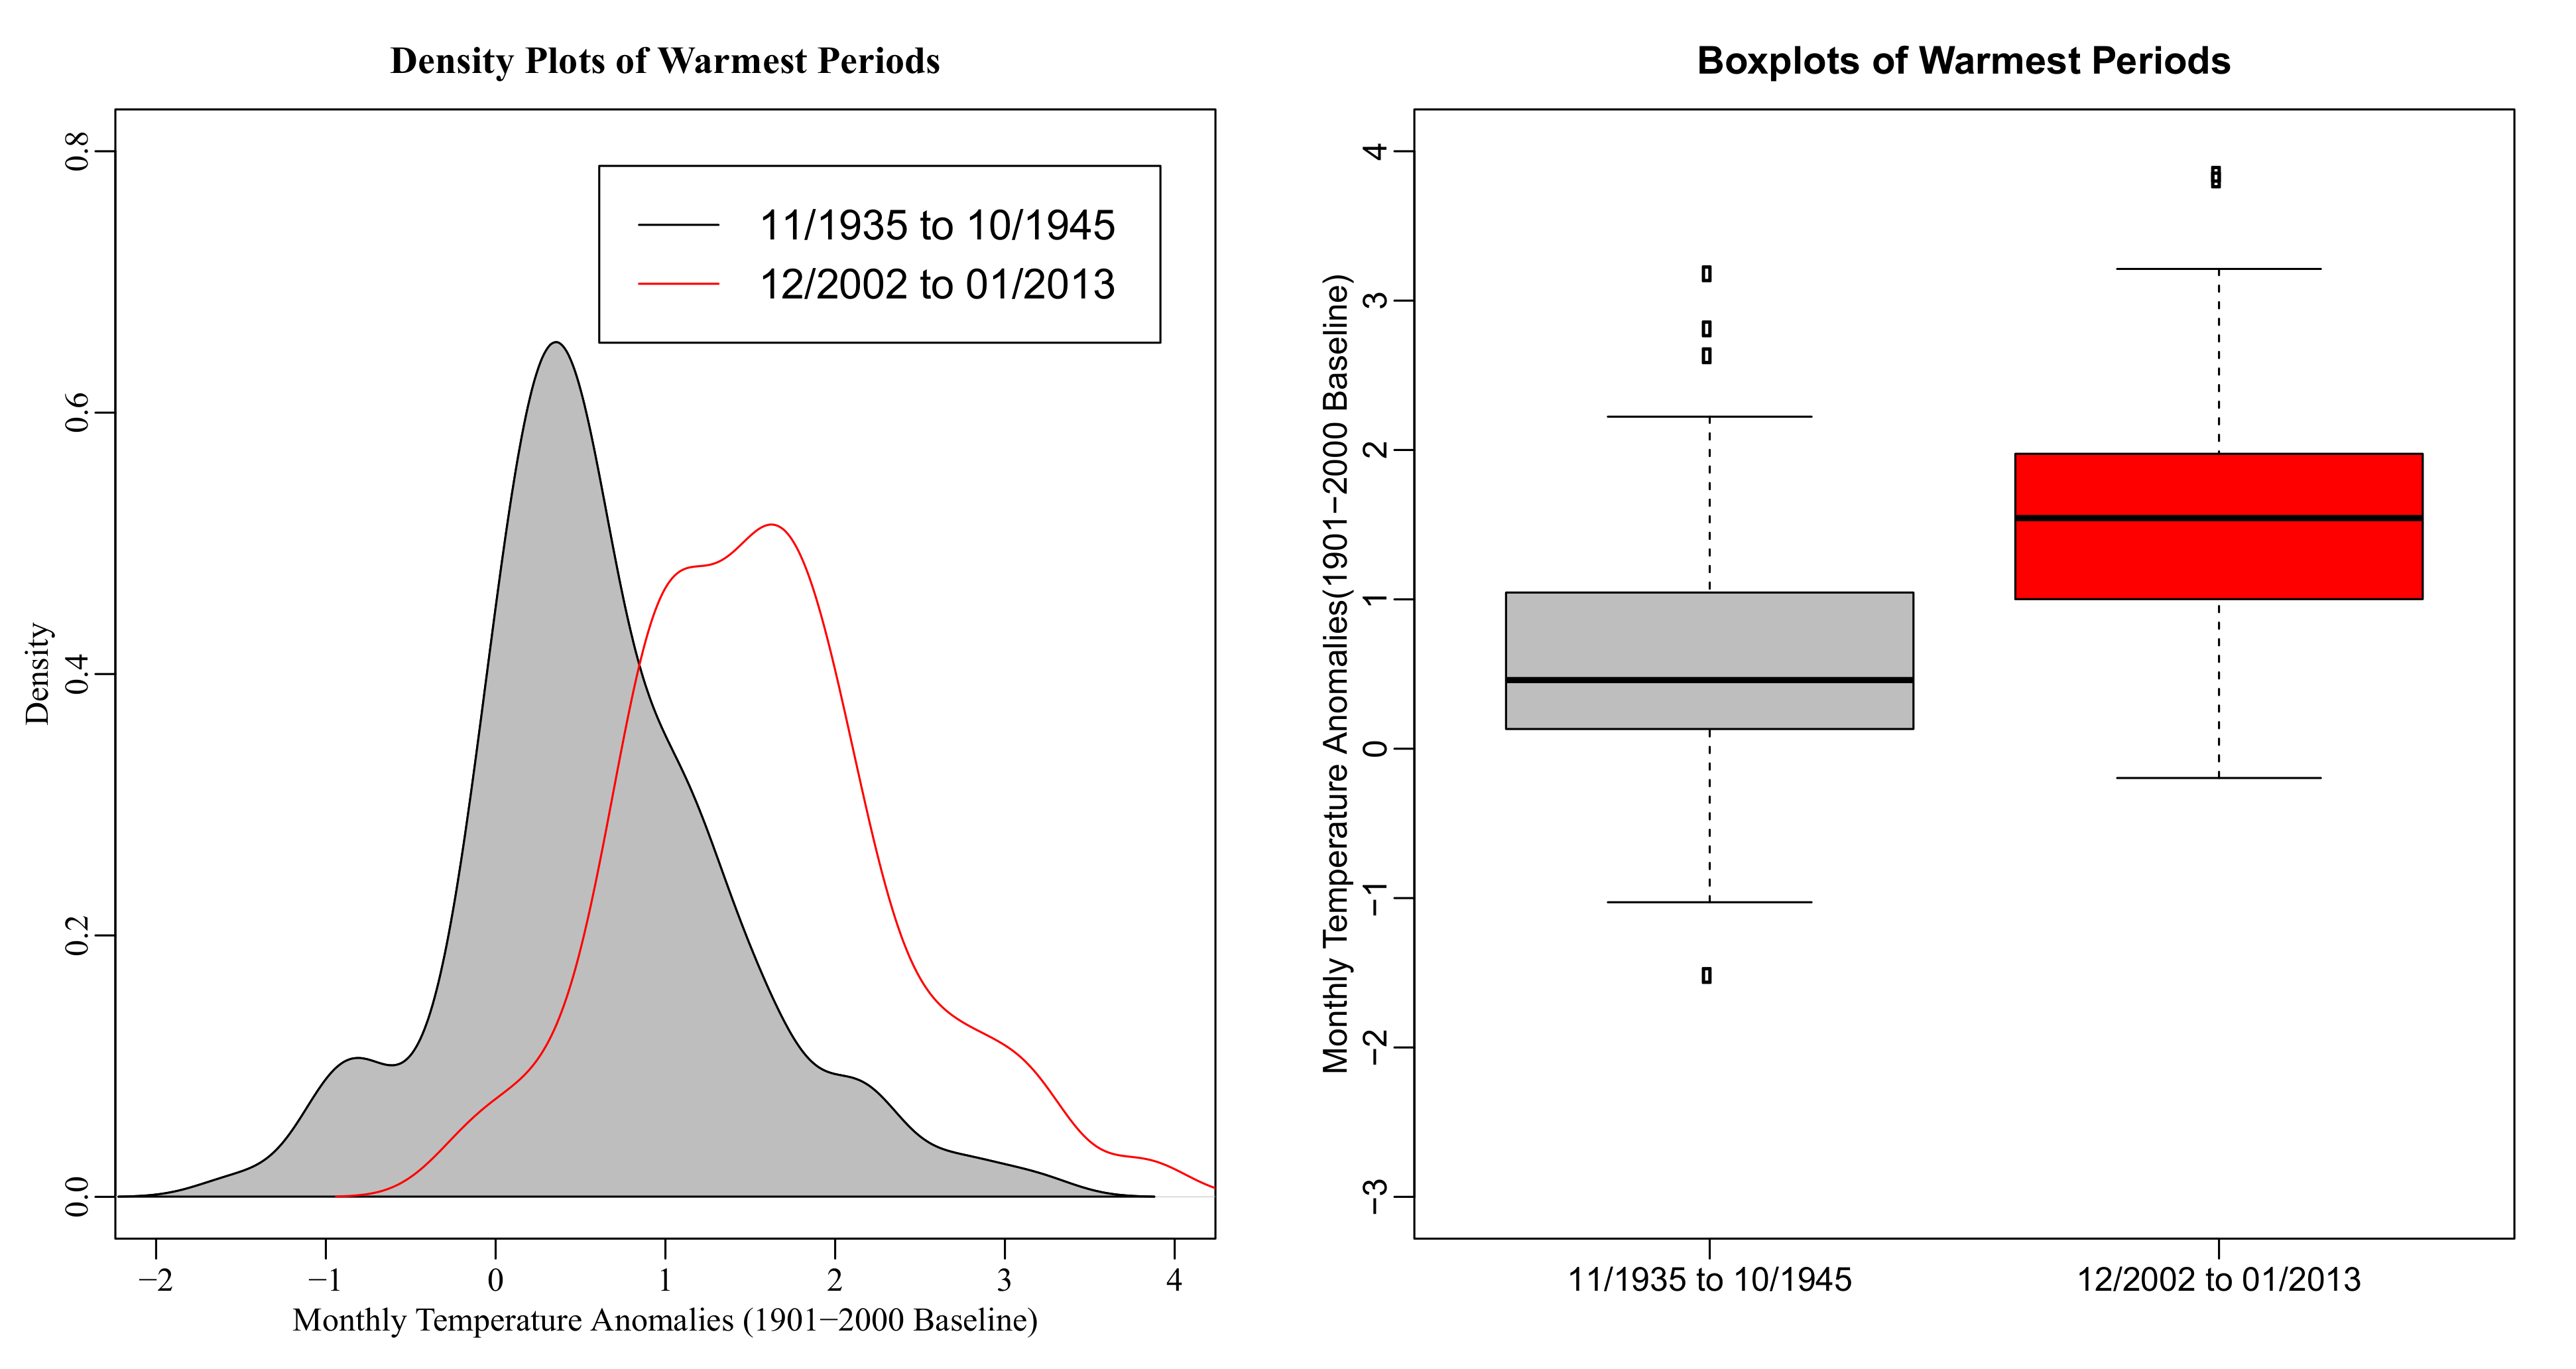
Figure 3: Comparison of warmest 120-month (10-year) periods in Arctic surface air temperatures during the early century warm period and recent warm period using the CW2013 dataset. (Left Panel) Density plots showing the frequency of temperature anomalies during both periods; (Right Panel) Boxplots showing the minimum/maximum values, lower/upper quartiles and medians for both periods. This figure was updated due to mistakenly using HadCRUTv4 in the original.
Based on the data presented above there is virtually no evidence that Arctic air temperatures were greater than present during any previous period of the last century. This is clearly a case where the IPCC should consider amending its text to provide a more accurate picture of Arctic temperature changes. In Part Two the Early Century Warm Period will be discussed in the context of its causes and origins.
Supplement:
CW2013 = Cowtan and Way Long-Kriged Global Temperature Product (After Cowtan and Way, In Press). Discussed here.
GISS = Goddard Institute for Space Studies (Hansen et al. 2010).
HadCRUT/CRU = Hadley Climate Research Unit (Jones et al. 2012; Morice et al. 2012).
NOAA/NCDC = National Oceanic and Atmospheric Administration's National Climate Data Center (Lawrimore et al. 2011; Vose et al. 2012;).
BEST = Berkeley Earth Surface Temperature Project (Rohde et al. 2013).
NansenSAT = Nansen Environmental and Remote Sensing Center (Johanessen et al. 2004; Kuzmina et al. 2008).


> During her most recent Senate testimony, Dr. Judith Curry (Georgia Tech) repeated one of the most common misconceptions found in the blogosphere, that the Arctic was warmer than present during the 1940s.
A quote might be needed, if only to see if Judy argues what "the contrarians argue", whoever they may be.
Some citations showing that what the contrarians argue can be reduced to the two claims in the text might be nice.
***
Furthermore, this article mentions "the contrarian view" and quotes the IPCC without presenting both viewpoints. All we see is a quote. No discussion of the rationale behind the IPCC's claim. Not even a citation.
In fact, we have no evidence of any effort to conciliate the author's opinion with the authors of the AR5, chapter 10.
***
I conclude that this article is mainly a promotional token for Cowtan & Way, in press, and expect better from a site that declares his intention "to explain what peer reviewed science has to say about global warming".
Willard... The article is a response to Dr Curry's erroneous claims. Would you expect Robert to not cite is own relevant research related to this issue? And, how is it a "promotional token" when there are at least six other citations in the piece?
> The article is a response to Dr Curry's erroneous claims.
The explain the op-ed's kicker, Rob:
Based on the data presented above there is virtually no evidence that Arctic air temperatures were greater than present during any previous period of the last century. This is clearly a case where the IPCC should consider amending its text to provide a more accurate picture of Arctic temperature changes.
I expect Dr. Way to cite the relevant research behind the IPCC's "text".
I also expect Dr. Way to communicate his beef with its authors in another mean than an op-ed against Judy.
***
As an aside, it would be interesting to compare the citations provided in this op-ed and what we can find in Cowtan & Way, in press.
Willard... You should click the link over to Tamino's article. He explains the text from the IPCC is based on Johanessen et al. (2004, Tellus, 56A, 328–341), which this article cites, where the data ends at 1997.5. Someone of Dr Curry's "expertise" should have easily picked up on this. It is clearly an error in the draft version of AR5 that Judith was pouring over prior to her testimony. But rather than turning up the error she used the error to make a completely erroneous statement to the Senate committee.
I would also highly suggest you tone down your "I expect" comments. If you have questions, just ask.
willard,
Out of curiosity, why is that you refer to Robert Way as "Dr" even though - as his Skeptical Science author profile notes - he is a PhD student, but Dr Curry gets to be "Judy"?
Personal acquaintance, perhaps?
[PS] Can all parties stick to the science please? (and leave out rhetoric).
@ Rob (#2, #4): it is well understood that the entire burden of proof, right down to providing exhaustive etymologies of technical terms and common English words, rests with those scientists who would infer any human role in climate change. Those who oppose that position, on the other hand, are allowed to say any old thing that pops into their heads. In such cases, asking for references is considered rude. I believe, but am not certain, that such commenters are also permitted to invoke the "Look, a squirrel!" rule at any point.
Magma... Please define for me what you mean by "squirrel" and please provide at least six citations (from sources I deem reasonable) proving the existence of said creature, and... Look, over there! It's a blimp!
Rob Honeycutt,
You say:
> [Tamino] explains the text from the IPCC is based on Johanessen et al. [...]
More exactly, Tamino claims that Johanessen & al is the only reference he could find that would substantiate Judy's claim. Only by considering that source does he raise concerns about the "2000s" mentioned by the IPCC. That Robert Way (not Dr., sorry about that) cites Tamino's reference does not substantiate what Tamino says: it simply repeats it.
Besides mentioning Gillett et al. (2008b), Wang et al. (2007), Shindell and Faluvegi (2009) and (Crook et al., 2011), and notwithstanding the model based attribution studies, here's the relevant paragraph quoted by Judy:
Arctic temperature anomalies in the 1930s were apparently as large as those in the 1990s and 2000s. There is still considerable discussion of the ultimate causes of the warm temperature anomalies that occurred in the Arctic in the 1920s and 1930s (Ahlmann, 1948; Veryard, 1963; Hegerl et al., 2007a; Hegerl et al., 2007b). The early 20th century warm period, while reflected in the hemispheric average air temperature record (Brohan et al., 2006), did not appear consistently in the mid-latitudes nor on the Pacific side of the Arctic (Johannessen et al., 2004; Wood and Overland, 2010). Polyakov et al. (2003) argued that the Arctic air temperature records reflected a natural cycle of about 50–80 years. However, many authors (Bengtsson et al., 2004; Grant et al., 2009; Wood and Overland, 2010; Brönnimann et al., 2012) instead link the 1930s temperatures to internal variability in the North Atlantic atmospheric and ocean circulation as a single episode that was sustained by ocean and sea ice processes in the Arctic and north Atlantic. The Arctic wide temperature increases in the last decade contrast with the episodic regional increases in the early 20th century, suggesting that it is unlikely that recent increases are due to the same primary climate process as the early 20th century.
So again, I expect Skeptical Science to present what is in the litterature,
<snip>
[PS] Please wind back the rhetoric and stick to the science. That means everyone.
Willard... No, that is not what Dr Curry quoted. That is the IPCC section she was quoting from. She actually only quotes the opening two sentences from that paragraph.
Curry's premise, if you'll recall, is that AR5 actually lessens the certainty on man-made global warming. Right? She is using (or attempting to use) that specific sentence "Arctic temperature anomalies in the 1930s were apparently as large as those in the 1990s and 2000s" to support her thesis.
The problem is, while you can say Arctic temps were as high in the 1990's as they were in the 1930's, the error in the draft AR5 is in adding "and 2000's" to the sentence. There is no support for that position.
Willard, all you have to do is look at the data. None of the data sets supports the conclusion Curry is making. Tamino presents Johanessen because that is the only cited research that could possibly be used to support her position. But he shows she would be relying on out-of-date information to make such a claim.
[KC] Accusation of dishonesty snipped.
willard - I believe that Robert Way has indeed presented the support for his disagreement with both Dr. Curry (who claims the Arctic anomalies were equal or greater than current Arctic anomalies) and the IPCC text. That support is the recorded temperature data, as in the GISS temps plotted by latitude:
[Source]
Way doesn't have the responsibility of justifying the IPCC position, seeing as how he disagrees with it based on the data. As to providing the IPCC quote, that's in the opening post. It's not clear to me what you are asking for beyond that.
In addition, Tamino notes that none of the data sets supports her position on this:
(My emphasis.)
Curry has clearly made this claim, as per her testimony, stating:
That link would be good to add to the OP.
Judith Curry has a recent blogpost on this subject at http://judithcurry.com/2014/01/27/early-20th-century-arctic-warming/
Her original testimony can be found at http://www.epw.senate.gov/public/index.cfm?FuseAction=Files.View&FileStore_id=07472bb4-3eeb-42da-a49d-964165860275
And Tamino already has a response to Curry's response.
http://tamino.wordpress.com/2014/01/28/judith-curry-responds-sort-of/
I have to say, I find Dr Curry's response less than adequate. She's merely retreating to the idea that we can't really know if the temperature of the 1930's was warmer or not because the Arctic has poor coverage.
Once again, this completely contradicts the entire thesis of what she was presenting to the Senate committee! You can't claim on one hand, in front of elected officials and the general public, that AR5 actually reduces our certainty about AGW, and then turn around and claim in a blog post that the data are insuffient to even know.
> No, that is not what Dr Curry quoted.
Here is where Dr. Curry quoted what I said she quoted.
Following that op-ed published on January 27, 2014, there are some comments by Robert Way in the comment section, dated January 28, 2014 at 11:32 am, 11:57 am, 1:23 pm, 1:49 pm, and 4:34 pm.
My understanding is that Robert Way's op-ed has been published on January 28, 2014.
Reading back that thread might show that the claim "there is no support for that [Judy's and the IPCC's] position" might be going a bridge too far, and has been offered by Rob Honeycutt as a proof by assertion.
***
If we're supposed to evaluate the accuracy of the statement "Arctic temperature anomalies in the 1930s were apparently as large as those in the 1990s and 2000s", a statement we can find in the IPCC documentation, then we wish to pay due diligence to what contains the IPCC documents and drop anything that has yet to appear there.
If what we want is to put emphasis on new, cutting-edge peer-review literature, then I suggest we clarify what kind of "Historical Perspective" is intended.
[PS] fixed link.
First, Tamino now has a follow up article on this issue.
In it he examines the temperature data presented in:
Polyakov et al (2003)
Wood and Overland (2010)
Yamanouchi (2011)
Fyfe et al (2013)
Johannessen (2004)
Bekryaev et al (2010)
He discusses these because they are the articles Curry cites in her defense. Tamino shows that none of them show temperatures in the 2000s as cold as those in the 1930s. That is, the literature Curry cites do not support her conclusion, and where they show both 1930s and 2000s temperatures, refute it.
In the list above, the bolded articles are also cited by the IPCC in the section quoted by Willard. It is far from clear that the articles cited by the IPCC are in support of the disputed claim. When making that claim, ie, that "Arctic temperature anomalies in the 1930s were apparently as large as those in the 1990s and 2000s", they cite no literature in suport of the claim. Above (@1), Willard critiques the OP on the basis that there is no "... discussion of the rationale behind the IPCC's claim". In fact there is no discussion of the rationale behind the IPCC's claim in AR5 WG1. Criticizing Way for not reproducing or quoting what does not exist is bizarre. It shows that Willard has, at best, "phoned in" his initial critique,ie, that it is not based on an assessment of either the IPCC's discussion or of the literature.
I had expected better from Willard.
The IPCC also cites:
Ahlmann (1948)
Veryard (1963)
Hegerl (2007a)
Hegerl (2007b)
Brohan et al (2006)
Bengtsson et al (2004)
Grant et al (2009)
Bronnimann et al (2012)
Ahlmann and Veriyard are clearly too early to be relevant, not being able to compare 1930s even with 1990s temperatures - let alone those of the 2000s.
Hegerl et al (2007a) discusses attribution in relation to a reconstruction of NH temperatures from 30 to 90 degrees North, and contains no distinct discussion or representation of Arctic only temperatures. Further, the reconstruction terminates in 1990, making it irrelevant to the question at hand.
Hegerl et al (2007b) ie, AR4 WG1 Chapt 9 shows no pan-arctic temperatures, but those that it does show for individual Arctic areas show 1930s temperatures below temperatures in the 2000s.
Brohan et al (2006) introduces the HadCRUT3 which is superceded by HadCRUT4 which shows Arctic temperatures warmer in the 2000s than in the 1930s.
Bengtsson et al (2004) shows Arctic temperatures warmer than in the 1930s by the late 1990s, and does not show temperatures of the 2000s.
I do not have access to the full text of Grant et al (2009), but its abstract restricts its discussion entirely to the early twentieth century. That makes it unlikely that it will contradict what appears to be a concensus in the literature that actually discusses or shows a comparison between 1930s and 2000s Arctic temperatures. That is particularly the case as Grant et al (2009) share three coauthors with Bronniman et al (2012), including both Grant and Bronnimann.
Bronnimann et al (2012) conclude that:
To summarize, the IPCC claim has no supporting evidence in any of their cited literature that I have been able to examine, and flatly contradicts all of the standard temperature records, and the only clear statement on the subject in the literature they cite.
I believe that shows Willard's critique to have been entirely baseless.
Willard:
Rather than a bridge to far, it is clear understatement. Every temperature record examined showing both 1930s and 2000s Arctic temperatures shows the later to be warmer than the former. Further, the only clear statement on the issue in the IPCC's supporting literature flatly contradicts their (and Curry's) claim.
Willard, condemning "proof by assertion" does not justify your attempting the same.
Willard... First, not to nit-pick but these are "blog posts" rather than "op-eds." An Op-Ed would be something related to print media or an invited column from an invited outside person. Blog posts are usually owned by the blogger, or as with Robert, by someone who is a regular author of the blog.
That aside, as for "going a bridge too far," I don't agree. Look at Tamino's list of graphs from all the papers that are cited in the quote you provide from Curry. Even based on on the cited references you can't support the claim that the 1930's were warmer than the 2000's.
Willard:
There is no warrant for the claim that this article is "a promotional token", which gives the appearance of disproof by slander. Robert Way cited 10 distinct data sets, only one of which is his own.
Of course, the statement may well be true. Willard may conclude whatever Willard likes, regardless of the merits of the case. In this case, however, Willard's conclusion reflects poorly on him.
Before things go way offtopic with discussions of symantics and motivations which will be tedious for moderators, can I suggest instead Willard points to data that supports the Curry statement so that discussion can be more focussed on the science.
Between Robert's post and the post by Tamino, Dr. Curry has again been shown to wrong (how many times has that happened now?). She was wrong in her claims about sea level, she was wrong in her claims about what decadal variability means for climate sensitivity, she was wrong about the implications of the Antarctic sea ice extent increasing slowly. It is quite obvious that Dr. Curry is doing whatever it takes to feed the beloved uncertainty monster that she recently conjured up;)
I hope that it is not lost on readers that Robert Way and Tamino have (unlike Dr. Curry) objectively analyzed the data. Robert's line plots, density plot and box and whisker plot demonstrate unequivocally that Dr. Curry's claims are simply and comppletely wrong. I would go further and argue that she was playing loose with the truth and facts in her testimony to Congress. She only has two options here-- either she is being disingenuous or she is not qualified to speak to the science of AGW.
This sort of unprofessional conduct by Dr. Curry is completely unjustified, indefensible and reprehensible. I can't imagine why anyone with integrity or standards would even begin to try and defend Dr. Curry's unethical behaviour.
Another important result arising from this is that the IPCC tends to be, if anything, too conservative.
[PS] This comment is on thin ice with respect to both inflammatory tone and accusations of deception. Let's keep this civil.
To be fair, I am going to issue a challenge to Dr. Curry. If Dr. Curry honestly believes that her opinions have scientific merit and/or are novel, then I challenge her to publish (as sole author) a paper on each one of her claims made to Congress in a reputable peer-reviewed journal such as Quarterly Journal of the Royal Meteorological Society, Journal of Climate, or Climate Dynamics, or International Journal of Climatology or Geophysical Research letters.
Cowtan and Way did so....
Very good point Albatross, Willard's playing on words does not fool anyone. Curry's testimony in Congress had little more value than that of Monckton. Robert Way is one of many regular contributors to SkS who can claim publication in a serious journal. It is one more in a list that is becoming significant and continues to grow. I'm not sure if this is the right thread but I would like to propose a new tab on the upper left of the home page: "SkS authors/contributors climate science articles." Anyone else thinks it's a good idea? I'm not suggesting competiton with RC but something that would allow newcomers to see that this site is not to be given the same weight as clowns like Goddard or other internet junk...
Thats a great Idea ^^
Albatross raises an interesting point. Curry has an extensive publication history... but I can't recall having seen her publish any peer reviewed 'research' on her climate denial talking points.
Her participation in the 'BEST' study would have been a perfect example... except that it wound up showing that her claims were false... and then, of course, she disavowed it.
Has she published 'denial research' that I have missed? Her claims on scientists (including her own BEST study) 'hiding the decline' were particularly egregious... yet she made her 'case' entirely in the field of 'journalism' rather than science.
A quick look at Dr. Currys publication history shows two instances of 'Antarctic', and 45 of 'Arctic '. Only 5 on 'temperature', however (note: her publications go back to 1983, well over 100 listed). She appears to know a lot about the Arctic.
Given that publication history and the existing Arctic data, these postions in her testimony seem quite out of place.
An update on my previous post - Dr. Curry's Georgia Tech publication list shows about 154 titles, meaning that just under 1/3 (45) concern the Arctic. Again, she should know what she is talking about, making her Congressional testimony puzzling.
These sea ice maps from 1938 (the summer with least sea ice during the ECWP) and the record year 2012 confirms what the temperature records say about the Arctic, namely that the warming around 1930-1940 was not comparable to the warming we see today.
And even if it was, it’s worth noting that the areas north of 60°N and 70°N cover no more than about 7% and 3% of the Earths surface, respectively. A significant warming here could easily be offset by an insignificant cooling in the rest of the world without affecting the global temperature.
Source: Danish Meteorological Institute (DMI) and NSIDC.
It could be that the IPCC was right, but Curry was wrong. There is namely an important sentence missing from Curry’s quote h/t Steve Bloom:
“A question as recently as six years ago was whether the recent Arctic warming and sea ice loss was unique in the instrumental record and whether the observed trend would continue (Serreze et al., 2007).”
In other words, the IPCC was describing the way science saw the situation 6 years ago. Six years makes quite a difference as the temperature increase was strong the last few years. For more details see my blog.
Comparing the summer 1938 map of Arctic ice with the 2012 map of Arctic ice, the land mass surrounding the ice is ill-defined. Presumably the 2012 map is the correct definition of land in the Arctic. Since the land in 1938 was ill-defined, it seems a stretch to think that the ice, which changes constantly, every summer, would not be anywhere near as well-defined as the land.
To define the extent of ice in 1938 would require a lot of ships sailing around reporting ice extent. It looks as though there was a lot of interpolation - "There is ice here so there is probably ice further on, where we can't go, so let's just fill it in with ice". As is evident from the 2012 map of the ice, it would have taken just a bit more ice to block off the Bering Sea access which would lead people in the day to assume that everywhere beyond the beginning of the ice would be continuous ice, which was not the case in 2012, when there were satellites to easily take handy photos to remove all doubt.
To map the minimum of summer ice in 1938 would have been impossible, as ice changes quickly in the heat of summer. One day a lake has ice, a week or two later, hey presto it's gone. Ships couldn't be everywhere at the minimum. The date in August 1938 would be relevant to the comparison. Maybe they missed the minimum by 3 weeks.
There were of course no satellites in 1938 and not a lot of aircraft flying over the area to report on something which was far less interesting than the Japanese and German rampaging murderous expansions across the planet, not to mention the USSR writ large and dangerous.
The Great Depression was on too, so there were not the swarming hordes of wealthy people with the luxury of investigating all sorts of natural phenomena.
The land mass is inaccurate, the ice extent is bound to be.
In any event, even if the reported 1938 ice coverage was accurate, it's not all that much different from 2012.
Oops, no edit function. Sorry. That should be: <<Since the land in 1938 was ill-defined, it seems a stretch to think that the ice, which changes constantly, every summer, would be anywhere near as well-defined as the land. >> I inadvertently reversed my meaning by adding a "not" where I should not have done. It isn't that I didn't put "not", it's that I did [I hope that triple inverted negative gets a small smile].
Maurice Winn,
I do not see where the 1938 map has ill defined areas of land. Please specify where you see ill defined areas. There are many Inuit settlements across the Arctic that observed the ice every year and towns in Russia. On September 12, 1876 no less than a dozen vessels were caught in the ice and abandoned northeast of Point Barrow. These were whaling vessels. In addition there were many trading vessels and as you mentioned air planes from the various countries in the area surveying the ice. This documents that dozens of ships traveled the Arctic every year tracking the ice. You are claiming ignorance of information when you are presented with data. You have not looked up what the sources of the data are.
Your last line summarizes your lack of knowledge. Look at the North West passage. It is choked with ice in 1938 (and all other years until 2006). In 2012 there is little ice. There is shorefast ice at Barrow in 1938 and hundreds of miles of open water in 2012. "not all that much different from 2012" is simply wishful thnking on your part.
Maurice Winn,
I too have trouble with parsing your "land mass surrounding the Arctic area is ill defined comment". After looking very carefully at both maps, sure there are a few areas of difference along coastal inlets, but they are minor innaccuracies. Certainly not enough to dismiss the whole 1938 ice reconstruction as innaccurate.
Also, there are better ways to analyse the data than just eyeballing it. Did you even read the main part of the post?
This is typical of "Fake Skeptics", trying to use minor discrepancies to discredit anything to do with Global Warming. Also, there are better ways to analyse the data than just eyeballing it. Did you even read the main part of the post?
Just looking at the map shows a massive loss of ice by 2012, and I really can't believe that you can't see it. A visit to Spec Savers is required perhaps?