


 Arguments


Residence Time and Prof Essenhigh
Posted on 3 October 2013 by Glenton Jelbert
Residence Time is something that crops up now and then in the denialist literature. A classic example is a 2009 paper titled “Potential Dependence of Global Warming on the Residence Time (RT) in the Atmosphere of Anthropogenically Sourced Carbon Dioxide” (Energy & Fuels 2009, 23, 2773) by Essenhigh. Thankfully Gavin Cawley has now managed to publish a response, which should settle the matter (http://pubs.acs.org/doi/abs/10.1021/ef200914u). However, I thought it might be helpful to explain the science with a simple analogy that is easily accessible.
In the original Essenhigh [1] paper a Sankey diagram is presented (reproduced below [2]). It includes the following data:
Flows into the atmosphere:
- 60Gt/y from vegetation
- 90Gt/y from surface oceans
- 5.5Gt/y from fossil fuels
- 155.5Gt/y Total
Flows out of the atmosphere:
- 61.3Gt/y into vegetation
- 92Gt/y into surface oceans
- 153.3Gt/y Total
Atmospheric content: 750Gt
Essenhigh's argument is that residence time (which is the content divided by the outflow) is 750Gt divided 153.3Gt/y, which equates to ~5 years. Therefore human contributions are irrelevant because the molecules of carbon dioxide that we put into the atmosphere are removed within 5 years.
What he ignores (though it’s equally clear in his own diagram) is that there is a net flow into the atmosphere of 2.2Gt/year. It is this flow that would be absent without fossil fuels (and other activities like deforestation) and therefore is rightly attributed to man’s behaviour.
Allow me to make a simple analogy with a queue (this idea comes from Prof David MacKay’s [3] highly readable Sustainable Energy: Without The Hot Air, which is available for free on-line):
Consider a queueing system which can handle 150 people per hour (cf 150Gt/y). Suppose 150 people are arriving per hour, and there are 750 people in the queue (cf 750Gt carbon content in the atmosphere). Then it is clear that a person will be in the queue for 5 hours (cf 5 year residence time).
However, if the number of people arriving goes up to 155 people per hour, clearly the queue will grow (cf an increase in the atmospheric carbon content), even though the queueing system will initially continue to have a ‘residence time’ of 5 hours (though it slowly grows from there).
From this it is apparent that the residence time is not the pertinent factor. In our analogy, the important factor is the number of people in the queue (cf the amount of carbon in the atmosphere). It is this that changes over the order of hundreds of years, even though any given molecule is only in the atmosphere for 5 years. The studies that calculate this time scale are not making the elementary error of forgetting about natural flows as is suggested in the Essenhigh paper.
For a more detailed discussion, including evidence from the shift in isotope concentration, see the more recent IPCC reports (also available for free). Section 2.3 (Chemically and Radiatively Important Gases), and Section 7.3 (The Carbon Cycle and the Climate System) are particularly relevant in this context.
The Essenhigh paper also makes the assumption that the exit flow is proportional to the atmospheric concentration (that is, that the exit from the atmosphere will increase as the CO? concentration in the atmosphere increases). This quibble is not as central as the queue analogy discussed above, but nonetheless is an interesting demonstration of how simple assumptions can give wrong results. The reality is that there are positive feedback loops in many cases, so that increased CO? causes heating which causes an increase in CO? (and other greenhouse gases) through the melting of permafrost, the heating of the oceans (which releases CO? as it heats), and the reduction of vegetation (for example the Amazon is projected to become drier as the climate changes). This could cause abrupt and irreversible climate change. Completely the opposite of Essenhigh's a priori assumption that higher concentrations cause higher uptake.
[1] Robert Essenhigh is an Emeritus Professor of Mechanical & Aerospace Engineering at Ohio State University.
[2] For the sake of readers who may not have access to Energy & Fuels, below is the diagram from Energy & Fuels 2009, 23, 2774

[3] David MacKey is the Regius Professor of Engineering at the University of Cambridge, and chief scientific advisor to the UK Department of Energy and Climate Change.


XRAY1961 @1, there have, in the past, been increases in CO2 concentration as large, and even larger than that (though probably not as rapidly). Therefore the mere fact of the increase does not prove that the increase was anthropogenic. Further, it is logically possible that the timing was mere coincidence - so while that timing is highly suggestive of the cause, it does not establish it to the standard scientists would normally accept. Fortunately, there are at least nine other lines of evidence that, together, establish beyond any reasonable doubt that the rise in CO2 concentration is anthropogenic.
Of these, one of the most important, and the one that Gavin Cawley most favours, is the mass balance argument. We know that the CO2 increase was anthropogenic, because each year, the total increase in CO2 is less than we put into the atmosphere. Therefore nature is taking CO2 out of the atmosphere each year, and consequently cannot have caused the rise in CO2 concentration.
Therefore the mere fact of the increase does not prove that the increase was anthropogenic.
I think that's not what XRAY1961 had in mind. I think he meant that since Essenhigh implies (or openly states?) that anthropogenic contribution is negligible, then the source of rising CO2 concentrations should be huge and therefore not difficult to isolate. So I wouldn't go with 'completely disproves', but it gives it a lot of problems.
It's astonishing that such faulty papers could get published. Beyond belief, really. I guess a college student could make such a mistake, but this ...
BojanD/XRAY1061 The fact that CO2 levels have been increasing at a time anthropogenic emissions have been rising doesn't disprove Essenhigh's hypothesis, but the fact that they have been rising more slowly than anthropogenic emissions does (as Tom points out).
The error usually made by these types of argument is to compare the gross volume of anthropogenic and natural fluxes into the atmosphere without considering the fluxes out of the atmosphere as well. The rise in atmospheric CO2 levels is caused by the difference between total emissions and total uptake. Anthropogenic emissions are small compared to natural emissions, but natural uptake is bigger still, and it is the difference between natural emissions and natural uptake that determines the natural comtribution of CO2 to the atmosphere (and it is negative!).
FWIW Essenhigh's paper says very little about what is causing the rise in atmospheric CO2, just that it can't be anthropogenic because the residence time is short. My paper explains why this is incorrect, residence time is short (4-5 years), but the conclusion does not follow.
Anyone can make a mistake, however the NIPCC report cites Essenhigh's paper and uses similar arguments, that is a far more egregious error as the problems with Essenhigh's paper had already been widely discussed in climate blogs and in the journal itself. It would ony take a google scholar search of the papers that cite Essenhigh's to have discovered that, which is basic scholarship.
The link in "Thankfully Gavin Cawley has now managed to publish a response, which should settle the matter (http://pubs.acs.org/doi/abs/10.1021/ef200914u)" doesn't work.
BillEverett The link http://pubs.acs.org/doi/abs/10.1021/ef200914u works for me. Hopefully the link in the article will be fixed shortly.
"Prof David MacKay’s [3] highly readable Sustainable Energy: Without The Hot Air" This link is not working. I think it wants to go to: http://www.withouthotair.com/
I do not think that Essenhigh's calculation of the residence time is accurate. Majority of CO2 molecules absorbed by the ocean and vegetation are not removed permanently but returned back to the atmosphere. So the more appropriate analogy would be: 150 people are processed an hour form the 750 in queue. 140 of them are returned back to queue, thus only 10 are removed from queue. Consequently the real residence time is 75 years, not 5.
vmin Residence time is defined as the mean length of time a molecule of CO2 remains in the atmosphere before being taken up by the terrestrial or oceanic reservoirs, so Essenhigh is correct in using the term residence time. His error lies in not understanding the difference between residence time and adjustment time, which is the characteristic timescale with which the atmospheric concentration responds to a change in sources and sinks (which corresponds to your 75 year figure). The IPCC define these differing definitions of lifetime in the glossary of the WG1 report, but unfortunately do not clearly distinguish between them in the report itself (although the 1990 report that Essenhigh cites makes the distinction very clearly).
Essenhigh's 5y residence time number is bogus not only because it fails to consider the natural inflow (emissions from ocean/biosphere back to atmosphere) but also because, due to limited capacities of the natural sink such as ocean, the flow rates (determined by Henry's law) change over time.
Only a part of CO2 molecules has a residence time of rougly 100y (a bit more than 75y calculated by vmin@8 but the same ballpark). In case of 1000GtC emissions, that part is some 50% - i.e. 500GtC of the original emissions being absorbed by the ocean surface results in OA reaching new equilibrium, therefore no more CO2 can be absorbed by Henry's law.
The rest (500GtC) must wait for the deep water mixing and the reaction with sediments which takes 1-10Ky. Only 300-400GtC is taken that way, again due to limited sediment capacity.
The rest (100-200GtC) must wait for the rock weathering processes which take sometime from 100Ky to 500ky (depending on current geological conditions).
So, the residence time is not a simple constant number when we are dealing with such big amounts comparable to the natural sink capacity. In case of the emission scenarios considered in Anthropocene, it means 10 to 20% of emissions will stay in A for up to half a million years.
Obviously, such science is well beyond Essenhigh, who makes very basic mistakes (i.e. ignores the inflow & Henry's law) that preclude any understanding of carbon cycle in geological sense.
chriskoz Essenhigh's 5 year figure for residence time is correct, and indeed agrees with the figure given in the IPCC WG1 report. His error lies in not understanding the distinction between residence time and adjustment time.
We should not be too hard on Prof. Essenhigh, his research record in his own field (combustion) appears to be very good, and it is all too easy to make this kind of error in moving into a tangentially related field. The email correspondence I had with Prof. Essenhigh while writing my response published in Energy & Fuels was generally very cordial.
A useful analogy (and a bit closer to the actual situation than the queue) especially here in Caifornia where lots of people have spas and swimming pools:
My pump circulates water into and out of my spa at an input rate of **** (fill in your
favorite number) and removes it at the same rate. But I have taken my garden whose
and added water at a much smaller rate (&&&&). The residence time for any molecule of water in the spa is short compared to the time the hose fills an empty spa, but does anyone think that it is not the hose that is causing the water level in the spa to increase?
There is a grain of hope, losely related to Prof. Essenhigh's contentions. Carbon dioxide varies about 7ppm annually or more accurately, 8 up and 6 down. Natural processes remove far more CO2 than any silly system we could devise to sequester Carbon dioxide. Of course we must first stop pouring Carbon dioxide into the atmosphere but then we could give Gaia a chance and restore her systems for removing CO2 to their full potential.
http://mtkass.blogspot.co.nz/2013/03/removing-atmospheric-carbon-dioxide.html
HELP!!! Could someone please help a poor confused bloke like me who comes here to help them do battle at the street level on the climate change front (think Daily Mail readers and the like)?
For instance, when 'debating' with a typical denier on the "global warming has stopped" meme, I have tended to use the argument that it takes ages (plus or minus an age or two) for CO2 to fall out of the atmosphere (and sod what Newton might have to say on the topic because apples are a lot heavier than CO2 molecules and thus fall more readily).
It follows that global warming cannot have stopped because the excess CO2 we have pumped into the atmosphere over that last half century or so is still airborne and will be there for a long time yet warming the planet as it does so. Five years is not even near half an age, so what number of years should I use in presenting my case, 5, 50, 75 or what?
I imagine the answer lies in the article somewhere, but it is well hidden from a simpleton like me.
funglestrumpet @14.
Archer 2005 concludes with the following line that may be what you are looking for. (I have edited a little it to make its meaning clearer.)
MA Rodger @ 15
Thanks, that is exactly what I was looking for!
funglestrumpet @14:
Man is adding CO2 and some of that is leaking back out. This we all seem to agree on. But..
The argument described at the top is a simplified model. Too simplified. It assumes that the atmosphere is a pipeline. It obviously is not. While an engine might have most of the air coming in at one location then move to exit elsewhere, perhaps crudely approximated as a single file queue, the atmosphere has lots of CO2 rise high to areas where there are few sinks. There is no physics that I know that suggests a model of a queue applies. The CO2 is *not* following a path single file that takes it way up high and then spins and comes down to leave at the ground level. That 5 year figure is the result of a simplified queue model. You can forget about it unless perhaps you want to believe the man-made CO2 entering and leaving the atmosphere is doing so in as a queue.
Another analogy is the difference between fast moving draft air in a narrow cooridoor that is open at each end. This is like a queue. The atmosphere instead is like a huge balloon with two openings near each other, where one opening slowly adds air and the other slowly removes it. In this balloon example, we have nothing resembling a queue.
Besides that the flow is not like a queue IMO, you are asking a different question than what is presented above. The five year is supposed to be the average time for CO2 to move into the atmosphere and back out, but the question you are asking is how long before we return to the same quantity of CO2 we had if we stop adding CO2. You care about how long before the air in the balloon gets back to the same quantity if we remove one of the several drivers adding air into the balloon.
If we stop adding, there will be a net loss of CO2 that will slowly work its way back towards a more natural condition. It will take many years to make it most of the way there, but like an exponetial decay curve (if that model were to resemble the effect) we would never really get back all the way. Of course, the earth is more complex. If we plant and manually sustain more trees (or add other CO2 sinks.. eg, consume CO2 via microorganisms that sequester the result in some chemical form), then we could not only get back to "normal" as defined by today's system but even go beyond it. And then there are planetary effects and basically a bunch of effects (feedbacks) that don't follow the exponential decay model either.
Sorry to not give you a precise answer. You asked in the right place and some studies address that concern. I just wanted to give an idea that what you are asking has nothing to do with this abstract 5 year calculation.
funglestrumpet @14, here is take two (using two different analogies than the earlier air in balloon analogy, water in tank and food in body).
The argument in this article (even if using a too crude model) is about how long it takes for a molecule of "man-made" CO2 to come into the atmosphere and leave.
Is that what you care about? If I have a large tank to which I am adding water but from which some water is leaving, do you want to know how long before the water molecule I add leaves at the bottom? Do you care if the addition is slow and the escape is slow so that the transit time is 1000000 years? Would it make a difference to you if instead the addition and escape were super fast and took 1 second?
I think the primary question (the question as goes global warming) is how fast that tank is being filled *after* we take into account the result of both the additions and the subtractions.
Do you want to know how fast it takes for the food you eat to exit OR do you want to know how much weight you are putting on after taking into account how much you eat and what leaves the body?
The latter is what is important. The argument above tries to make a claim about the latter based on (a crude) analysis of the former without taking into account net gains or losses.
If you care about the latter, then the answer you want is how long it would take for the CO2 to return to "normal" (ie, to some base reference level after factoring out natural factors that may change that reference level over time) after we remove the "man-made" components. Ie, you want to know how long before I return to my "normal" weight after I stop eating that extra dessert after every meal. How long it takes for the food to pass through your body (very fast or very slow) is irrelevant.
funglestrumpet @14, here is the summary:
We can roughly liken CO2 going into and out of the atmosphere using 3 analogies.
1 -- We don't care about how long it takes for extra man-made air put into a ballon, or water put into a tank, or food put into a body, to exit.
2 -- We care instead about how long it will take to return to normal volume once we stop adding the man-made air, water, or food.
The argument described in this article crudely measures how long it takes a man-made molecule of air, water, or food, to exit, but that doesn't address what we care about: how long it takes for these systems to return to the normal levels after we stop adding the man-made air, water, or food. I don't care about the speed of travel in my body of my daily cheesecake (from entry to exit). I care about how long before I lose the weight I put on because of that cheesecake.
Jose_X @ 17, 18 & 19 Thanks for taking so much trouble and effort to answer the question I didn't ask, but should have. Now I understand it better, thanks to you, I rather think I might have won a few discussions in the past rather unfairly! Still, all's fair in love and war, isn't it?!
Could someone please explain what is known about the dependence of the fluxes upon the amount of CO2 in each compartment of the system? That is, which fluxes are proportional to the concentration of CO2, which fluxes have a rate-limiting bottle-neck that is indifferent to the concentration, which have a combination of these (saturable kinetics), and so on? How would the magnitudes of the fluxes change, for instance, if atmospheric CO2 was 200 ppm (or 600 ppm) instead of 400 ppm?
The mass-balance argument suggests that nature has obligingly absorbed some of our excess CO2, with natural processes acting as a net sink, but is this something that could have been predicted from first principles, or is it simply an observation after the fact? To me, it suggests that sink fluxes are more active when there is more CO2 around, which is what I would have expected intuitively, but what does the evidence suggest?
Note that I'm not talking about potential positive feedbacks from permafrost melting, and so on, just the main fluxes at work now.
Thanks in advance for any clarification.
Leto @21.
That's a lot of question you present in 21 ranging from the basic to the quite technical. I will not address most of it.
CO2 is being absorbed by the oceans and the biosphere. For a long time that was but an inference based on ocean & atmosphere measurement & data for fossil fuel use. The biosphere absorption was not measured and assumed to be the sole missing CO2 sink. However, I hear the biosphere can now be assessed (estimated) as a sink.
These two sinks were always predicted although it took some time to fully understand why oceans didn't absorb much more CO2 than they actually did. The oceans can now be modeled with some confidence as a CO2 sink (See the Archer link @15 or AR4 for instance.) The net effect of the biosphere is not something that can be predicted so easily. Plants will absorb more CO2 at higher levels up to a point but such absorption depends on the type of plant involved and relies on climate providing the environment to maintain such growth. This reliance on climate extends to carbon within soils which can also become a significant source/sink with changes in rainfall or temperature (eg the permafrost melting). Thus predicting future biosphere absorption is only for the brave.
The amount of our emission that are presently absorbed is about 43% if changing land use is accounted for. This value waggles about with ENSO but has remained reasonably constant over the last half century. The value is simply the result of the rate of increase of our emissions. So far there is no obvious indication of changes in absorption in oceans or biosphere. Although saying that, the last 18 months has seen inceases in atmospheric CO2 higher than I would have expected during ENSO-neutral periods. Is it a marker of things to come? We will have to wait and see.
Re: "Atmospheric content: 750Gt"
Glenton, that was back around 1981. It's about 907 Gt, now:
(411 ppmv CO2 + 1.85 ppmv CH4) × 2.196 GtC/ppmv = 906.6 GtC.
funglestrumpet, the practical (first 2/3 or 63%) anthropogenic CO2 residence time is about fifty years.
Some folks claim much longer residence times for anthropogenic CO2, but, from a practical perspective, they're wrong. Those calculations are based on a modeled very "long tail." Since I don't think anyone believes that a CO2 level of 320 or 340 ppmv could have any deleterious effects (compared to 275 or 280), the long tail (representing CO2 levels below 330 ppmv) should be disregarded. All that matters is the first e-folding time.
DaveBurton said:
The residence time should actually be called an adjustment time and because of the fat-tail physics of diffusion, the value of that time is actually indeterminate and can be considered to be hundreds or thousands of years.
This is basic condensed matter physics and you can read more about this topic in our book Mathematical Geoenergy and specifically in Chapter 9 Section 6.
The issue with people like Dave Burton is that they have probably only encountered 1st-order models in their technical experience, and that's why they bring up concepts like "the first e-folding time" which is a dead giveaway to their lack of broader scientific knowledge.
Paul Pukite, it appears that you've missed my point. Don't you know what "from a practical perspective" means?
I thought this was clear, but I guess not: "Since I don't think anyone believes that a CO2 level of 320 or 340 ppmv could have any deleterious effects (compared to 275 or 280), the long tail (representing CO2 levels below 330 ppmv) should be disregarded."
Let me try again to explain it.
The folks who claim very long anthropogenic CO2 residence times (or adjustment times, if you prefer) do so to magnify the supposed harmful effects of elevated CO2 levels. It is a key parameter when calculating the so-called "social cost of carbon," used to set things like carbon tax levels and offset prices.
It is not a minor consideration. A 1000-year residence time is used to justify 20x the tax rate of a 50-year residence time.
Are you with me so far?
But everyone, even the most fervent alarmists, agree that there are no harmful effects from CO2 levels "elevated" to less than, say, 340 ppmv. So, since that "long, fat tail" represents CO2 levels below 330 ppmv, it is obviously a mistake to use it to magnify the supposed harms of CO2 emissions.
In the CO2 decay curve, the first e-folding time reduces the anthropogenic CO2 increment by about 63%. I think everyone understands that there are no plausible harms from CO2 levels that low. All that matters is the first e-folding time, which is about fifty years.
[DB] From the AR5:
“The removal of human-emitted CO2 from the atmosphere by natural processes will take a few hundred thousand years (high confidence). Depending on the RCP scenario considered, about 15 to 40% of emitted CO2 will remain in the atmosphere longer than 1,000 years. This very long time required by sinks to remove anthropogenic CO2 makes climate change caused by elevated CO2 irreversible on human time scale. {Box 6.1}”
https://www.ipcc.ch/site/assets/uploads/2018/02/WG1AR5_Chapter06_FINAL.pdf
Please note that posting comments here at SkS is a privilege, not a right. This privilege can and will be rescinded if the posting individual continues to treat adherence to the Comments Policy as optional, rather than the mandatory condition of participating in this online forum.
Moderating this site is a tiresome chore, particularly when commentators repeatedly submit offensive or off-topic posts or simply make things up. We really appreciate people's cooperation in abiding by the Comments Policy, which is largely responsible for the quality of this site.
Finally, please understand that moderation policies are not open for discussion. If you find yourself incapable of abiding by these common set of rules that everyone else observes, then a change of venues is in the offing.
Please take the time to review the policy and ensure future comments are in full compliance with it. Thanks for your understanding and compliance in this matter.
Inflammatory rhetoric and sloganeering snipped.
daveburton @24,
You seem to think that the (410-280=) 130ppm anthropogenic CO2 increase in the atmosphere would drop by 63% over a period of "about 50 years" (according to daveburton @22) and presumably conclude that today's CO2 levels would leave us with (280+0.37x130=) 330ppm after that time period. Even if your talk of e-folding time were applicable to the draw-down period of CO2 from the atmosphere, I don't think this use of the 63% is correct.
The anthropogenic emissions total 650Gt(C), enough to raise atmospheric levels from 280ppm to 585ppm if it were emitted all at once. The 410ppm in today's atmosphere has thus already lost 43% of its added CO2 and if emissions stopped today we could expect something like a further 37% reduction over 1,000 years, leaving perhaps a level of 340ppm in AD3000. And there it will stop for tens of thousands of years if natural processes are allowed to run their course.
While I have no inkling what you are considering with this multiplier of 20x for (20x50years=) 1,000 years residency time, I do wonder how it should be re-calculated for a residency time of tens of thousands of years now we will be leaving CO2 above your threshold 340ppm level for such long periods.
Yikes! Obviously my <pre> block with nicely formatted code got turned into one enormous line, and it ruined the formatting for the whole page!
I'm very sorry!
Please just delete that, Mr. Moderator.
Trying again, with explicit line-breaks added...
Mr. Moderator, I meant no offense, but I'm not aware of any comment policy that I violated, and I do not understand why you deleted so much of my comment.
MA Rodger, here's where the "about fifty year" practical residence/adjustment time comes from. Well, actually, a number of scientists have independently calculated approximately the same figure, but this is how I did it.
Start with the observation that the rate at which natural systems (oceans & terrestrial biosphere, mainly) remove CO2 from the air is governed chiefly by the CO2 level in the air. When the CO2 level is higher, so is the removal rate. When the CO2 level is lower, so is the removal rate.
Some people think the removal rate is governed by the emission rate, and that it's necessarily "about half" (leaving an "airborne fraction" which is also about half). They are mistaken. There is no physical mechanism by which any of the major contributors to the removal rate could be governed by the emission rate. It is the CO2 level, not the CO2 emission rate, which primarily governs the removal rate.
For the oceans, the removal mechanism is dissolution into surface water per Henry's Law, and then then transport to the ocean depths by currents and calcifying coccolithophores, and complex chemistry which is beyond my ken.
For the terrestrial biosphere it is "greening."
AR5 estimates that the terrestrial biosphere removes about (2.5/9.2) = 27% [p. 6-3] or 29% [Fig 6.1] of anthropogenic CO2 emissions from the atmosphere, each year, and that the oceans remove another 26% [Fig 6.1]. (There are wide error bars on those numbers, but the ≈55% sum has narrower error bars than the two addends have.)
Of course, other things also affect the CO2 removal rate, as is obvious, for example, from the detectable effect of very large volcanic erruptions on measured CO2 levels. But the most important factor governing the CO2 removal rate from the atmosphere is clearly the CO2 level in the atmosphere.
Those numbers are known, with fair precision. For the last sixty years we have very good records of both atmospheric CO2 levels and production/use rates of fossil fuels & cement (from which can quantify the main sources of anthropogenic CO2 emissions).
From those data we can calculate how much CO2 was removed from the atmosphere by natural sinks (oceans, biosphere, etc.), each year.
Since we also know the atmospheric CO2 level each year, we can easily build a spreadsheet, and fit a curve, showing the approximate net rate of CO2 removal as a function of the CO2 level.
Dr. Roy Spencer did that, and found it is very closely approximated by a very simple function, which you can read about here:
http://www.drroyspencer.com/2019/04/a-simple-model-of-the-atmospheric-co2-budget/
Using Dr. Spencer's "simple model," I wrote a tiny Perl program to simulate the effect on atmospheric CO2 level of a sudden cutoff of CO2 emissions. Counting 280 ppmv as "pre-industrial," 63% of the anthropogenic CO2 is gone from the atmosphere in 54 years, and 2/3 is gone in 60 years:
Here's the result of a simulation run, with CO2 starting at 410 ppmv in 2019, and zero emissions:
2019 410.0
2020 407.3
2021 404.7
2022 402.2
2023 399.7
2024 397.2
2025 394.8
2026 392.5
2027 390.3
2028 388.0
2029 385.9
2030 383.8
2031 381.7
2032 379.7
2033 377.7
2034 375.8
2035 373.9
2036 372.1
2037 370.3
2038 368.5
2039 366.8
2040 365.1
2041 363.5
2042 361.9
2043 360.4
2044 358.8
2045 357.3
2046 355.9
2047 354.5
2048 353.1
2049 351.7
2050 350.4
2051 349.1
2052 347.9
2053 346.6
2054 345.4
2055 344.3
2056 343.1
2057 342.0
2058 340.9
2059 339.8
2060 338.8
2061 337.8
2062 336.8
2063 335.8
2064 334.9
2065 333.9
2066 333.0
2067 332.2
2068 331.3
2069 330.4
2070 329.6
2071 328.8
2072 328.0
2073 327.3 <== residence/adjustment time (e-folding time) = 54 years (using 280 ppmv as base)
2074 326.5
2075 325.8
2076 325.1
2077 324.4
2078 323.7
2079 323.0 <== two-thirds of the anthropogenic CO2 is gone in 60 years (using 280 ppmv as base)
Of course we know that this simple model would not accurately model the "long, fat tail," with CO2 levels under 300 ppmv. But the point I made previously is that, for practical purposes, that doesn't matter, because we all know that CO2 levels that low are harmless.
[BW] I tried to correct your comment by adding some more line breaks - may make the code itself not work, though due to syntax errors now.
Daveburton @27 ,
someone of note once said: things should be made as simple as possible . . . but not too simple.
Dr Spencer has made an interesting exercise in curve-fitting, somewhat resembling the multi-planet atmospheric pressure/temperature curve-fitting that "demonstrated" the non-existence of the GreenHouse Effect. ( To his credit, Spencer has always been scathing about those who claim the non-existence of the GHE. )
For the "simple model", Dr Spencer has also made some peculiar assumptions about the "natural equilibrium" ; about terrestrial biosphere CO2 draw-down ; and about the oceanic contribution ( CO2 solubility, buffering, and overturning currents timescales ).
The Spencer "simple model" is so simple, that it is simply unphysical.
I would like to think Dr Spencer would consider it a waste of your time for you to rest an important argument on such over-simplicity.
Thanks, Mr. Moderator!
I'm sorry, I guess trying to post code in-line was just a bad idea. The tiny program is in this archive, as calc_est_co2_removal_rates_v02.pl along with everything else needed to run it under Windows, and some other stuff:
http://sealevel.info/CO2_Residence_Times/allfiles2.zip
Eclectic, Dr. Spencer's simple model is doubtless a good approximation of reality as long as CO2 levels are well above 300 ppmv, which corresponds to atmospheric CO2 levels and removal rates that are known with good accuracy. For CO2 levels below 315 ppmv (dates older than 1958) the numbers get fuzzier.
Did you notice the relatively high "natural equilibrium" level he found (295 ppmv)? That might reflect the anthropogenic additions to larger carbon reservoirs, like ocean and soil, and it might be evidence of the widely assumed "long, fat tail."
Yes, thank you, Daveburton, I noticed the 295ppm figure — and also the 500ppm figure that the model indicates cannot be exceeded under Dr Spencer's stated conditions of artificiality.
Curiouser and curiouser, as Lewis Carroll would say. As you know, he ("Carroll") was a mathematician — but even the delightful nonsenses his fertile mind created, had not extended into acronyms like GIGO. He would have had fun with that sort of thing !
daveburton @27,
The problem is as described by Eclectic @28&30. Roy Spencer is not renowned for errorless analysis. This 2018 blog of Spencer's you rely on is no more than an exercise in curve-fitting that leads to the ridiculous conclusion that if humanity restricts itself to pumping 10Gt(C)/year of CO2 into the atmosphere (as it did in 2018), continuing year-after-year for ever-&-ever-&-ever, the atmospheric CO2 level will stablise over 200 years at 500ppm(v) CO2.
This is plainly nonsense. Where does all this extra carbon accumulate? And if paleoclimate studies show atmospheric CO2 levels in past eons at 2,000ppm for over a hundred million years, were did the carbon come from to maintain such levels? According to Spencer's model, simply to maintain it at 500ppm over such a period would require emissions upward of 1Zt(C). I'm pretty sure the planet doesn't contain that much carbon!!
You are perhaps correct to suggest that many misinterpret the Airbourne Fraction which is simply a product of our rising emissions. It is not a subject much discussed beyond the Af concept itself. In terms of the draw-down mechanism, Af is a very poor concept to start from. So in Af terms in 2018, that 57% of 2018 CO2 emissions drawn-down out of the atmosphere is better seen as comprising something like a draw-down of 4% of the emissions 2014-18, 2.5% of the emissions 1999-2013, 0.6% of the emissions 1919-98, etc. These approximate numbers I obtain by scaling one of the 1000_cswv plots in Fig 1 of Archer et al (2009) 'Atmospheric Lifetime of Fossil Fuel Carbon Dioxide' which models a single 1,000Gt(C) impulse. The draw-down dynamics under the gradual release of AGW mean these numbers will not entirely match the AGW numbers, but they do well enough as a rough guide.
Eclectic wrote, " ...the 500ppm figure that the model indicates cannot be exceeded under Dr Spencer's stated conditions of artificiality."
Dr. Spencer's simple model does not say that 500 ppmv can never be exceeded under any circumstances. But if emissions are held steady at 10 Gt/year, atmospheric CO2 level will level-off at just shy of 500 ppmv.
That should not surprise you. It is a natural result of the historically-verified fact that when CO2 levels go up, so do CO2 removal rates. That simple fact, alone, even without reference to a particular quantified model, ensures that a constant CO2 emission rate must result in a plateau in CO2 level.
Do you have an electric stove or toaster? Even though you keep pumping electricity into the nichrome wires, the temperature levels off, and ceases to rise. That's simply because the rate of energy loss rises with the temperature. So the temperature plateaus as it approaches equilibrium: the level where incoming and outgoing energy flows are balanced.
Since the rate of CO2 loss from the atmosphere rises with the CO2 level, the CO2 level must plateau, as it approaches the level at which the flows of CO2 into and out of the atmosphere are the same.
MA Rodger wrote, "This is plainly nonsense. Where does all this extra carbon accumulate?"
It's not nonsense, it's fact.

The extra carbon migrates to other reservoirs, like the oceans (the biggest), soil, marine sediments, etc. Those reservoirs dwarf the amount of CO2 in the atmosphere, and, importantly, dwarf the amount of carbon available in recoverable fossil fuels.
MA Rodger wrote, "if humanity restricts itself to pumping 10Gt(C)/year ... continuing year-after-year for ever-&-ever-&-ever..."
Fossil fuels are a finite resource. So we obviously will not (cannot!) continue to emit 10 GtC/yr from fossil fuels "for ever and ever."
Have you never wondered why most people assume CO2 levels won't ever exceed 600-800 ppmv? It's because for CO2 levels to continue to rise at their current rate, CO2 emissions must continue to accelerate — and resource constraints ensure that that can't continue forever. So the rise in CO2 levels must taper off.
What's more, even if CO2 emissions accelerate fast enough to maintain the current growth rate in atmospheric CO2 level, that would mean CO2's climate forcing trend will fall below linear. Since the warming effect of CO2 is logarithmically diminishing, in order to maintain a linearly increasing temperature forcing from CO2, the growth rate of CO2 levels in the atmosphere must increase approximately exponentially.
That is, in fact, what has happened, for the last forty years or so. CO2 emissions have increased so dramatically that CO2 levels have increased on an approximately exponential curve, so the temperature forcing from rising CO2 levels has increased at an approximately linear rate (actually slightly more than linear). You can see that in a graph of log(CO2). Notice how straight the graph is for the last forty years:
https://www.sealevel.info/co2.html?co2scale=2
Sorry, Daveburton, but your heated-wire analogy is even wider of the mark than Dr Spencer's much-too-simple Simple Model.
The design of the Simple Model fits at best tangentially with physical reality. And 40 years is a short period — nor do we have the luxury of time to sit back and observe another 40 years or so, as the Simple Model diverges from the (complex) real world.
As MA Rodger points out : the paleo evidence demonstrates the falsity of Spencer's too-simple Simple Model.
daveburton @32,
Yes, the oceans are big. Yes, the oceans contain contain sixty-times the carbon found in the pre-industrian atmosphere (which was in full equilibrium with the oceans). But what has that got to do with your "fact"?
The ocean carbon content is a complex mix of carbonate species that populate our salty seas. The actual amount of dissolved carbon dioxide in the whole global ocean is a tiny portion of the total, perhaps 200Gt(C), less than a quarter of the carbon dioxide in the atmosphere. It is this alone that that the atmosphere directly balances with (this balance achieved only when it appears at the surface).
Given the complex set of carbonate species within the oceans and the complex ocean currents, it is very odd that they would ever allow atmospheric levels to remain constant while the ocean absorbed a large constant flux of dissolving CO2. (When I say "very odd" I mean it is utter nonsense.) And were it not so, the accepted scientific works on the subject would be themselves very odd.
Have you actually examined the workings of Spencer's model? (The spreadsheet of it is linked on this Spencer blogpage) If you set the future anthropogenic emissions to a fixed value (Spencer sets it to 10.109Gt(C)/yr) , atmospheric CO2 levels tend to a constant value:-
So drop emissions to zero and see the pre-industrial CO2 level restored in two centuries. while negative emissions, suck out 15Gt(C)/yr and by AD2191 the atmosphere is entirely denuded of CO2.
daveburton, doesn't that strike you as "very odd"?
Eclectic wrote, "your heated-wire analogy is even wider of the mark..."
It is just a simple example illustrating a general principle. It's how negative feedback systems work. If the removal rate increases with system output level, that's a negative feedback mechanism. A constant forcing input will then result in a plateau at "equilibrium," where the negative feedback has caught up with the constant input.
That's true when the input forcing is energy added to your toaster via electricity, and the negative feedback mechanism is radiative & convective heat loss from a nichrome wire.
It's also true when the input forcing is CO2 added to the atmosphere, and the negative feedback is CO2 removal from the atmosphere via dissolution in the oceans and terrestrial plant uptake.
The principle is true regardless of whether the negative feedback is linear or nonlinear. For the nichrome wire example, there are actually three significant negative feedbacks, all with different transfer functions: radiative heat loss goes up in proportion to the 4th power of the temperature relative to 0K, convective heat loss goes up in approximate proportion to the temperature difference between the wire and ambient air, and the resistance of the wire also goes up with temperature. The fact that all three have different-shaped transfer functions doesn't affect the conclusion: because they are negative feedbacks, a constant input (forcing) must result in a plateuing output, gradually approaching equilibrium.
Eclectic continued, "The design of the Simple Model fits at best tangentially with physical reality."
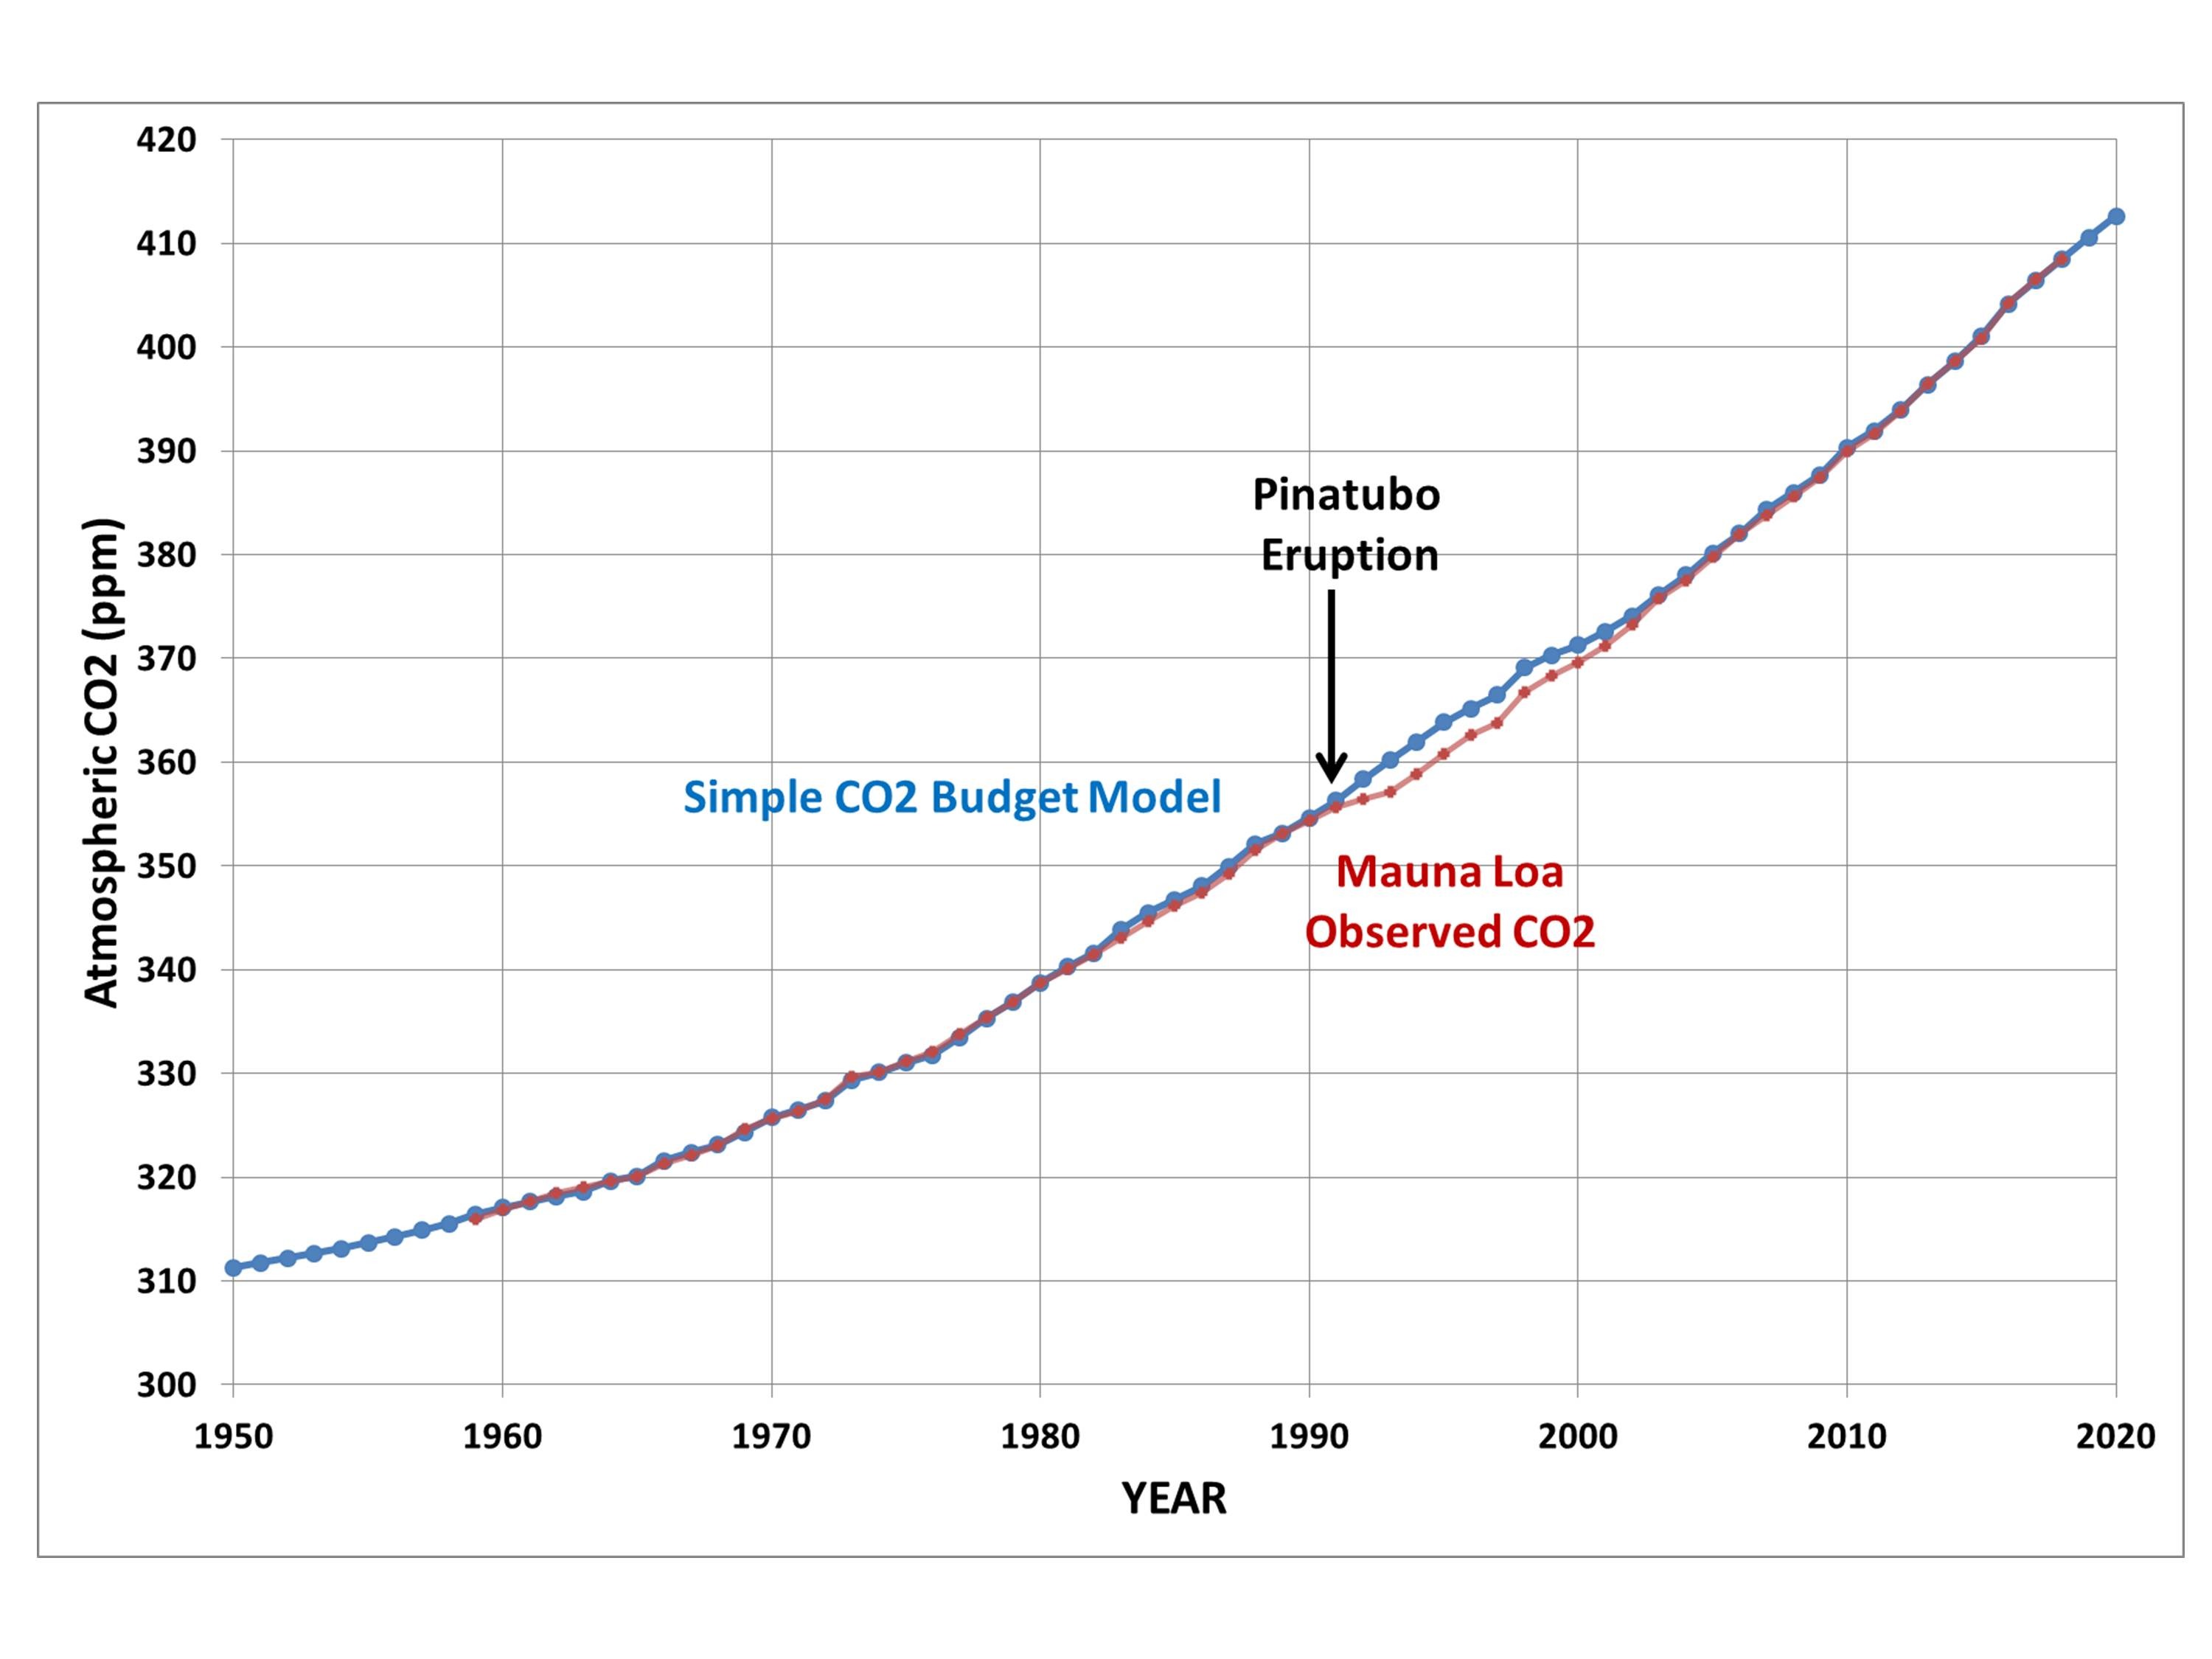
It fits extremely well for the period for which we have accurate measurements:
Eclectic continued, "nor do we have the luxury of time to sit back and observe another 40 years or so, as the Simple Model diverges from the (complex) real world."
Well, I obviously don't, at my age.
But mankind does have that luxury, and you should not expect Roy's Simple Model to diverge much from reality over the next 40 years. It is the "long, fat tail" (due to increased carbon levels in non-atmospheric reservoirs) which is not modeled by the Simple Model. Regardless of what happens with CO2 emission rates, CO2 removal over the next 40 years will be dominated by the removal mechanisms which the Simple Model models well.
Eclectic continued, "the paleo evidence demonstrates the falsity of Spencer's too-simple Simple Model."
All models are false, but some are useful. Roy's Simple Model is very useful. It is a very good fit to measured reality, and it will continue to be a good fit as long as the CO2 removal mechanisms which are currently most important continue to be most important. When CO2 levels drop below 300 ppmv, and the accumulation of anthropogenic carbon in non-atmospheric reservoirs becomes an important factor affecting atmospheric CO2 levels, then his Simple Model will diverge from reality.
MA Roger wrote, "Yes, the oceans are big. Yes, the oceans contain contain sixty-times the carbon found in the pre-industrian atmosphere (which was in full equilibrium with the oceans). But what has that got to do with your "fact"?"
Mankind has increased CO2 level in the atmosphere by about 47%. We've increased carbon content in the oceans by only about 0.4%.
So, why does that matter? Because it is that accumulation of carbon in non-atmospheric reservoirs that is not modeled by Roy's Simple Model. In other words, his Simple Model assumes the other carbon reservoirs have infinite capacity.
That's a pretty good simplifying assumption, as long as the anthropogenic increase in atmospheric CO2 dwarfs the anthropogenic increase in carbon in other reservoirs. It will diverge from approximating reality during the "long, fat tail," when the anthropogenic increment in atmospheric carbon dioxide no longer dwarfs the anthropogenic increase in carbon in other reservoirs.
MA Roger wrote, "it is very odd that they would ever allow atmospheric levels to remain constant while the ocean absorbed a large constant flux of dissolving CO2."
Atmospheric levels will remain constant when transfer of carbon to the oceans and other carbon reservoirs removes CO2 from tha air as quickly as anthropogenic emissions are adding it. (They're currently removing it only about half as fast as we're adding it.)
MA Roger asked, "Have you actually examined the workings of Spencer's model?"
Of course.
MA Roger wrote, "If you set the future anthropogenic emissions to a fixed value... atmospheric CO2 levels tend to a constant value"
Which is, of course, correct.
MA Roger wrote, "while negative emissions, suck out 15Gt(C)/yr and by AD2191 the atmosphere is entirely denuded of CO2. daveburton, doesn't that strike you as "very odd"?"
Not at all. If you start with a physically impossible assumption, you get a physically impossible result. The only thing I can think of which could possibly remove a net 15 GtC/year from the atmosphere when CO2 levels are below 300 ppmv, is some idiot genetically engineering a fast-growing, fast-propagating C4 tree.
Please don't do that! The Earth doesn't need another K-T Extinction!
Daveburton ,
I appreciate your comedic comments about wires and feedbacks. Although they belong in an earlier lesson than Homeostasis 101.
Likewise, Dr Spencer's Simple Model provides farcical amusement, thanks to its disconnect with reality — why yes, its curve fits reality at least in part . . . just as the Aristotelian model of the planets is a moderately good fit to the observed motion of the planets across the night sky, at least in part!! But unlike our Spencer, our Aristotle had a decent excuse for his blunders.
Daveburton, when I mentioned sitting back and observing "another 40 years or so" , I was of course not alluding to the future experience of someone as unimportant as me (or possibly you). Or perhaps you were just pulling my leg about "that", too.
No . . . I was alluding to something far more important: namely the human race. And here we get to the crunch, Daveburton, the really important point about Spencer's far-too-simple-to-be-scientifically-useful model.
# What do you think was the actual underlying reason for Dr Spencer to publicize his strange little "Simple Model".
( Not for comedy, I suspect. Nor for the edification of genuine climate scientists.)
daveburton @35,
It would be better if you could come up with some support for your advocacy of Spencer's silly model rather than presenting unsupported assertions that it is "correct". All we have otherwise is the 'big ocean' which you say must be thus effectively an infinitely large sink. You tell us "Mankind has increased CO2 level in the atmosphere by about 47%. We've increased carbon content in the oceans by only about 0.4%." (Note Roy doesn't reckon to your 47% figure.)
If that was correct that the percentage ocean carbon increase has to match the atmospheric percentage increase (which it doen't), that will have massive implications for a whole lot of stuff. (1) The projections of CO2 levels in the RCP scenarios would be massively revised if Spencer's model were anything like reflective of reality. Now I know Spencer denies that CO2 has any sigificant warming impact on the climate but this CO2 model would give him a brilliant second string to his contrarian bow (and how he needs one, as the other ones have proved pretty useless). (2) The implications for ocean acidification are massive and for fresh water it doesn't bear thinking about. (3) The low CO2 levels of the ice ages will have to be entirely re-thought. If atmospheric CO2 levels drop by a third, there would be 13,000Gt(C) being pumped out the oceans and into .... where? Golly, that's a tricky one!!
Yet (and I note that up-thread I wrongly called it a blog from last year 2018) in the four months since this model was posted (April 2019), I see no reference to it beyond that blog. It didn't even get a posting on the planet Wattsupia (which is a really bad sign!!!) Is Spencer too busy chatting to fellow contrarians at the Heartland Institute (where he seemed to have said nothing about his grand revalation)? So why the silence? My take is that Spencer's model is so embarassing that Spencer hopes it goes away. So, daveburton, you are not helping the reputation of poor old Roy with your insistence that his model is correct (when it patently isn't).
By the way, that long fat tail may be a lot stumpier than Spencer's model implies. The idea that the oceans are sucking up carbon at a rate constant with the level of atmospheric CO2 above an equilibrium of 295ppm(v) doesn't seem to hold over the period 1958-2010. Rather than a constant level of uptake, the rate has dropped by a half from the start of this period (1959-78) to the end of this period (1991-2010). That isn't exactly constant over centuries as Spencer's model assumes.
In truth, daveburton, your words do correctly assess Spencer's model when you say "If you start with a physically impossible assumption, you get a physically impossible result." That is exactly what Spencer's silly exercise in curve-fitting has done.
DaveBurton:
You seem to be using terms like "fact" and "observation" a lot when what you are saying does not fit their definitions. You also say "If you start with a physically impossible assumption, you get a physically impossible result." Let's look at the model you present in that light.
When you present the model in comment #27, you claim:
This is only crudely close to reality. The rate of CO2 from the atmosphere to the land and oceans requires a gradient, not a concentration. The rate will depend not only on that gradient, but on the efficiency that CO2 can move along that gradient. In fact, the model you present has that explicitly, where in your code you say (bolding mine):
The gradient is the result of the expression "$co2level - 295.1", and the efficiency of movement along that gradient is the value 0.0233 in the expression "$co2elevation * 0.0233". (That coefficient must have units that include a per unit time term)
In this model, there is an implicit assumption that the only stable CO2 level is 295.1 pm. Any excess above that value will be removed until CO2 returns to 295.1 ppm.
Oddly, it also state that the removal rate is zero if CO2 concentration falls below that point. Thus, it assume that there are no natural processes capable of lowering CO2 level below that majick value of 295.1 ppm. This falls into the "not even wrong" category, as we have indirect observations of CO2 levels much below this during the last glacial periods.
The model clearly starts with a physically impossible assumption. So, in your own words, it produces a physically impossible result.
...But let us consider the possibility that something majick can occur, so that the surface can somehow maintain a concentration of 295.1 ppm so it can suck the CO2 out of the air any time the atmospheric concentration is >295.1 ppm. What does it do with that CO2? It can't stay at the surface, because in the model the surface is always capable of sucking CO2 out of the air even if the atmospheric concentration is only 295.2 ppm. There must be some gradient to move CO2 away from the surface into the oceans or land.. And whatever is moving it into the coeans and land must majickally stop when atmospheric CO2 drops to 295.1 ppm, because if it didn't then the surface CO2 concentration would have to drop if there is no replacement of CO2 from the atmosphere. Remember? In your code you said:
Now, you may try to argue that this model only applies to the special CO2 that is added due to human activities. To make that claim you are going to have to provide some sort of plausible mechanism by which nature can tell the difference between an atmospheric CO2 molecule that came from burning fossil fuels, and one that came from the multitude of natural sources. (Hint: it can't.)
To loosely quote Monty Python's Oscar Wilde sketch, the model you present is not a "gleaming shaft of gold".
Since rate of removal is proportional to gradient, and sea is gradually becoming more saturated, then over time spans of 100s to 1000s of years, CO2 removal must slow (in fact as oceans heat, they will expel CO2 not absorb it).