Climate Science Glossary

Term Lookup

Enter a term in the search box to find its definition.

Settings

Use the controls in the far right panel to increase or decrease the number of terms automatically displayed (or to completely turn that feature off).

Term Lookup

Settings


All IPCC definitions taken from Climate Change 2007: The Physical Science Basis. Working Group I Contribution to the Fourth Assessment Report of the Intergovernmental Panel on Climate Change, Annex I, Glossary, pp. 941-954. Cambridge University Press.

Home Arguments Software Resources Comments The Consensus Project Translations About Support

Twitter Facebook YouTube Mastodon MeWe

RSS Posts RSS Comments Email Subscribe


Climate's changed before
It's the sun
It's not bad
There is no consensus
It's cooling
Models are unreliable
Temp record is unreliable
Animals and plants can adapt
It hasn't warmed since 1998
Antarctica is gaining ice
View All Arguments...


Username
Password
New? Register here
Forgot your password?

Latest Posts

Archives

The Deep Ocean Warms When Global Surface Temperatures Stall

Posted on 2 October 2011 by Rob Painting

Despite being the warmest decade on record, the last decade has seen a slowdown in the rate of global warming in some temperature datasets. The factors responsible for this slowdown have been discussed at SkS, most recently in the SkS post Ocean Heat Content And The Importance Of The Deep Ocean, which looked at three Hadley Centre climate models. 

Meehl (2011) is also climate modeling-based study, which finds that decade-long periods of little or no warming are relatively common in the model simulations. This helps to explain why global warming is not a steadily rising, or monotonic trend, consistent with the temperature observations to date (Figure 1).

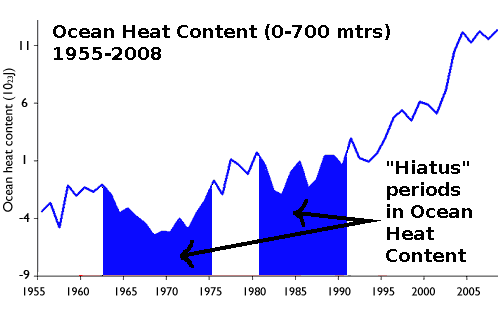
Figure 1 - Ocean heat content (0-700 mtrs) for the period 1955 to 2008. Adapted from Levitus (2009). Two periods of ocean warming hiatus highlighted in blue. Both periods exceed 10 years in length.

This see-sawing of upper ocean heat is simply part of the natural variability inherent in the climate, which occurs even during periods where the ocean is experiencing long-term warming. During these "hiatus" periods the surface layers of the ocean undergo little or no warming, but the ocean below undergoes substantial warming.

Where's the heat at?

Meehl (2011) use the Community Climate System Model (CCSM4) to simulate a future global warming scenario where the top-of-the-atmosphere (TOA) energy imbalance is similar to that observed in the last decade. Five model runs in which the Earth system is accumulating heat but the global surface temperatures show decade-long hiatus periods are examined (Figure 2).  Note that the declining trend in the later part of the 21st Century simulations in Figure 2 is due to the emissions scenario chosen - where CO2 emissions are supposed to decline.

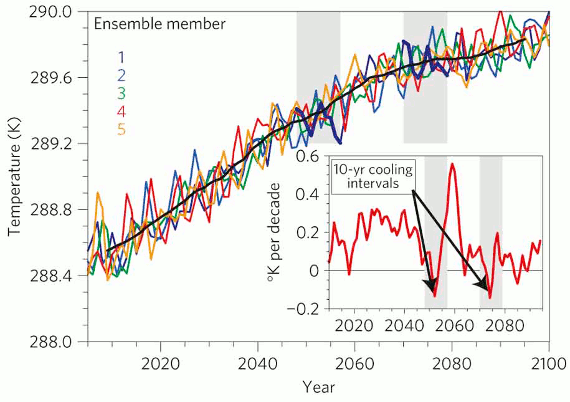
Figure 2 - Annual mean (globally averaged) surface temperature for the 5 climate model runs examined. Coloured lines are the models runs and black line is the mean (average) of the model runs. Inset are two ten-year negative-surface-temperature-trend periods. From Meehl (2011)

The authors look at the two hiatus periods (chosen because of the negative global surface temperature trend) from the 5 models runs shown above, plus 6 others from other model runs, giving a total of 8 hiatus periods from the model simulations. Analysing these hiatus periods reveals that, compared to other decades, a far greater amount of heat goes into the ocean in the 300 to 750 metre layer, and the 750 metre to ocean floor layer (Figure 3).


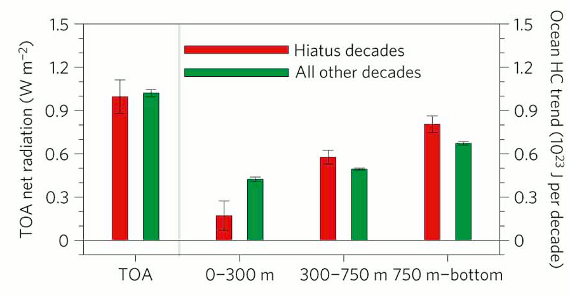
Figure 3 - composite global linear trends for hiatus decades (red bars) and other decades (green bars). Positive values for TOA net radiation (left-hand side) indicate energy accumulating in the system (i.e. global warming). Right-hand side shows ocean heat content decadal trends, for the various ocean layers.

The model therefore shows that greater amounts of heat are being sequestered in the deep ocean when global surface temperatures are in hiatus periods.

Ocean basin trends  

Looking at the ocean basins, in the model runs, the authors find various processes are at work in each basin. In the Atlantic and Southern Oceans, there is a marked drop in heat content in the upper 300 metre layer, with moderate increases in the layers below 750 metres. Meanwhile in the Pacific and Indian Oceans, the reduction in heat content in the upper 300 metre layer is much smaller, and the greatest increase in heat content occurs in the mid-ocean layer (300-750 metres).

The general pattern of warming and ocean circulation in the model, during these hiatus periods, is very similar to that which occurs over shorter timeframes in the La Niña phase of ENSO. Strong upwelling in the equatorial eastern Pacific brings cold water up from the deep, which cools air temperatures in this region. Meanwhile in the subtropics of each hemisphere, heat is piling up and being driven down into deeper layers. The typical sea surface trend for these hiatus periods is shown in Figure 4.


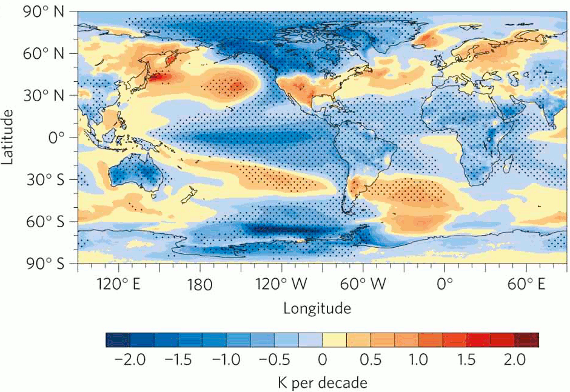
Figure 4 - Composite average global surface temperature trends for hiatus decades, (from the climate models); stipling indicates 5% statistical significance (i.e a 5% probability the result was due to chance or statistical error). Orange-coloured ocean areas represent regions where OHC is converging and being driven down into the deep.

Ocean heat coming back to haunt us?

Not only does the climate model-based study, Meehl (2011), show heat is buried into deeper ocean layers when global surface temperatures stall, but it also presents plausible mechanisms in ocean circulation that transport heat down to the deep ocean. The general pattern of sea surface temperature during these hiatus periods is very reminiscent of a La Niña-like climate state.

The regular nature of these hiatus decades in the climate model, indicate that they are simply periods of natural variability, which occur even in the presence of a long-term warming trend. This is supported by historic observations (Figure 1), which shows roughly decade-long hiatus periods in upper ocean heat content during the 1960s to 1970s, and the 1980s to 1990s.

The natural variability 'flip-side' to these hiatus decades, are periods where there is greater-than-average surface warming (see inset in Figure 2). So at some point in the very near future we can probably expect surface temperatures to gather up a head of steam, and begin rising at a rapid rate. 

Related SkS posts: Deep ocean warming solves the sea level puzzleBillions of Blow Dryers: Some Missing Heat Returns to Haunt Us, Ocean Cooling Corrected, Again, and Ocean Heat Content And The Importance Of The Deep Ocean

0 0

Printable Version  |  Link to this page

Comments

1  2  Next

Comments 1 to 50 out of 71:

  1. "...the last decade has seen a slowdown in the rate of global warming..." Of course it has very little significance in scientific terms but, fwiw, today was the hottest October day ever recorded in the UK -- 29.9C. Very pleasant it was too.
    0 0
  2. Yes John, but the Antarctic Oscillation Index is strongly negative - so down here in New Zealand, we're copping a lot of cold & unsettled weather. It sucks!
    0 0
  3. These decadal studies leave me unimpressed. Bill Chameides at Duke has a very similar posting, in which he shows this graph: Looking from the change between decadal averages since the 70s, it sure looks like the same 0.16C per decade. That is consistent with tamino's how fast is earth warming? trend. Where's the stall?
    0 0
  4. Thanks Rob, very interesting article.
    Despite being the warmest decade on record, the last decade has seen a slowdown in the rate of global warming in some temperature datasets.
    Meehl et al 2011 provides references to support the statement that "the observed energy imbalance at the top-of-atmosphere for this recent decade indicates... a net energy flux into the climate system of about 1 W /m²" - unfortunately I can't see what those references are, on the Nature site. Does anyone know? Obviously we don't have a way of reliably measuring the energy content of the entire climate system but if we can reliably measure a TOA energy imbalance then we know for sure that the energy content is increasing. Is it reasonable to take the increasing global sea level over the last decade as confirmation that there has been no slowdown in increasing total energy content? - Can regional sea level, gravity or any other satellite data tell us anything about temperature changes in the deep ocean, if we haven't got adequate ways of measuring it in situ?
    0 0
  5. Did I post this- or did it get deleted? - I would find this more compelling if there was data, not just model output - Do the models invoke some mechanism for the heat transfer into the deep ocean? Do you know which one(s) is activated and does it provide any guidance toward a quick study to validate mechanism and predicted temperatures?
    0 0
  6. This raises a question I've long wondered about - how well do climate models simulate ocean circulation?
    0 0
  7. Some nice visuals on ocean currents from JPL: [Source]
    0 0
  8. Great summary, some of the text is a bit confusing (as is the title), in that it makes it look like they did measurements, rather than model runs. I do believe this is very likely occurring, but it could be more clear that this is a modeled result. It might also be nice to have a post or addendum on other pieces of evidence of deep ocean heating (actual measurements, sea level, etc...)...or link to another sksci article...
    0 0
  9. Craig Allen @6 I suspect that the ocean circulation component of the climate models is one of the hard aspects. Modelling fluid flows in the short term to determine energy transports while also getting longer term fluctuations in the flows - volumes but far more importantly, 3D distribution is always going to be hard. You might get the short term stuff right but not pick up the longer term oscillations as well. Or vice versa. So modelling climate variabilty which is the oceans dog wagging the surface temp tail is always going to be hard. Thats why reading too much into surface trends without looking at the total system changes is a bit pointless.
    0 0
  10. Muoncounter @ 3 - the issue is: why is there short-term natural variability? Take it as given the authors of this study understand there is a long-term warming trend. Choose different start/end points for the decades (in your graph), and see what happens. The late 1950's to late 1960's appears to be a hiatus decade for instance. Is that clearer? Icarus @ 4 - Meehl (2011) refers to Hansen (2005) and Trenberth, Fasullo & Kiehl (2009). As for the top-of-the-atmosphere (TOA) energy imbalance, there are upcoming posts on this issue - it's not cut and dried. I think it boils down to this: was the slowdown due to natural variability alone?, or did other factors (aerosols) play a role too? "Is it reasonable to take the increasing global sea level over the last decade as confirmation that there has been no slowdown in increasing total energy content? That's a very good question, but again, it's not so simple. If, for example, ice melt from ice caps and glaciers accelerate (it has), then that can become the dominant contributor to sea level rise, and mask the slowdown in OHC. And yes, I have an upcoming post on closing the sea level budget too. You might want to take a look at Ari Jokimaki's SkS post: Deep ocean warming solves the sea level puzzle
    0 0
  11. Dave123 @ 5 - see the hiatus decades in the observational record of OHC highlighted in figure 1 - that's not a model output. I have another post on Meehl (2011), detailing the mechanisms at work in the model runs. Looking at the ocean in horizontal layers, misses the important changes taking place in the vertical plane. It'll be clearer in the post - there's a few graphics from the study detailing this. Utahn @ 8 - there are a number of references throughout the post pointing out it is a model-based study. Good point about linking to related SkS posts - forgot to do that.
    0 0
  12. Rob@11- I understand that the OHC hiatus isn't a model. It's the cause I'm interested in. Look, "we" assert that modeling is useful because it is based on physics (and chemistry) and not statistics. Models I built never had to detail fluid mechanics as part of the mass transfer- we had uniform turbulent flow at all scaleings. Ocean flows are largely laminar- low Reynolds number except at coast-lines where waves are turbulent. From a naive point of view a layered ocean might stay that way, the surface becoming hotter, increasingly less dense and therefor more stable on top of a denser colder base. No mixing invited. You can see that I think in certain really saline ponds with fresh water overlays. But less dense doesn't quite work that way- as the surface becomes less dense, that relieves pressure on lower layers and they can well up. Thus a top bottom current loop can be established. Do I undertand correctly that the millenial exchange between deep ocean and surface water is based on that mechanism? Now are we talking about accelerating the global currents? Regional acceleration? New currents developing? Or is there another mechanism that I'm unaware of? Do Hurricanes cause turnover? Dan@7- thanks for sharing that! Some of the circulation patterns reminded me of Jupiter. Rob@11- Re TOA- when this question came up I thought that TOA energy balance was a direct satellite measurement. So I went looking for verification and couldn't validate that notion. It seems that the TOA number is an argument between satellite data and other measurements. I probably missed something. There are some annoying consequences to this... but I'll hope you'll show me the error of my background studies before I bring them up.
    0 0
  13. Rob, really interesting article, the vertical mixing is the factor we don't understand well, at the moment NOAA has years worth of full water column sonar data, which can help allow us to visualise the deep sea currents and layers, problem is it's man-hour and computationally intensive to work through this, effectively 3-D high resolution data. Daniel Bailey at 13:12 PM on 2 October, 2011 Beautiful. Thanks for pointing us to this.
    0 0
    Response:

    [DB] An interesting Science Daily article on meso-scale eddy processes here.  A PDF of the study forming the source of the article is located here.

  14. The link to SKS post 'Ocean Heat Content And The Importance Of The Deep Ocean' in the article brings up a 404 error when I click it. I have been curious about our lack of knowledge re vertical mixing. Would this not have a bearing on the response time of the oceans to atmospheric warming? Why are we so confident that the oceanic lag to equilibrium sensitivity is 30 - 40 years? Do we somehow have a grasp on mixing rates despite knowing little about the actual mechanics? Having learned that the global average temperature at the surface of the oceans is warmer than the average temperature of the near-surface atmosphere, and knowing about the thermocline, it is a puzzle as to how the atmosphere warms the oceans and not the other way around, or what it means that a warming atmosphere is till cooler than the surface of the oceans. My guess is that the averaged temperature difference is sort of a constant, and that if one strata warms or cools, then so does the other, with waves, wind and currents, and response to diurnal and seasonal changes mixing things up at the boundary. But I've found no explanation for this line of enquiry on my travels. Scant knowledge on the actual mechanisms drawing heat energy into the deeps makes it a tough nut to crack for this layman. I've found plenty of material on horizontal heat transport across the oceans, but little on the physical details of vertical mixing. Any suggestions greatly appreciated.
    0 0
  15. @Peter Hogarth "..problem is it's man-hour and computationally intensive to work through this.." Maybe you could use volunteer computing to help you with that. Ref: http://boinc.berkeley.edu/.
    0 0
  16. Thanks for the reply and references Rob. I thought I remembered reading from one of Hansen's papers that the TOA radiative balance can't be measured directly with sufficient accuracy, and therefore had to be inferred from other metrics, mainly OHC... which would make Meehl 2011 something of a circular argument, if you see what I mean. I'll read the Trenberth et al paper and see if things become clearer :-)
    0 0
  17. Rob, most explanations for the global downturns in SST and I guess upper layer OHC relate to the SO2 aerosols from major eruptions. Here I've averaged the optical thickness data over the tropics, which I have assumed is where most of the solar input to the Oceans happens. Interestingly this seemed to enhance the effect of Agung relative to Pinatubo, at least using this data set. The red line is a "last five year" average of OHC. I think it is possible that the recent short term surface layer hiatus may tie in with continuing deeper warming. A ten year average of upper level OHC shows no recent hiatus or significant trend change whatsoever, and this is the kind of long term integration pattern we might expect lower layers to follow if they warmed through vertical diffusion alone.
    0 0
  18. RobP #10: The mid-century surface temperature 'hiatus' was explained quite fully here. There's no question of the statistical significance of that hiatus. But the 'hiatus' decade of 2000-2009 was addressed in your prior 'why wasn't hottest decade hotter' and the best conclusion there was sulphate aerosols muting the ongoing increase in CO2 radiative forcing. I am not questioning the Meehl model results, nor the idea that stored ocean heat will indeed come back to bite us - it may already be doing that in 2011. My concern is two-fold: a. Based on graphs like this, I don't see how 2000-2009 qualifies as a hiatus on the scale of 1950-1975. b. We've agreed that 10 years does not a significant trend make. As a result, I fear these decadal studies confuse the issue. Certainly, it takes some scrutiny to reconcile the model graphs in your figure 2 with its inset - they do not graph the same things and thus using an inset format is misleading. And statements like: the general pattern of warming and ocean circulation in the model, during these hiatus periods, is very similar to that which occurs over shorter timeframes in the La Niña phase of ENSO will touch another round of its el Nino!.
    0 0
  19. Dave 123 @ 12 - see figure 4 in the post. The hot-coloured oceanic regions at mid-latitudes are where heat is converging in the surface layers and being driven down into the deep ocean. The upwelling component in equatorial regions brings deeper water to the surface to be warmed by sunlight - which is why this La Nina-like hiatus period is a time of greater-than-average ocean warming. This is the natural variability of the climate system, which is superimposed on a long-term warming trend. I'm writing a companion piece (all but done), because another SkS author pointed out the mechanism was as clear as mud. Barry @ 14 - hyper-link fixed, thanks. I've already written a piece on how the oceans are warmed by greenhouse gases. It's scheduled for the end of the week. I will cover a few more ocean-related topics in the next 2 weeks - so hopefully this will all be a little bit clearer. Icarus @ 16 - TOA & OHC is the subject of an upcoming post. Pete Hogarth @17 - There are a few interesting papers on volcanic eruptions and the oceanic response, but I have to run now - will dig them out and link to them later. Muon @ 18 - La Nina, El Nino - yeah, there's an interesting emerging idea about how ENSO fits into all of this. Yup, subject of upcoming posts too!
    0 0
  20. Both this and the potential role of aerosol output coming from China, as competing theories which could certainly also be operating simultaneously, are troubling for long-term trends for the future. Whenever they cease to operate in the direction observed recently, warming will likely see an unpleasant positive adjustment period. I'm weary of where the next ten years go.
    0 0
  21. There are obviously many phenomena that can affect decadal temperature swings. Thanks for presenting one of them - and for comments mentioning others. One further possibility, the atmospheric (well on ground also) nuclear tests throwing stuff up on the stratosphere that were banned in 1963. If this was the sole reason for hiatus that would give a residence time of about 15 years for this exotic effect of nuclear arms.
    0 0
  22. Peter Hogarth @ 17 - here's those papers on volcanic eruptions: - The climatic effects of the direct injection of water vapour into the stratosphere by large volcanic eruptions - Joshi & Jones (2009) - Krakatoa lives: The effect of volcanic eruptions on ocean heat content and thermal expansion - Gleckler (2006) - Observational evidence for volcanic impact on sea level and the global water cycle - Grinsted (2007)
    0 0
  23. I'm going to query that claim about a slow-down in the rate of warming. I have data from both GISS & UAH that show warming for 2000-2010 being *faster* (around +0.015 & +0.017 degrees per year respectively) than the period of 1979-2000 (+0.012 & +0.009 degrees per year respectively). Now sure 10 years of data isn't statistically significant, but that's all the more reason to deride any claims of a "slow-down" in temperatures.
    0 0
  24. [snipped] There are few actual reliable in situ observations especially in the critical near-surface layers. Vecchi et al. (2008) suggested anomalies between HadCru and NOAA SST mid-twentieth century data-sets were due to change in measurement methods from buckets to seawater intake to satellite. (Vecchi, G. A., A. Clement, and B. J. Soden (2008), Examining the tropical Pacific’s response to global warming, EOS, 89(9), 81, 83.) A similar report appeared about the same time in Nature: Thompson, D. W., J. J. Kennedy, J. M. Wallace, and P. D. Jones, (2008), A large discontinuity in the mid-twentieth century in observed global-mean surface temperature, Nature, 453, 646-649 Seawater intake temperatures were substituted for bucket measurements particularly on US ships during WWII to minimise potential for enemy action during measurements especially at night. A statistical analysis of WMO data suggested a possible error was due to engine room warming of the intake waters. This is included in textbooks as a given (eg Emery & Thomson (2001), but there is no proof and the physics is conclusively negative. (Emery, W. J., and R. E. Thomson, (2001) Data analysis methods in physical oceanography, Elsevier, ISBN 044450757566, 638pp) Indeed a US ONR report suggested engine room warming was extremely unlikely. My calculations suggest that engine room warming of incoming seawater even at air temperatures of 50oC is negligible using realistic flow rates, pipe size and length. Certainly the 0.3oC correction applied is physically unlikely and in the wrong direction. Moreover, there is very strong evidence of substantial temperature gradients in the near surface layers. A temperature gradient of minus 0.1oC/meter has been measured in all oceans with substantially larger or smaller variations depending on the ocean and season. (Federov, K. N., and A. G. Ostrovskii (1986), Climatically Significant Physical Parameters of the Ocean, IOC Time series of ocean measurements Vol. 3 – 1986 IOC Tech. Ser. 31, UNESCO, 9-31.) Soloviev, A V., R Lukas,(1997) Large diurnal warming events in the near-surface layer of the western equatorial Pacific Warm pool Deep Sea Res., 1055-1076 Near Surface dynamics are extensively discussed in the Soloviev and Lukas 2006 book that has recently been issued in paperback The near-surface layer of the ocean By Alexander Soloviev, Roger Lukas Springer 2006 - 572 pages Much of the HadCru ocean data are taken from the Voluntary Observing Ship (VOS) program of WMO. Seawater intake temperature was routinely measured as sea surface temperature. Corrections were routinely applied to obtain ‘corrected’ surface temperatures. There is great doubt as to what the relationship of the seawater intake temperatures so derived is to the actual surface or skin temperature given the certain knowledge of substantial temperature and salinity gradients throughout the oceans. The problem is particularly severe from 1955-1995 because there is no record of seawater intake depth on the VOS fleet for that period. The problem, I believe, is further complicated by the substitution of supposed sea surface temperature (SST) for marine air temperature (MAT) in model data. Standard 10m wind data and Stevenson Screen temperature data are used over land. But over water surface wind and SST are used. If the temperature in question is from some unknown depth and correlation to MAT is poor, we are likely to have [snipped] We now have accurate skin temperature and salinity measurements using infrared satellite data. But there is still little data in the upper 10m – 50m of the oceans. Argo floats switch off near the surface and in any case only operate in deep waters. There are huge changes occurring with coastal run-off and ice melt that affect coastal regions and have impact on ocean heat, vertical circulation as well as acidification as detailed in other SkS posts. It is pretty clear that models are not working eg the unexpected rapid arctic ice melt. It is only a year since everyone was predicting that the ice was actually increasing in area. It was only with the discovery, by getting out and looking, that the ice was mostly single year rotten ice, not largely composed of dense thick multi-year ice that the true decline was established as fact. Satellites just did not give those kind of details. So this is a plea for detailed near-surface ocean data especially in near-shore regions where the most rapid change will occur. Until we have better observational data in the near-surface and numerical models that incorporate the full range of air-sea interaction, we should not place a lot of faith in model-based suggestions let alone treat them as forecasts or predictions.
    0 0
  25. Thank you Micawber for that very insightful post. I express similar feelings about data vs. modelling, and look forward to future posts. I would add the recent Kirtman and Vecchi paper "Why Climate Modeler Should Worry About Atmospheric and Oceanic Weather" to your list.
    0 0
  26. Jonathon 25 Thanks for the comments.Could you supply a link to the Kirtman & Vecchi paper please.
    0 0
    Moderator Response: [grypo] Here you go.
  27. Micawber, The issues with sea temperatures that you point out are well known. The scientists involved try to adjust the data to correct the problems. Are you suggesting that we should wait until "someone" decides to fund much improved ocean sampling before we attempt to model anything? How long should we wait? It seems to me that it is better to go with the data you have and then see how your models fit current observed data. Dr. Pielke suggested we should use ocean heat content as the primary measure of AGW, he did not seem concerned about past data problems. The deep ocean has only been lightly sampled in the past. Even today deep ocean data is sparse. If we want to anticipate the future changes we must rely on models to fill in the holes. You make your model with the best data you can. If better data becomes available later you adjust your model to take that into account. That is how scientists do their work. Suggesting we should wait for perfect data is suggesting we should do nothing. The model results are interpreted with the data limitations in mind.
    0 0
  28. Gavin Schmidt posted "Global warming and ocean heat content" over at Real Climate today (Oct 3 US).
    0 0
  29. Rob Painting at 19:08 PM on 3 October, 2011 Thanks, Water Vapour parts interesting, here's a couple of nice papers if you haven't seen them: Harris 2010 quantifies the amount of surface temperature drop from volcanic SO2 (modeling) and Smith 2010 on new global anthropogenic SO2 inventory and historical time series of anthropogenic SO2, this and similar work makes me suspect this probably isn't the culprit for any very recent effects. Micawber at 23:05 PM on 3 October, 2011 I have no argument with getting more real measurements (I design sensors) but the modelling skill has improved substantially even since the papers you cite. Not the time or the post to pursue here though!
    0 0
  30. Micawber @ 24 -"But there is still little data in the upper 10m – 50m of the oceans." I have no idea what you're talking about here, but the surface exchange of heat in the top 500 mtrs of ocean is the subject of an upcoming post. Peter Hogarth @ 29 - thanks. I've read Smith (2010), but not Harris (2011). Cheers.
    0 0
  31. Michael Sweet@27 “The issues with sea temperatures that you point out are well known. The scientists involved try to adjust the data to correct the problems. Are you suggesting that we should wait until "someone" decides to fund much improved ocean sampling before we attempt to model anything?” What first alarmed me was the graphic at the beginning of the post. “Ocean Heat Content 1955 – 2008”. From 1955-1995 WMO VOS obtained surface seawater temperature (SST) by methods which changed from hand sampled buckets to seawater engine intake temperatures to satellite IR. Method changes occurred at different times for ships of different nations. I believe UK ships used bucket methods longest and even designed their own meteorological bucket. Corrections were made, the most drastic of which were during the two transition periods. Original raw observation data are not always available to go back and look at. As far as I can research, there have been no published scientific studies of either bucket or seawater intake corrections and their proven validity. That applies to corrections for supposed, but not proven, evaporative cooling of buckets on deck and engine room warming of intake seawater. As I originally pointed out, the physics for the latter is wrong. If heat flowed from a hot room into room radiators/convectors we would use them for central cooling not central heating. Seawater intake piping is generally not a good heat absorber being short, cylindrical metal pipes with fast flowing water. Moreover since seawater intake temperatures were measured at an unknown depth and, like bucket temperatures, were made by un-paid, unsupervised, non scientists with uncalibrated instruments, I am very skeptical of the validity of that data for the period 1955-1995. I spoken to people who were volunteers on merchant ships who confirmed that methods were very sloppy because they got no feedback. I am a physicist with experience in meteorology and oceanography and in instrument design, deployment at sea, data analysis and modelling so I am well aware of both the need for models to run with Navier-Stokes equations correctly accounting for the physics and with the most reliable input data. If you know SST corrections applied in the critical period and have examined the raw data together with the depth of the samples, then I would be very glad to see it. The published data rely on statistics rather than examining actual raw data in detail. Until the raw data and corrections applied become available I remain skeptical of data for the period. Data were derived by climatologists for use in climate models. The last seagoing meteorologist I could find in the literature conducted bucket measurements in 1926. Oceanographic data by seagoing oceanographers were taken in the deep sea and did not sample the near-surface layer as I stated (even along Line P). I am aware there are attempts to build surface sampling Argo floats but that only addresses part of the problem. Has there been any follow-up to the extensive Soviet near-surface work on gradients I cited? In short, your graph 1955-2008, can only be considered in the period 1995-2008 when satellite, ship, buoy and float data became available. I personally do not consider the periods before then to be valid until I see proof of the input data. So the answer to your questions is Yes, use only the most reliable data for models and that comes after 1995 not before. Rob Painting@30. I am sorry you do not understand my comment on the upper 50m. I understand that STD casts take at 3m and 10m sample depth at best and current generation Argo floats switch off near the surface to avoid contaminating sensors. Vertical exchange near the surface due to diurnal and seasonal heating and cooling are an interesting and important component of ocean heat budget. I eagerly await your post on the surface layer exchange.
    0 0
  32. Micawber @31, ocean heat content measurements and SST measurements are not the same thing. Therefore your issue about buckets and intakes is a non-issue with regard to ocean heat content. Further, there have been frequent studies of the influence on various measurement techniques on the SST record, including: Jones and Briffa, 1992 Parker et al, 1995 Folland and Parker, 1995 Casey et al, 1999 Rayner et al, 2003 Rayner et al, 2006 Thompson et al, 2008 and Casey et al, 2010
    0 0
  33. Micawbr, I'm sorry but you are saying an awful lot without really saying anything substantive, and are not raising issues that have not already been dealt with in the literature. I encourage you to read Lau and Weng (1999), AchutaRao et al. (2007), Lyman and Johnson (2008), Domingues et al. (2008), Levitus et al. (2009), or DelSole et al. (2011). These papers deal with the sampling and instrument issues, and they all note that decadal variability is evident in the ocean SSTs and OHC. What scientists are now interesting in determining is what exactly is happening during hiatus periods, and models are a very useful tools for such experiments/investigations. "I personally do not consider the periods before [1995] then to be valid until I see proof of the input data." That is your opinion and not that of the scientists who work in the field. As for the reliability of the early OHC data, Lyman and Johnson (2008) conclude: "From 1955 to 1966, in situ ocean sampling is inadequate to estimate accurately annual global integrals of the proxy upper OHCA. During this period, the SI for the sampling pattern of any given year underestimates the 13-yr trend in proxy OHCA from 1993 to 2006 by around 70%, and confidence limits for the WI are often very large. From 1967 to 2003 there appear to be sufficient data to estimate annual global integrals. " So we can perhaps agree that one should be looking at data since ~1967 and not 1955. The hiatus periods identified by Rob Painting include that interval of what is deemed to include reliable data. More information on the various OHC chronologies can be found here But if you wish to insist that the data are not reliable prior to 1993, then also consider Willis et al. (2004) and Lyman et al. (2010). Both these papers show robust warming of the oceans between 1993 and 2003 and between 1993 and 2008, respectively. You claim "Argo floats switch off near the surface and in any case only operate in deep waters". That is not an accurate description. There are two standard mission operations: "In the simple mission, the float descends to a certain depth, often 2000m, and then begins its temperature and salinity profile from that depth. In the park and profile mission, the float descends to a certain depth, 1000m is recommended, and then descends to 2000m to start the temperature and salinity profile. In the beginning of 2010, 70% of floats profile to depths greater than 1500m. Another 20% profile to between 1000 and 1500m."
    0 0
  34. Tom @32, We cross posted. You of course make a very valid point about oceanic heat content and sea surface temperatures. Someone seems to be intent on arguing strawmen.
    0 0
  35. Tom Curtis@32 I am very familiar with the papers you mention. Are you saying their data is based on scientifically acquired in situ measurements from calibrated instruments by fully qualified scientists? VOS data certainly is not. You need to put error bars on the SST data. Models are tuned with [ -snipped-] (OK call it diffusion factors) to fit the dataset so it can then be used for prognostication. If you input data with wide error bars then of course your model will struggle to adjust. I use SST in full knowledge that it used as the temperature of a supposedly well-mixed surface layer. There is no evidence of this well-mixed layer. Indeed, on the contrary, there is evidence, cited by me, of strong near-surface gradients in all the world oceans. Is this in dispute? If it is not well-mixed and there are substantial gradients and you took your sample from an unknown depth, just what is the heat content of the supposed well-mixed layer that isn't? Do you believe ocean surface layers are well mixed? Do you not believe the in situ evidence of temperature and salinity gradients in mid ocean? Do you have any in situ data on the correlation of Marine Air Temperature and actual SST? These are not strawmen. The papers you cite are all based on statistical data with no raw data available to check for corrections and are without error bars. I have looked at this in depth and this is real data-based skepticism. If the models based on this errorful ocean data were reliable, the predictions of warming would not consistently come out too low! The models are not working because they have been tuned to an error-prone oceanic dataset. Skeptics have trawled over the land data and there are no really serious problems with it (Climategate etc). This simply has not been done for the ocean data. I hope I'm wrong. If you know of detailed studies that have checked out bucket temperatures versus seawater intake versus satellite data and continuous data on salinity and temperature profiles from the surface down to 50m or 100m in all the oceans, I'd love to see them. I am a data-based scientist. Show me the evidence. Please do not quote evidence from models based on un-ground-truthed datasets with unknown error bars. Ocean heat from 1995 onwards shows a strong upward trend. Datasets for this period are more and more detailed and extensive though not in the near-surface layers. I believe if you tuned your full coupled ocean-atmosphere models for 1995-2008 period you would get more reliable results. We always need more ground truth. I know it is expensive. However, no amount of tuning models will substitute for detail accurate data from the oceans with known error ranges. Near surface dynamics are not trivial and require a detailed understanding of the dynamics from actual measurements. All the latest ground truth data from the oceans suggests they hold much more heat than the models suggest. Surely that is reason enough to check the original data for its validity?
    0 0
  36. Albatross@32 "But if you wish to insist that the data are not reliable prior to 1993, then also consider Willis et al. (2004) and Lyman et al. (2010). Both these papers show robust warming of the oceans between 1993 and 2003 and between 1993 and 2008, respectively" Yes I agree completely. The oceans certainly do show robust warming. Thank you for the comments.
    0 0
  37. Micawber at 01:13 AM on 6 October, 2011 I don’t dispute significantly varying surface layer temperatures and profiles, (I’m not sure anyone is) so I hope we’re not at cross purposes here. However the diurnal etc variations are certainly accounted for in SST. I fear there may be confusion between SST measurements and OHC measurements (from profiles). SST: One of the best most recent papers on SST bias corrections is Kennedy 2011. For Marine Air Temperatures being used to correct bias in SST, see for example Smith 2001, For OHC, (forget intakes and buckets), latest paper on XBT corrections back to late 1960s is Hamon 2011. On upper layer OHC, for early 20th century temperature profiles were mainly recorded using pressure-protected reversing thermometers (used since late 19th century), by the 1950s these were accurate to around 0.02°C, and there were thousands of profiles taken globally, (starting to get something approaching sparse “global” coverage but not with fine depth resolution) we also had MBTs and then STDs and CTD probes as you know, see Ishi 2003. Another approach when looking at atmosphere/ocean interactions is to look at proxies such as the depth of the mixed layer Lorbacher 2005, which I imagine you'll find interesting. Hope these are useful. A lot of the detail on sensors is in your Emery and Thompson, I believe.
    0 0
  38. Micawber @35, Peter Hogarth @37 has stolen most of my thunder, so I recommend you read his comment carefully. Again, it is vitally important that you distinguish between Sea Surface Temperatures, to which comments about buckets and intakes are relevant, and Ocean Heat Content, to which they are not. The former is of topic in this thread, while the later is not. There are measurement issues with both, but they are not the same issues. With regard to OHC, I have nothing useful to add to that which Peter (and Albatross) have already provided. With regard to SST, I recommend you read the review article by Kawai and Wada, 2007. Of particular interest to you would be table 1 which indicates the sub-layer normally measured by different instrument types. Kawai and Wada conclude with a discussion of the implications of diurnal and seasonal differences in temperatures between SS sub-layers on modelling and on observational data. In addition to Kawai and Wada, you may wish to refer to Science of Doom's discussion of SS sub-layers, if for no other reason than the list of relevant papers he provides. Having been through those papers, perhaps you would then like to raise these issues on a relevant topic. In the meantime I will simply note that your concerns that these issues are not being addressed by detailed observations by scientists is misplaced.
    0 0
  39. Micawber @ 31- "What first alarmed me was the graphic at the beginning of the post. “Ocean Heat Content 1955 – 2008” Enough of the emotive content thanks. Try to restrict yourself to discussion of the topic at hand. Peppering otherwise reasonable-ish posts, with allegations of scientific misconduct and other snark, is akin to a waiter spitting a big goober into a diner's well-prepared meal - it's extremely bad manners, and will ensure deletion in the future. And please note that ship-based water intakes and buckets have absolutely nothing to do with measurements of ocean heat down to 700 metres - as Tom Curtis has already pointed out.
    0 0
  40. Rob, I'm reposting a query I put it RC here as you may not have seen there. I'm just trying to make sure I understand the thought behind periods of greater warming occurring roughly equally often to periods of "deep ocean heat burial." If you or anyone else could comment as to whether this is close to what people are thinking I'd appreciate it. "At times, more heat than previously expected is buried in the deep ocean. This heat will not return literally to the surface, but periods of greater “shallow” ocean heating will be expected, because sometimes, much less of the heat is transported deeply (due to the natural variability in whatever mechanism is driving heat deeper than expected some of the time). Relatedly, since we have some expectation that this deep ocean heat transfer has always been occurring, and since our climate models have a decent handle on the sensitivity of the climate, past and present, one might expect the ebbs and flows of deep heating to even out to the expected trend based on knowledge of climate sensitivity. How’s that for a run-on sentence? Does this (esp the first part) represent correctly what you mean?"
    0 0
  41. Utahn - once heat is buried into the very deep ocean it stays there for hundreds to thousands of years, before it can be recycled back to the surface. Think of those orange-coloured ocean areas in figure 4 acting as funnels taking heat down to the deep. Once the heat is way down deep, it isn't coming back out anytime soon. Meehl (2011) suggest that natural variability, which affects the ocean surface layers especially, is what causes the hiatus periods. During the La Nina-like phase (or negative Interdecadal Pacific Oscillation) more cool water upwells to the surface (particularly in the tropical Eastern Pacific), and because the ocean surface is so large and responsible for much of the heating of the atmosphere, this cools the surface temperature on a global scale. At the same time, because the ocean is heated by sunlight and, due to the funneling of heat down to the depths in those mid-latitude regions, the oceans as a whole accumulate heat during these La Nina-like hiatus phases. Although Meehl (2011) doesn't dwell on the opposing phase of this natural cycle, figure 2 shows that they are times of sharp rises in global surface temperature - which suggests a more El Nino-like response from the ocean. Just for clarification: during El Nino the upwelling of cold water in the tropical Eastern Pacific shuts off and the surface layers warm. It's this shuffling of heat between the surface and subsurface ocean layers (in the top 500 metres of ocean) which directly affects global surface temperatures, not heat from the deep ocean. As for OHC and climate sensitivity, that's a discussion for another day. I'll get around to that. In the meantime, I hope this is all a little bit clearer. We'll have to wait and see if the climate modeling-based mechanism in this paper is supported by the observations.
    0 0
  42. Thanks Rob, that's pretty much what I was thinking you were saying, my expression of it may be lacking though. It will be very interesting to see how our understanding evolves of how these moderately shallow to deep shifts might occur. Thanks for your great work in these posts!
    0 0
  43. Hansen, in Earth's Energy Imbalance, says he believes the GISS climate model ER, and "most climate models" "mix heat too efficiently into the deep ocean". One piece of his evidence is that the GISS model indicates Earth should be out of energy balance right now by about 1 W/m2, whereas the observations of ocean heat content contradict this. Hansen cites Argo data analysed by von Schuckmann that indicates to him that the actual number for Earth's energy imbalance now is about 0.6 W/m2 which he believes will eventually prove to be 0.75 W/m2 if the solar minimum is averaged out. He argues that if he assumes a model that puts less heat into the ocean it will correspond with observed reality expressed in the global average surface temperature chart as well as current models do, if its climate response time is assumed to be quicker which implies that aerosol forcing is actually -1.6 W/m2 or so. He cites personal communication with Romanou and Marshall (paper in progress) who apparently have found that CFC molecules they were tracing did not move into the deep Southern ocean as quickly as models indicate they should. He's working with several other scientists on improving the way the GISS model handles the ocean although he says work along that line has been ongoing for a long time. That increased negative aerosol forcing he says "is inferred" alarms him enough to put "continued failure to quantify the specific origins of this large forcing is untenable" in his abstract. It means more than half of the power of the GHG in the atmosphere already has been masked by aerosols, a larger figure for the "Faustian bargain" he's been talking about for some time, than he's said he's got solid evidence for before. He points to a decline in total GHG growth rate since the peak rates of the 1980s which is due to the Montreal Protocol limits on CFCs, the solar minimum, and residual effects of Mt Pinatubo as explanations for why the warmest decade wasn't warmer. It appears to me Hansen is contradicting Trenberth et al with this. I.e. Meehl (2011) is a modelling study, whereas Hansen is asserting that taking a model result that says something like Trenberth's missing energy is being sent into the ocean is likely wrong, if he is right that the models send too much heat into the ocean in a systematic error. He says his assumed model that has the quicker climate response gives a calculated energy imbalance in line with observations hence there is likely no missing energy. Do you have any thoughts. I'm poring over Hansen's paper trying to understand what he's saying.
    0 0
  44. David, Hansen and Trenberth have different explainations for the source of the "missing heat". Hansen posits that the heat has been reflected into space by aerosols and Trenberth that it is in the deep oceans. They will resolve this issue as scientists do: they are collecting data to see who is right. Several papers have come out supporting each side, so it is too early for the rest of us to tell who will be correct. In the end both may be right for part of the energy. It takes years (or decades) for scientists to collect data like this so do not expect the issue to be resolved tomorrow. Both agree that no matter which explaination is correct it means we need to do more to reduce AGW.
    0 0
  45. Michael, Your last statement is obvious. Whether the "missing heat" has been radiated back to space or is being stored in the deep oceans has major implications. In the former, there is no buildup of heat, but in the latter, heat is being stored in the ocean which will eventually migrate to the surface. The difference is huge for future temperature changes. Of course, it could be a combination of the two, or other explanations could play a larger role.
    0 0
  46. I would hope that everyone understands that scientists often find they disagree on how to interpret data and that their disagreements are often resolved over time. I described what I understood of Hansen's ideas in order to ask if it appears to others that Hansen's idea that most models respond to forcing too slowly because they send too much heat into the deep ocean contradicts this NCAR research. Gavin Schmidt at RealClimate (in his reply to comment #3 under his post Global Warming and Ocean Heat Content) appears to have answered a question similar to mine by saying there is no contradiction. Here is the question posed at RealClimate: "[regarding “Earth’s Energy Imbalance and Implications”] In that paper, especially in sections 6 & 7, it appears – to me anyway – that James Hansen and his colleagues have given up on the search for the so-called “missing heat” in the deep ocean and have instead concluded it must have been radiated away as a result of the negative anthropogenic aerosol forcing. I take this as suggesting that Hansen has parted company with Kevin Trenberth and others and has conceded that the IPCC models are flawed – flawed in their “climate response functions”. Do you know if the model used by Meehl suffers the same problem with the “climate response function” that Hansen discusses? Do you have any other comments on the Hansen et al. paper?" [Response by Gavin Schmidt]: I don't see any contradiction. Meehl et al are looking at a generic behaviour which will exist in all models, while Hansen is thinking about the specific forcings and response for the last decade. Different issues. - gavin Yet in Earth's Energy Imbalance and Implications Hansen republished Trenberth's "Global Net Energy Budget" diagram from Trenberth's "Perspectives" piece, which was originally published in Science, i.e. this one And Hansen says this about it: "the slowdown of ocean heat uptake, together with satellite radiation budget observations, led to a perception that Earth's energy budget is not closed (Trenberth 2009, Trenberth and Fasullo 2010), as summarized in Fig. 19A. However, our calculated energy imbalance is consistent with observations (Fig 19b), implying there is no missing energy in recent years." Which sounds like he is making sure everyone knows he is contradicting Trenberth and the NCAR research as described in this "The Deep Ocean Warms when Global Surface Temperatures Stall" Skeptical Science post. When describing the NCAR work it seems there must at least be a mention that a scientific group with the stature of Jim Hansen's appears to completely disagree. Or, is Gavin Schmidt correct that Hansen is not contradicting NCAR? Or, is it the case that Hansen is losing scientific credibility in the minds of the writers here at Skeptical Science?
    0 0
  47. David @46, "Or, is Gavin Schmidt correct that Hansen is not contradicting NCAR? Or, is it the case that Hansen is losing scientific credibility in the minds of the writers here at Skeptical Science?" Please, enough with the "gotchas" and strawmen and "wedge" politics already. Hansen is not losing scientific credibility here at SkS or anywhere else just because he has a different hypothesis than does Trenberth. The slowdown between 2003 and 2010 depends on the depth used in the OHC data and which data analysis one uses-- for example, the Palmer et al. analysis shows an accumulation of heat consistent with the trend for 1993-2008. But that rate is not supported by the isostatic contribution to sea level, so it appears that there has been a temporary slowdown. Hansen et al. (2011) find an energy imbalance of ~0.6 W m-2 for 2005-2010, compared to ~0.8 Wm-2 for 1993-2008. Regardless, the slowdown in the accumulation of heat in the 0-700 m layer is in all likelihood a combination of three factors: 1) Interdecadal variability in ocean heat content, 2) Increased aerosol loading, and 3) Prolonged solar minimum. I would not be optimistic as to what changes in such a short time window mean in terms of climate sensitivity or model skill if I were you.
    0 0
  48. David Lewis @46: 1) Gavin Schmidt claimed that there was no contradiction between Meehl et al, 2011 and Hansen. He did not claim that there was no contradiction between Hansen and Trenberth. Essentially the difference is this: Meehl et al find a mechanism that can result in more rapid removal of heat to the deep ocean under some circumstances. Nothing Hansen says implies that such a mechanism cannot exist. However, Hansen does claim that even should such a mechanism exist, it is not responsible for the reduced growth of upper level OHC over the last few years. Trenberth, on the other hand, is committed to such a mechanism being responsible for that hiatus. 2) I suspect that most members of the skeptical science team, like myself, do not consider Hansen a guru whose every pronouncement must be believed. He, like Trenberth, is a working scientist of considerable accomplishment. Therefore, when he makes a scientific argument, it pays to listen. But he, like any other scientist, can be wrong and it is the evidence that decides whether he is or not. Consequently when, as in this case, he and Trenberth disagree we pay attention to both positions and the evidence in the expectation that that evidence will soon sort out who is wrong and who is right. As it happens I tend to think Trenberth is more likely to be right than Hansen on this issue. I think this primarily because models tend to over estimate the temperature effect of volcanoes, whereas if they had been overestimating heat transfer to the ocean (and hence thermal lag), they would be more likely to underestimate it. However, that is only a small piece of evidence in a complicated issue, so like everybody else, I'm going to have to wait and see. What I am not going to do is assume that, if Hansen is wrong, that makes all his other opinions wrong as well. Those other opinions where accepted based on evidence, and it is that evidence which supports them, not some false supposition of infallibility.
    0 0
  49. Maybe after a while people might understand if I ask a question I'm not playing some game. I have been involved in debate as a climate activist and would be politician since 1988. I staked the success of my political career on whether voters would vote for stabilizing the composition of the atmosphere, starting in 1988 in Canada. Obviously, I was unsuccessful. I thought everyone in this civilization should be alarmed at what climate scientists were discovering, as of back then. I posted my question about whether Schmidt thinks Hansen is contradicting NCAR to Gavin Schmidt at RealClimate. I was unable to understand his brief response to a question I thought was similar to one I might ask. I don't understand the difference between Meehl and Trenberth - the Meehl paper abstract indicates they think the Earth's energy imbalance is around 1 W/m2 and they are looking for ways to explain why what they call the "observed globally averaged surface-temperature time series", "shows little increase or even a slightly negative trend". This appears identical to Trenberth's thought, i.e. where is the missing energy. So when Hansen says he thinks the Earth's energy imbalance if the solar cycle is removed is 0.75 W/m2, and he puts a paragraph into his paper saying "there is no missing energy", it seems to me he's staking out a somewhat contradictory position to Meehl. The NCAR group is looking for ways to explain where all this 1 W/m2 is and they are using models to do it. Hansen is saying there is only 0.75 W/m2 to explain, and models aren't going to be able to explain where even 0.75 W/m2 is as all current models happen to assume things that are incorrect about ocean heat storage and aerosols. I don't say Hansen is right. I happen to be studying his ideas right now and wondered why in a discussion of the NCAR work Hansen's name didn't come up. So I brought it up. I tend to think we're all just on the bridge of the Titanic after it has hit the iceberg exchanging views, although I believe there is a lot that could be done if civilization woke up to the situation. I study current climate science with a view to increasing my understanding so that as I discuss the topic anywhere I can be more clear. I'm sorry if I antagonize people with my questions.
    0 0
    Response:

    [DB] "I don't understand the difference between Meehl and Trenberth"

    Remember, Trenberth is also an author of Meehl (2011).  Trenberth's famous "missing energy" statement is worded as follows:

    "The fact is that we can't account for the lack of warming at the moment and it is a travesty that we can't."

    In regards to this statement, Dr. Trenberth is on record asstating:

    "It is quite clear from the paper that I was not questioning the link between anthropogenic greenhouse gas emissions and warming, or even suggesting that recent temperatures are unusual in the context of short-term natural variability."

    Thus Dr. Trenberth laments the lack of measurement tools to close the accounting gap - nothing more.  How do I know this?  From the link...and he told me as such (personal correspondence).

    My takeaway from Meehl (2011) is that the team that Dr. Trenberth was a part of has identified a mechanism through which deep ocean energy sequestration occurs on decadal timescales.  And by adding that into the accounting mix we can better close the budgetary gap in the planetary energy flows (as measured and modeled).

    That being said, the new mechanisms identified by Meehl (2011) do not preclude Dr. Hansen's new aerosol forcings from also playing a significant role in also closing the planetary energy budget.  Time will tell as to how big a player each is in this drama unfolding as we watch.

    This is how science works.  The difference is that formerly this all happened in meeting rooms and was hashed out over months and years of research, but now (in the information age) we see this played out in real-time.

    Have patience.

  50. David Lewis - I'm another SkS author who has the utmost respect for Dr Hansen and the work he has done to further scientific and public understanding of the climate, but that doesn't make him automatically right about all things climate. And just for your info, both Trenberth and Fasullo are co-authors of Meehl (2011) - hence the similarity. Who's right? Well, we'll have to wait and see, but there are a number of papers awaiting publication that look at this issue.
    0 0

1  2  Next

You need to be logged in to post a comment. Login via the left margin or if you're new, register here.


The Consensus Project Website

THE ESCALATOR

(free to republish)


© Copyright 2024 John Cook
Home | Translations | About Us | Privacy | Contact Us