Climate Science Glossary

Term Lookup

Enter a term in the search box to find its definition.

Settings

Use the controls in the far right panel to increase or decrease the number of terms automatically displayed (or to completely turn that feature off).

Term Lookup

Settings


All IPCC definitions taken from Climate Change 2007: The Physical Science Basis. Working Group I Contribution to the Fourth Assessment Report of the Intergovernmental Panel on Climate Change, Annex I, Glossary, pp. 941-954. Cambridge University Press.

Home Arguments Software Resources Comments The Consensus Project Translations About Support

Twitter Facebook YouTube Mastodon MeWe

RSS Posts RSS Comments Email Subscribe


Climate's changed before
It's the sun
It's not bad
There is no consensus
It's cooling
Models are unreliable
Temp record is unreliable
Animals and plants can adapt
It hasn't warmed since 1998
Antarctica is gaining ice
View All Arguments...


Username
Password
New? Register here
Forgot your password?

Latest Posts

Archives

The Earth continues to build up heat

Posted on 12 October 2011 by John Cook

New research has been published that finds the planet has continued to build up heat well into the 21st century. Church et al 2011 extends the analysis of Murphy 2009 which calculated the Earth's total heat content through to 2003. This new research combines measurements of ocean heat, land and atmosphere warming and ice melting to find that our climate system continued to accumulate heat through to 2008.

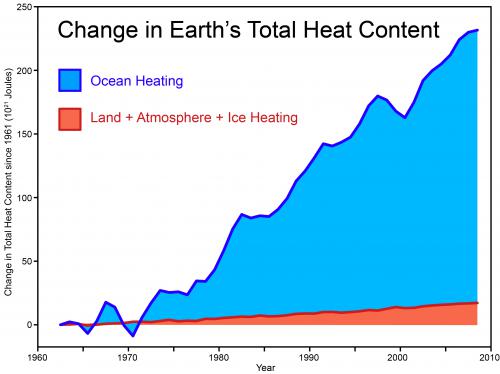
A high resolution version of the graph is available at the Climate Graphics resource. Many thanks to John Church and Neil White for generously sending me their total heat content data.

0 0

Printable Version  |  Link to this page

Comments

Comments 1 to 25:

  1. Church's et al paper is a nice summary of a number of hydrological/oceanographic parameters, and ones that toll a grim knell. Now that attention has been drawn to it on Skeptical Science, I expect that there will soon be a glut of denialist 'rebuttals' attempting to discredit the numbers...
    0 0
  2. “The Earth continues to build up heat [?]” Well, it is difficult not be skeptical (in this question) if you look for example at the figure and reads the comments: “The linear trend of the observations is approximately 7% of the trend projected by the model mean of the GISS Model-E.” In work Church et al., 2011. this sentence: “Ocean warming (90% of the total of the Earth's energy increase) continues through to the end of the record, in agreement with continued greenhouse gas forcing.” if we compare “it” whit a first sentence - comments above, it “receives” a slightly different meaning ...
    0 0
    Response:

    [DB] Per your link, 0-700 meters is not the whole ocean, and is thus not considered global.

    Per the third sentence of the OP above:

    This new research combines measurements of ocean heat, land and atmosphere warming and ice melting to find that our climate system continued to accumulate heat through to 2008.

    Emphasis added for clarity.

  3. Arkadiusz @2, You will be interested to know that the NODC is now showing oceanic heat content data data for 0-2000 m [H/T to Dr. Gavin Schmidt at RealClimate]. The oceans are not 700 m deep, and the Argo data do not extend down to only 700 m either. I think that you know that. Here is what it looks like when one looks at all the data available: [Source] The climate system is continuing to accumulate heat as shown by Church et al. (2011) and von Shuckmann and Le Traon (2011)
    0 0
  4. It's interesting that not only does the Earth continue to build up heat, but the rate of build-up over those 5 years appears to hardly even have slowed. The "skeptics" won't be happy.
    0 0
  5. The NODC data for the ocean heat content 0 - 2000 m, where the graph in comment #3 is based upon, are publicly available from: ftp://ftp.nodc.noaa.gov/pub/data.nodc/woa/DATA_ANALYSIS/3M_HEAT_CONTENT/DATA/basin/3month/ I calculated a linear trend from 1995 to now: 0 - 2000 m = 0.76 x 10^22 J/yr 0 - 700 m = 0.55 x 10^22 J/yr
    0 0
  6. Albatross: From what paper you found that beautiful graph showing the ocean heat content down to 2000 m timeseries?
    0 0
  7. @From Peru I think it is taken from this: http://www.realclimate.org/index.php/archives/2011/10/global-warming-and-ocean-heat-content/comment-page-3/#comment-216562 You can build the graph yourself using the link I gave in comment #5, see file "ohc2000m_levitus_climdash_seasonal.csv". The data per year are also available on the same ftp server.
    0 0
  8. Sorry, the trends i gave in #5 are from 1990 to now based on the monthly data.
    0 0
  9. Interesting gradient JosHag. Divide by s/yr (3x10^7) and surface area of the earth (5*10^14 m^2) and you get a flux of 0.5W/m^2. Which is a plausible number of energy imbalance.
    0 0
  10. @Kevin C For the ocean part of surface of the world (70.8%) it would be 0.76 / 1.14 = 0.67 W/m2. You can calculate other interesting trends from the period from 2003 up to now, which is the period some 'skeptics' use to indicate that the rise in OHC has flattened, e.g. : http://bobtisdale.wordpress.com/2011/09/08/2nd-quarter-2011-nodc-global-ohc-anomalies/ Trends I obtained from the ohc-levitus monthly data for 2003 - now: 0 - 2000 m = 0.42 x 10^22 J/yr 0 - 700 m = 0.05 x 10^22 J/yr It seems to me that 0.42 x 10^22 J/yr is not the same as flattened.
    0 0
  11. From section 5: This more negative aerosol (or other) forcing is required for energy balance, as there was little surface warming over the last decade even though greenhouse gas concentrations continued to increase (with a small decrease in solar input) and the ocean continued to warm and sea level continued to rise. If I understand this correctly then the 'missing heat' is still missing. Deniers have seriously mis-represented the issue of missing heat. It is not that there is less heat in the ocean than the models predict. The missing heat arises if we total all the heat that we can track going into and out of the climate system; it doesn't agree with the total heat being accumulated in the system. Hence the 'more negative (or other)' forcing required to balance the heat budget. Finally as far as I can tell the total heat content of the ocean is not directly measured in this paper, but inferred from sea level rise, correcting for factors such as ice sheet melt, ground aquifer depletion, and then assuming the rest of the sea level rise is thermal expansion. The advance of this paper over previous studies is that the sea level budget has been balanced (as per introduction), although I haven't yet figured out what that actually means.
    0 0
  12. Put Albatross's graph from NOAA @3 together with Rob Painting's post on Meehl (2011) and you have a thing of beauty. As the Skeptics keep asking, 'why did the Earth stop warming over the last decade?'. Answer. It Didn't, it just went deeper. And even during the deep solar minimum a couple of years back, it still kept warming. That graph needs to be disseminated widely!!
    0 0
  13. Yes Glenn, that graph is great. If only Albatross give us the reference (and if possible, the link) to the paper from which it was extracted... ... Title of the paper - authors - date of the paper N.B: The title is the most important reference to find the paper on an internet search.
    0 0
  14. Of course we can accept this point of view here (and finish the discussion): “In a recent study (Loeb et al. 2011) Co-Chair Norman Loeb addresses a seemingly contradictory issue with respect to observed interannual variations in net TOA radiation and ocean heat storage raised by Trenberth and Fasullo (2010). On a global annual scale, interannual variations in net TOA radiation and ocean heat storage should be correlated, since oceans serve as the main reservoir for heat added to the Earth-atmosphere system. Wong et al. (2006) showed that these two data sources are in good agreement for 1992–2003. In the ensuing 5 years, however, Trenberth and Fasullo (2010) note that the two diverge from one another. The new paper by Loeb and co-authors uses improved satellite top-of-atmosphere (TOA) radiation measurements and a new analysis of ocean heat content data to show that while Earth’s energy imbalance and ocean heating rate have exhibited variability consistent with El Niño-Southern Oscillation (ENSO), there is no evidence of a decline during the past decade. Satellite observations of top-of-atmosphere (TOA) net radiation constrained by recent in situ ocean heat content data indicate that during the past decade Earth has been accumulating energy at the rate 0.52 ±0.43 Wm–2. These results suggest that although Earth’s surface has not warmed significantly during the 2000s, energy is continuing to accumulate in the sub-surface ocean at a rate consistent with anthropogenic radiative forcing.” ... however: I. I would - finally - know “mythical” “study (Loeb et al. 2011)” ... II. Also remind these sentences with von Shuckmann and Le Traon 2011.: “Our results show that GOIs derived from the Argo measurements are ideally suitable to monitor the state of the global ocean, especially after November 2007, i.e. when Argo sampling was 100% complete. They also show that there is significant interannual global variability at global scale, especially for global OFC. Before the end of 2007, error bars are too large to deliver robust short-term trends of GOIs and thus an interpretation in terms of long-term climate signals are still questionable, especially since uncertainties due to interannual fluctuations are not included in our error estimation.” “Uncertainty estimations due to the data handling reveal that this increase is significant during the years 2005–2010 (this does not mean, of course, that these are long term trends).” 2007 years ... - When was that? 10 - 20 - 30 years ago? The (possible) " error bars" interesting writes (and discuss) R. Spencer.
    0 0
    Response:

    [DB] Perhaps it's the language barrier, but your extensive quotations lack a summary conclusion by you.  You are not making any point that makes any sense.

  15. From Peru, my reading of Albatross's article above is that, while Church et al 2011 only includes a 'snapshot' of the change in heat content over time, the research behind that involved tracking the heat content for the entire period... which data they then supplied to Albatross. Thus, the 'original source' for that graph is the short article at the top of this page... though the underlying data is the same that was compiled for Church 2011.
    0 0
    Response:

    [DB] CBD, Albatross' image links back to that furnished in a comment response by Gavin over at RealClimate.

  16. Looking at five year averages of the difference between the 700m heat Ocean content and the 2000m data, (assuming the data is treated consistently and I haven’t messed up) we see a significant increase in this difference in all ocean basins (and also checked for both hemispheres) over the past decade, against a background of continuing global increase in 0 to 2000m heat content. The departure from the very small global 700m to 2000m differences over the 1980 to 2000 period is marked. This would indicate continued and consistent warming of deeper layers during short term changes nearer the surface.
    0 0
  17. An interesting chart. Enso does act to move heat between the surface and the subsurface, with El Ninos moving heat from subsurface to the surface, and vice versa for La Nina. However most of this effect seems to happen above 700 metres if you track the detailed evolution of ENSO events, but possibly the effect extends deeper down in a more subtle manner. On this basis the strong La Nina period of the early to mid 70s increased heat content in 700-2000. Then between 1980 and 1998 a strongly El Nino dominated period resulted in a loss of heat which was a little more than enough to offset the heat that global warming put into this layer. Then since 1999 a more La Nina dominated period combined with global warming resulted in a rapid rise of 700-2000 metre heat content. Although squinting at the colours with my partially colour blind eyes, it looks like the strongest heat gain is in the Atlantic? Whereas if ENSO was driving the multi-decadal variation I'd expect it to be strongest in Pacific.
    0 0
  18. Several comments about the graph supplied by Albatross from RC. It would be interesting to know the basis of how the 7000-2000 data was estimated pre-Argo Looking at when the 700 & 2000 lines diverge around 2003, really this is when the Argo data started to become available. So this may be simply joining to disparate data sets together. But the really interesting period is 2007-2010. That divergence looks real. And during a Solar minimum at that. And that huge climb around 2000-2001! Could that be the energy transferred during the 1998 El Nino supressed the value a year or so earlier then it recovered? We really, REALLY need to see a paper on this! I wonder how many skeptics will look on this as a very big nail in the coffin of the 'it hasn't warmed since 1998' meme?
    0 0
  19. Michael Hauber - "Although squinting at the colours with my partially colour blind eyes, it looks like the strongest heat gain is in the Atlantic?" Heat from the Indian Ocean is leaking into the Atlantic. See: What caused the significant increase in Atlantic Ocean heat content since the mid‐20th century? - Lee (2011) Not the 700-2000 mtr layer though. It'd be really nice, to see a review paper putting all this into context.
    0 0
  20. I have assumed until now that the oceans were largely being warmed by the heat in the atmosphere. I believe that this graph points to a different conclusion. It would seem that the energy increase in the ocean is much larger in scale than that of the atmosphere. If you take into account that water is much harder to warm than air, it would seem impossible that the atmospheric warming alone has been responsible for the oceanic warming. So where is the energy to warm the oceans coming from? There is only one major source....the melting of the arctic sea ice. I believe that the albedo effect has been grossly underestimated. If this is the case then we are in a heap of trouble as the magnitude of this effect is set to double over the next decade as the arctic eventually becomes ice free in the northern summer.
    0 0
  21. atcook27 - I have assumed until now that the oceans were largely being warmed by the heat in the atmosphere. I don't think you're alone in that regard. Quite conveniently I have a post on that topic coming up in a couple of days time. It's the sun that warms the ocean, but greenhouse gases regulate the amount of heat they retain. The post should be published on Sunday.
    0 0
  22. Thanks Rob, I look forward to seeing what you have to say. p.s. I don't think that it's coincidental that the recent extremes in weather we're seeing have occured since the precipitous decline in the arctic sea ice in 2007.
    0 0
  23. About the graph at #3: the corresponding graph at RealClimate doesn't have the error bars (+ or - 1 sigma dotted lines). I think they are crucial to the figure: the data show that 0-2000m contains less heat than 0-700m from 1955-1975. I don't think that's possible, so it has to be noise in the measurements. The problem appears to go away when you look at the error bars. That makes it ewen more immportant to have the original source for that figure.
    0 0
  24. @Jsquared You can find the original graph with the error bars from comment #3 on: http://www.realclimate.org/index.php/archives/2011/10/global-warming-and-ocean-heat-content/comment-page-3/#comment-216587 I don't think the graph is taken from an article but is probably build by Schmidt himself, he links in his comment to: ftp://ftp.nodc.noaa.gov/pub/data.nodc/woa/DATA_ANALYSIS/3M_HEAT_CONTENT/DATA/basin/yearly/ The monthly data are here: ftp://ftp.nodc.noaa.gov/pub/data.nodc/woa/DATA_ANALYSIS/3M_HEAT_CONTENT/DATA/basin/3month/ Also see my comment #7
    0 0
  25. @JosHag Thanks. The Levitus 2000m time series at nodc.noaa.gov (mentioned in #7) doesn't have the error column. The file h22-w0-2000m.dat does (3rd column). And there are two of those graphs over at RealClimate - one wittout the error bars (mentioned in #7) and one with (mentioned in #24).
    0 0

You need to be logged in to post a comment. Login via the left margin or if you're new, register here.


The Consensus Project Website

THE ESCALATOR

(free to republish)


© Copyright 2024 John Cook
Home | Translations | About Us | Privacy | Contact Us