Climate Science Glossary

Term Lookup

Enter a term in the search box to find its definition.

Settings

Use the controls in the far right panel to increase or decrease the number of terms automatically displayed (or to completely turn that feature off).

Term Lookup

Settings


All IPCC definitions taken from Climate Change 2007: The Physical Science Basis. Working Group I Contribution to the Fourth Assessment Report of the Intergovernmental Panel on Climate Change, Annex I, Glossary, pp. 941-954. Cambridge University Press.

Home Arguments Software Resources Comments The Consensus Project Translations About Support

Twitter Facebook YouTube Mastodon MeWe

RSS Posts RSS Comments Email Subscribe


Climate's changed before
It's the sun
It's not bad
There is no consensus
It's cooling
Models are unreliable
Temp record is unreliable
Animals and plants can adapt
It hasn't warmed since 1998
Antarctica is gaining ice
View All Arguments...


Username
Password
New? Register here
Forgot your password?

Latest Posts

Archives

The Medieval Warm(ish) Period In Pictures

Posted on 10 July 2011 by Rob Painting

The Medieval Warm Period (MWP) is a subject of "skeptic" focus, primarily because it was a time of natural warming. It took place from about 950-1250 AD, and, as opposed to today's warming which is global in extent and due to human activities, the MWP was mainly a northern hemisphere phenomenon and smaller in scale. Indeed, the advance of North American glaciers during the MWP is in stark contrast to what is happening in North America today. 

The MWP in global maps 

Mann (2009) was an analysis of a large set of climate/temperature proxies (ice cores, tree rings, cave mineral deposits, sediments, etc.) covering the MWP. See below:

Figure 1: Reconstructed surface temperature anomaly for Medieval Warm Period (950 to 1250 A.D.), relative to the 1961–1990 reference period. Gray areas indicate regions where adequate temperature data are unavailable.

It's clear from the map that only limited areas of the world were warmer during the MWP than the 1961–1990 reference period, Greenland in particular.  Much of the rest of the planet, especially the oceans, were cooler. And take note of the cooler North American west coast, which is consistent with the glacier advance there during the MWP. Obviously, the Earth has continued to warm even further since the 1961–1990 period, so the difference in temperature between the MWP shown in the reconstruction and today is even greater.

Climate Models and the MWP

The climate proxies suggest a rather different distrubition of heat and rainfall than today. So the question arises: based on the current well-understood climate system, can ocean-atmosphere processes produce temperature patterns like the MWP? For answers we turn to climate models.

The cool central and eastern Pacific suggested by Mann 2009 explain some of planet-wide climate features observed in the MWP, but they fail to explain other aspects, such as as a more positive North Atlantic Oscillation (NAO), and increased rainfall in parts of Asia.

Graham (2010) used the NCAR climate model and, based on findings from other modelling studies and proxy evidence for a warmer Western Pacific Ocean, found that by forcing the simulation to have a slightly warmer Indian and Western Pacific Ocean relative to other ocean basins, the model results match the climate suggested by the proxies.

Below are the comparisons between the climate model control runs (a pre-industrial baseline) and the simulations including a warmer Indian-Western Pacific Ocean, for the northern hemisphere (boreal) winter (figure 2 and 3)

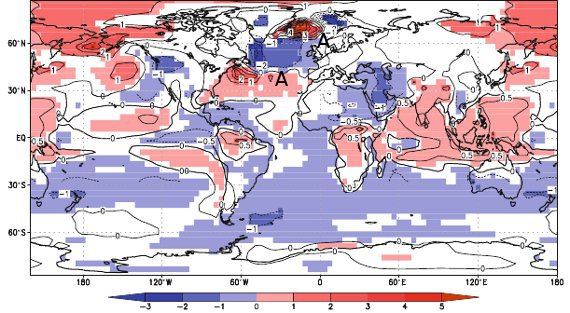
Figure 2: Differences in December–March temperature between the Indian Ocean Warm Pool (25) and control simulations (°C, color; values are Sea surface temperature over ocean and 2-m temperature over land).Lined contour interval is 0.5°C between 30°N and 30°S and 1°C elsewhere. From Graham 2010.

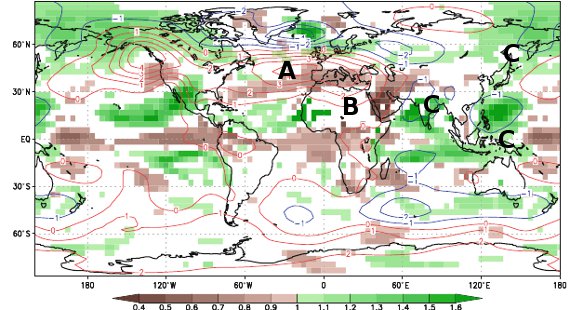
Figure 3: Differences in December–March precipitation (expressed as fraction of Control simulation, color) and Sea level Pressure (difference, hPa) for the Indian Ocean Warm Pool simulation. SLP contour interval is 1.0 hPa except 0.25 hPa in the region 30°S–40°N and 25°E–100°E where the ?ner interval highlights temperature-driven low pressure around continental periphery of northern Indian Ocean. From Graham 2010.

The warm Indian-Western Pacific Ocean, combined with the cool Central and Eastern tropical Pacific reveals a good match with the paleoclimate proxies shown in the Mann 2009 reconstruction, namely:

  • The NAO becomes more positive (A in figure 2 and 3), matching proxies of Atlantic sea surface temperature and sea ice distribution. This due to an atmospheric teleconnection (two connected atmospheric processes separated by large distances) between the NAO and warming over the Indian Ocean.
  • Seasonal dryness in northeast Africa (B in Figure 3 ) 
  • And wetter conditions in India, Southeast Asia and China(C in figure 3)

A mechanism for such warming of the Indian and western Pacific Oceans has not been found, nor do the climate model simulations resolve all the patterns suggested by the proxies (such as warming of the British Isles); however, these findings represent another small step forward in piecing together the puzzle of the MWP, and also support the interpretation of the proxy data in Mann 2009.

Science marches on while skeptics don't

The MWP was very unlike warming today; the growing North American glaciers during the MWP being somewhat of a giveaway. The MWP only affected warming in a handful of regions, with Greenland being especially warm (Figure 1), whereas much of the Earth was actually cooler than the late 20th century.  By comparison; today virtually every glacier and ice sheet on the planet is in rapid retreat.

Both the climate proxies and the climate models imply that the MWP was a re-organization of the Earth's climate, and that much of this re-organization can be explained by oceanic patterns of warming and cooling, although what started all this rolling in the first place is still unknown.

So while some climate "skeptics" are stuck in a time loop, wilfully reliving their own version of Groundhog Day, science continues to move forward.

0 0

Printable Version  |  Link to this page

Comments

1  2  Next

Comments 1 to 50 out of 64:

  1. There is one thing about the Mann 2009 paper that I could not find: Where is the evidence about past sea surface temperatures in the Tropical Pacific? The paper show that during the so-called MWP the Tropical Pacific was dominated by a persistent La Niña anomaly. However, the only climate proxies for SST anomalies in the Tropical Pacific that I could find were in the following paper about the Central Pacific: El Niño/Southern Oscillation and tropical Pacific climate during the last millennium That shows an incomplete record of the SST anomalies in the central Pacific (NINO 3.4 area), showing that at least during the periods covered by the Palmyra Islands coral record, the NINO 3.4 zone was dominated by La Niña. But in the Mann 2009 paper (from where the above map was taken) show a persistent La Niña over the entire MWP and also shows the NINO 3 area as a zone with reconstructed cool SST anomalies. From what proxies did Mann obtained proxies that record the entire 1000 past years and from where obtained data about the entire NINO3 area, a zone where there are no islands? I searched for studies showing this, and I just found the Palmyra Islands (incomplete) record for just the NINO3.4 area linked above. I would like more info, both for having a better answer to the "skeptic" arguments about the MWP and for living in Peru, where the ENSO climate oscillation is the dominant force in the regional climate and weather behaviour (after all, the name "El Niño" is a Peruvian one, referring to the Holy Baby (Jesus Christ) Christmas holiday that is when typically an ENSO event peaks)
    0 0
  2. From Peru: I noticed the same thing and I am sure Mr. Painting will address this issue.
    0 0
  3. From Peru, Mann 2009 uses a Climate Field Reconstruction (CFR) method. This method involves analysing proxies and instrumental records for spatio-temporal covariance patterns during periods when sufficient data is available, then applying those patterns to build past maps when and where there is no physical data. SSTs at any given gridpoint would be reconstructed by reference to proxies (land or ocean, near or far) with an established covariance relationship.
    0 0
  4. I've been going through a process of collecting papers on the MWP and now have a list of about 300 papers. I'm still in the early process of reading them but already what is becoming obvious to me is that the MWP moved around quite a bit. It's Medieval only in the very loosest sense of the definition. Warming in any given region only lasted a couple hundred years and the warming seems heterogeneous. You might have warming in one region from 700-900 and warming in another region from 1100-1300, and other regions you might see no warming at all. The other notable issue seems to be the sparsity of southern hemisphere proxies, so most multi-proxy reconstructions are heavily weighted to the northern hemisphere which should bias reconstructions toward warming. There is still lots of new research coming out all the time. Already in 2010-11 a plethora of new papers have hit the journals. My general sense is that, as more data comes to light the hockey stick is going to start to straighten back out to something more resembling Mann's 99 work. And that is going to be a real stick in the craw of the denier set.
    0 0
  5. Not everyone reading this article will know what the "NCAR model" is. Please insert explanatory info into the text or in a footnote.
    0 0
  6. Badger - hyperlink provided. From Peru - "However, the only climate proxies for SST anomalies in the Tropical Pacific that I could find were in the following paper about the Central Pacific" The supplementary information for Mann (2009) is here. It details the CFR method outlined by pauls, and note the data and codes provided. From Peru-" From what proxies did Mann obtained proxies that record the entire 1000 past years and from where obtained data about the entire NINO3 area, a zone where there are no islands?" There are few proxies for the tropical Pacific, Palmyra coral, Galapagos coral, and Californian and South American marine sediments, but given the locations of the two indexes are you proposing some new, as yet unobserved, flavour of ENSO? There was a bit of scientific 'how's your father' over whether the Pacific SST's were warm or cold up until recent years, but the general concensus now is that a La Nina-like background state prevailed in the MWP. El Nino and La Nina still happened, but the background state was cool like La Nina. A cool tropical eastern-central Pacific (La Nina-like) validates the paleoclimate proxies for rainfall elsewhere on Earth during the MWP, in contrast to a warm eastern-central Pacific (El Nino-like) which doesn't. For example: the centuries-long megadrought, of the (now) southern United States, during most of the MWP is only observed in climate modeling when the tropical Pacific is in a cool La Nina-like background state. Combining the La Nina-like Pacific with the warm Atlantic (evidenced by the strong positive NAO) matches the distribution of drought and wet areas in North America during the MWP. Suggest you have a read of Graham (2010) provided in the post. The point of this post was to highlight that the Mann (2009) proxy data are consistent with climate model simulations, and modern-day observations of global circulations. The La Nina drying of the southern US is a feature still observed today. From Peru-"I would like more info, both for having a better answer to the "skeptic" arguments about the MWP" May pay to ask them why North American glaciers were advancing during the MWP too. I can point you to a few other recent studies if you're interested. From Peru-"and for living in Peru, where the ENSO climate oscillation is the dominant force in the regional climate and weather behaviour" Long-term, most models indicate an El Nino-like background state for the tropical Pacific. Again that doesn't mean more El Nino's, just the background warming resembles the El Nino state. This will be bad for the Peruvian fishing industry if it occurs, and Amazonian drought too.
    0 0
  7. 3-century "anomalies" relative to a 30-year period of AGW?
    0 0
  8. Alec, a baseline is a baseline is a baseline. 1961-1990 is commonly used by climate scientists for historical reasons.
    0 0
  9. dhogaza, thank you, I do understand that. But it's still strange. I remember that during the last 40 or 50 years of global warming, temperatures in the States have changed, if I remember correctly within the 48 contiguous states temperatures only have been raising steadily in the NW-Pacific and they have been decreasing in the Bible Belt, though finally they have started to go up. If we look at figure 1 and subtract that we'd get a pretty neutral image. That's why I found pretty strange to take 300 years and compare it against a much shorter period full of climatic developments. I found pretty oxymoronic the act of comparing a pluri-centennial period against a shorter one in order to say that those three centuries were "all quiet in the western front" relative to a shorter quickly-changing abnormal reference [I see some acknowledgment of inadequacy in the coloring in Figure 1, chosen to deemphasize values close to those in the base period -and probably, huge radius too-]
    0 0
  10. Alec - If you have some better way of comparing the MWP with modern-day temperatures I'm all ears. I considered the point you raise when writing the article, but I just wanted to see what you had to add, before answering.
    0 0
  11. The MWP has been acknowledged as the last period of globally warm temperatures (not just NH as claimed above). The global temperature anomalies are similar to today, although some differences may exist. Whether that period was warmer than today is still open to debate, as different proxies present different results. The comparisons are important as they can reveal changes which have occurred in the past century (not just 30 years) with those that have occurred in the past. In order to show that today's warming is unprecedented, it has be larger in magnititude and more rapid than previous episodes. In addition to the questionable sea surface temperatures, other work has shown significant warming in Russia compared to Figure 1 above. http://hal.archives-ouvertes.fr/docs/00/29/81/68/PDF/cpd-3-1-2007.pdf http://www.baikalscience.org/?cat=12 Russia also experienced the MWP at different times, earlier in the West, later in the east, with temperatures warmer than the present by 1C or more. http://www.pages-igbp.org/products/abstracts/solomina.pdf
    0 0
    Response:

    [DB] "The MWP has been acknowledged as the last period of globally warm temperatures"

    Citation?  As it stands, a nonsensical statement.

  12. @ Eric, #11 Your link to Baikal Science confirms Mann's analysis. The areas it identifies as having significantly warmd during the MWP (Taymir and Putoran, are also labelled in Figure 1 above as having warmed. The area of the Ural Mountains discussed in your link to Demezhko are also represented as having warmed in figure 1. As you're currently 0-2 I'm not going to bother with your link to Solomina.
    0 0
  13. @#10 Rob, I'm downloading the article by Mann, Zhang, Rutherford et al, and the supporting online material and I'm finding -correct me if I'm wrong- that a few proxies were used, that grey masks indicates regions were 1961-1990 data is insufficient to draw climatic normals -not insufficient proxy data, what didn't mean there were aplenty-, regions without hatching didn't pass validation, and the whole set was got using computer modeling. I suppose that when I read and analyze the article and dataset -at the best of my capacity- I'll be able to find what role played the proxies other than getting low-frequency components of the signals to reconstruct. I know it's nice to look at a world map and confirm happy Vikings in Iceland and Greenland and turbulent Mongols and Tartars in the seek of better pastures. It looks like reassurance. It's not so nice that the reconstruction for the Little Ice Age in the same work is showing also not cooling Iceland and southern Greenland. In my opinion variability in times of slow changing technologies is what makes your living impossible. Then, what's the use of a 12-generation anomaly? What I've seen so far makes me think that not much more imprecision would have come from using 1941-1970 normals. What would have let us comparing MCA, LIA and nowadays AGW. There'll always be the layman approach to the driven conclusions. That shouldn't drive anybody to choose inappropriate base periods.
    0 0
  14. 11, Eric the Red,
    The MWP has been acknowledged as the last period of globally warm temperatures (not just NH as claimed above).
    Completely untrue. Citation, please.
    The global temperature anomalies are similar to today...
    Untrue. Citation please. It was not as warm, and temperatures in many, many areas were cooler. The warming was far from global, or equally distributed in either space or time. Hence, your statement is only remotely close to true if you use a running 200 year average to compute temperatures, and even then temperatures were still markedly lower than those of the last ten years in particular.
    Whether that period was warmer than today is still open to debate...
    Not remotely true. Look at the literature instead of just making stuff up.
    In order to show that today's warming is unprecedented...
    There is no need to show that today's warming is unprecedented. That it will inevitably be unprecedented, whether or not it is now, is the second important point, but the main point is that the cause of today's warming is unprecedented. It is being caused by the understandable and predicted effect of CO2, and it will be close to irreversible in human time frames if we take things too far. What is most entertaining about you, of all people, clinging to the MWP as yet another excuse to deny the physics behind climate science is the fact that there is no known or imaginable major source for warming in the MWP. This implies that such a cause was relatively small. This in turn points to a very, very high climate sensitivity as opposed to the foolishly low values to which you are so dearly wedded. That is the only way that the MWP could have been "as warm as today." If you believe in the MWP, then you must refute your need to cling to climate sensitivity predictions below 3˚C per doubling.
    0 0
  15. Alec... I'm not sure why you're stuck on baseline periods. Pick a baseline of your own, it doesn't really matter. Choose a random baseline period if you like, it doesn't change the result of any of the data. The only thing a baseline period does is establish a zero axis.
    0 0
  16. I can imagine one source for warming in the MWP: a small forcing and a high sensitivity. I can also imagine that sensitivity is not a constant, in fact I propose that in various threads e.g. and never get an answer except "weather won't save us". It may well be that weather won't save us and that amplification of CO2 will be high. But that doesn't mean that weather didn't help cook the MWP.
    0 0
    Moderator Response: (DB) You again make unsupported assertions (both here and on the other threads you reference) that fly in the face of known physics; that type of statement is referred to as "climastrology" and may fly in endeavors such as automotive research in the US, but is simply not credible in a climate science forum.
  17. Sphaerica... Spot on. In fact, the whole challenge of the MWP is getting an accurate read on what the actual global temperature was then, rather than just local temps. What climate deniers continually do is locate the one (or a few) proxies that support their position and claim that everything beyond that is a big conspiracy without ever bothering to look at the full body of evidence.
    0 0
  18. True, Am I misreading Figure 1. It looks as if Mann was saying that the two Russian areas were cooling by 1+C rather than warmer by 1+C. If Mann is stating that they were warming, then I agree. Sphaerica, Some evidence, in addition to those precedented in my previous post, showing a global MWP. http://ruby.fgcu.edu/courses/twimberley/EnviroPhilo/CookPalmer.pdf http://www.clas.ufl.edu/users/rrusso/gly6932/Oppo_etal_Nature09.pdf http://www.leif.org/EOS/2009JD012603.pdf
    0 0
  19. @#15 Rob, why somebody would analyse "the Medieval Warming Period" and "the Litle Ice Age" if not for comparison with actual developments? If the adjectives "Western European" or "Northern Atlantic" were added, that would be a horse of a different colour. Why a warming period in human history has no paired higher global temperature to show? So, there must be some preconceptions the researchers are trying to address, for instance, that the actual warming period can't be compared with the so-called MWP. Then, baselines are important, otherwise, why they use anomalies instead of instrumental temperatures? If we have to be sensitive to change, be sure we are sensitized using a proper base. In a post that is addressing general publics that is no minor an issue. On the other hands, when a thing is an important subject for analysis and not a bit of a stretch, one should easily find other works with other base temperatures. Summarizing: MWP, LIA and actual AGW could be "easily" shown in contrast against a "normal" base, showing some misleading local warming and cooling for the first two what has clearly nothing to do with actual developments. Don't we have it? Well, such things happen when one allows [-snipped inflammatory comment] to dictate one's syllabus.
    0 0
  20. 18, Eric the Red, First, did you actually look at the papers you linked to? The last, Kellerhals et al, shows current temps substantially higher than the MWP. The first, Cook, shows the MWP to be a fractionally present bump not much greater than other temps in the period, and also much lower than current temps. So what exactly are you trying to prove? And even if you found 3 proxy studies that show what you want, you're missing both points. The first is that that is mere cherry picking. A careful analysis of the data shows that warming that is supposedly the MWP is not contemporaneous... one study shows a peak in 1100, another 1300, another 950. It's also not nearly uniform around the globe. While one study shows a warm period here, another location at that same time shows cooling. There is no doubt that there was a MCA, but there is no evidence that it was global, substantial evidence that it was not, and substantial evidence (as you have so kindly provided yourself) that temperatures even regionally did not match those of modern times. Beyond this, you missed the other main points, which are first that whether there was a MWP or not, it does not change the radiative physics which clearly show we are causing greenhouse gas warming now, and if there was a MWP, and it was as warm as temperatures are now, then climate sensitivity is high and your constant admonishment that you are sure that climate sensitivity is likely to be below 2C goes out the window.
    0 0
  21. Eric Red - "The MWP has been acknowledged as the last period of globally warm temperatures (not just NH as claimed above). The global temperature anomalies are similar to today" So you comment without actually reading the post? How can global temperature anomalies be similar to modern-day when North American glaciers were growing in the MWP?, and when the central and eastern tropical Pacific was much cooler than the 1961-1990 reference period?
    0 0
  22. Sphaerica @20, Good points. And let us not forget this: Comparison of temperature reconstructions, re-centered to match CRUTEM NH land record (based on each reconstruction's period of overlap). [Source]
    0 0
  23. Yes, Notive how all the proxies show the MWP as being warmer than today?
    0 0
    Response:

    [DB] Factually incorrect.  See Martín-Chivelet et al.

  24. Especially the global temps from Lohle.
    0 0
  25. Do you have any references showing otherwise?
    0 0
  26. Eric... You might check out the first diagram in the article here. It seems that, for one, almost the entire central Eurasia region was actually cooler. I believe this is the point. There are clearly areas around the planet that show a MWP but the warming is heterogeneous in both time and place, and many areas of the planet were actually cooler during the MWP. This is completely different than today where we have extremely accurate measurements of the homogeneous warming. Call it a braided hockey stick with a very straight blade.
    0 0
    Response:

    [DB] Interested parties may see also Koch and Clague 2011 wherein they show that that several glaciers in western North America and elsewhere in the world advanced during Medieval time and that some of these glaciers achieved extents similar to those at the peak of the Little Ice Age, a very cold period many hundreds of years later.

    More discussion on this here.

  27. DB: The reason for the advancement of the glaciers is not certain. There are proxies from NA that show during the MWP the precip was extensively higher than present. That would cause the advancement of glaceriers even if the temperature was warmer.
    0 0
    Response:

    [DB] Citations please. Unsupported claims carry little weight.

    Precipitation increases do not necessarily translate into glacier advances.  The mass balance between increased depositions in the accumulation zone have to outweigh losses in the ablation zone for glaciers to advance.  Warming typically increases the size of the ablation zone and decreases that of the accumulation zone resulting in glaciers pulling back from their terminal moraines.

  28. DB: Koch etal talks about the increased precipitation in the Western Conus. Here is a paper that has been cited 70 times about temperatures during the MWP: Global Warming: A Geological Perspective
    0 0
  29. Camburn#27: "during the MWP the precip was extensively higher than present. That would cause the advancement of glaceriers even if the temperature was warmer." High precipitation plus warm temperatures = glacial advance? Not what Kirkbride and Dugmore 2008 found in Iceland: medieval glacier advances between the 9th and 13th centuries are firmly identified for the first time in Iceland. This challenges the view of a prolonged Medieval Warm Period and supports fragmentary historical data that indicate significant medieval episodes of cooler and wetter conditions in Iceland. -- emphasis added Koch 2008 is also a good short summary on this question: an advance of Llewellyn Glacier, which drains the northeast sector of the Juneau Icefield, at the time of the Medieval Warm Period, cannot be reconciled with temperatures similar to those of today. This evidence suggests that temperatures were significantly lower than at present during the Medieval Warm Period, calling into question the existence of prolonged warmth at that time. We conclude that the Medieval Warm Period is at best an ill-defined term that encompasses a number of possibly unrelated climate anomalies. -- emphasis added
    0 0
  30. Camburn#28: "a paper that has been cited 70 times about temperatures during the MWP" Good one. From 1999, the primary evidence presented for MWP temperatures dates from 1966: Graph is modified from Keigwin, L. D., 1966, The Little Ice Age and Medieval Warming Period in the Sargasso Sea: Science, v. 274, p. 1504 - 1508. Nothing much has changed in dating technology since the '60s. Or at least what little I remember of the '60s.
    0 0
    Moderator Response: [muoncounter] Correction: Keigwin's Sargasso Sea paper was published in 1996. The referenced source (Bluemle, Global warming: a geological perspective, which appears in NDGS Newsletter, vol. 26 no. 2) misprints the date of Keigwin as 1966 in their Figure 4 caption.
  31. muoncounter: I dn't have access to the full paper, Kirkbride and Dugmore. Note tho, that the glaciers did not peak at the same approx time. With that in mind, remember how small Iceland is. I will also point out that the proxy data from the Sargosa Sea presented in my link does not match the reanalysis from the Mann paper ref fig 1.
    0 0
  32. muoncounter: Woods hole was pretty excited about this, and to my knowledge, this temp study of the Sarasota Sea has never been disputed till now. I don't understand how Dr. Mann missed this. Woods Hole discussion of Sarasota Sea proxy data
    0 0
  33. muoncounter - this is however the dynamic for glaciers on west coast of NZ. In deep shaded valleys (and with high rockfall load, the increased precipitation from warmer Tasman sea overrides the warmer terminus. I think the same dynamics affect glaciers in southern South America. I'd say you need data from past behaviour of the glaciers concerned to interpret the changes. That said, I think Eric is onto a rich vein of denial memes (eg Loehle is good construction; proxies are show cooler than MWP even if instrument doesnt; I guess Mann 2009 is wrong because its by Mann?
    0 0
  34. But of course, since the dissemblers would have us believe the MWP was as warm or warmer than today, the Arctic must've been mostly melted then, too, right? But actual evidence shows that the waters now entering the Arctic Ocean from the Atlantic Ocean are the warmest they've been in the last 2,000 years. Yet another MWP "Silver Bullet" (an underwater hockey stick, no less). Time for another Coors Lite...
    0 0
  35. Alec Cowan @ 13 & 19 - Okay so nothing constructive, I thought this might lead to some rational discussion - my bad. I think if you're wanting someone to rail against it should be Hubert Lamb? He's the one who started the MWP nonsense in the first place.
    0 0
  36. Camburn @ 32 - The Sargasso sea was warm in the MWP. See figure 2 above. Mike Mann is well aware I'm sure.
    0 0
  37. @35 Wow, wow! It looked a bad copy of [- snip unnecessary disease references; some people around here actually have those problems -] Do I need to recite a creed to get clearance? It's difficult to me; I'm Postheist. But called to do it, and as my only objection is using the verb "believe", I say: I believe in an ongoing AGW that is endangering the biosphere in such a degree that an obstinate keeping of those trends in the eighties during a couple of centuries will provoke events of dire consequences in a global scale. That said, if you can avoid spotting a denier in disguise in every criticism you'll hear from me, you may explain for me what is the "it" in your "I think if you're wanting someone to rail against it should be Hubert Lamb?". I found that in English people tend to get cocky before talking clear. Additionally, as you should have realised from the start, I'm not saying that the so-called MWP wasn't just a regional development. I'm saying that Figure 1 can be misinterpreted as showing a cooling average because it's contrasted against a warm period. That is not bona fide, the same way that is not bonafide your innuendos of me being a climatard just because I don't agree automatically with what is shown here. Your belligerent summoning for me to have all the backing information of Mann, Zhang, Rutherford et al read and analyzed together with a search for alternative renders for that period, in less of 24 hours, in a working day, is not bonafide too.
    0 0
    Moderator Response: [muoncounter] The only thing you need do to get 'clearance' (whatever that means), is keep your comments rational, on topic and supported by evidence. No one really cares about your 'creed' or your interpretation of English speech patterns.
  38. Using the proxy data referenced by Albatross, Mann (2008) showed temperatures between 1000 and 1100 to be similar to 2000. The Moberg (2005) proxies (NH only) were highest in the 1000 - 1100 years. Loehle (2008) shows the highest global temperatures occurred ~900. Ljungqvist proxies show the highest NH temperatures centered around 1000. All these proxies show a distinct MWP, although the timing varies due to the proxies used.
    0 0
  39. #35 Rob, I've got the gridded data from climate normals 1961-1990 as an anomaly on a 1941-1970 base. This is the graphic -using a 250km radius-: Now I have the problems of having two different grids and that those gridded data in Figure 1 are supposed to be plotted using a Matlab file. But I think that I'll finally manage to get a 5° grid for the image and to write a script to take gridded info from Figure 1 in order to develop a graphic that will approximately show what I am speaking form the very beginning. By eyeballing both images I could notice what I expected -what is dangerous itself: to expect- in comparison with Figure 1: even a bit warmer Iceland and Greenland, not so turbulent Mongols and Tartars, and about the "Figure 1" for LIA -Figure 2 in Mann et al- a confirmation of the reason for my city of birth to be established twice.
    0 0
  40. scaddenp#22: "That said, I think Eric is onto a rich vein of denial memes" 'Warmer weather is good for glaciers' should have an especially good run. Our current warming must therefore be the teaser for the upcoming fourth Ice Age, which is scheduled for worldwide release in July 2012. Manny, Diego, and Sid - embark upon their greatest adventure after cataclysm sets an entire continent drift. Separated from the rest of the herd, they use an iceberg as a makeshift ship, which launches them on an epic seafaring quest. ... as they encounter exotic sea creatures, explore a brave new world, and battle ruthless pirates.
    0 0
  41. No, Eric, timing and strength depend on WHERE the proxies come from - hence the preferred name of MCA. Not a simultaneous global warm period. Also, to the idea that MCA was warmer than now if only you used proxies, well there are a couple of rather important proxies to consider. One is sealevel - where is the evidence of global sea level higher in MCA? The other is glacier. How come glacial retreat worldwide is exposing rock that hasnt seen light of day for 1000 or more years?
    0 0
  42. scaddenp#41: "timing and strength depend on WHERE the proxies come from" A proxy here, a proxy there; soon you're talkin' real data. Another location analyzed: Cronin et al 2003, with comparison to the venerable Sargasso Sea data. If the Chesapeake record for the period 450–1000 AD is viewed as a baseline for comparison to 19th and 20th century temperatures in lieu of pre-1000 AD atmospheric records, then the magnitude of recent Chesapeake temperature extremes are larger than those observed even during the relative warmth 1000–1500 years ago. Although this result may be partially due to greater sampling resolution in the last two centuries, it is nonetheless consistent with evidence from other studies suggesting that recent decadal climate variability in the North Atlantic region is extreme relative to long-term patterns and may be in part anthropogenic in origin. -- emphasis added And there's that pesky consistency of the evidence again. I guess it's easy to object to one data point and pretend the rest don't exist.
    0 0
  43. One has to take the MWP in context to understand it. We all know that there are places on earth that have not warmed as much as the rest of the earth. Continental USA is one of those places. There are always various cold/hot spots. The evidence of a MWP over climatic times is quit evident. The extent of the warmth is what is in question. We do know that the proxy data from the Sarasota sea shows that area has not warmed to the same level as during the MWP. Does this mean the whole world was as warm? I doubt it, and proxy data would not confirm this. Do we know there were areas that were warmer than present temps?.....Yes, the proxy data confirms this as well.
    0 0
    Response:

    [DB] BTW, it's usually called the Sargasso Sea.

  44. Camburn#43: "One has to take the MWP in context to understand it." Very well put, sir. Figure 1 of this post provides just such context. It makes the 'MWP' look more like a couple of MWS (Medieval Warm Spots). Some credible warming along the SE coast of Greenland, the southern US and little else besides a couple of tepid patches of ocean. Surely you aren't saying that dull yellow 0.1-0.3 degree anomaly is the real thing?
    0 0
  45. Let's try another tack. Sealevel and glaciers are long term integrators of climate change. There is numerous lines of evidence showing MCA was not as warm as today. So where is the evidence that shows glaciers retreated further during MCA than now; or that sealevel during MCA was higher than now? Ie if you are going to hypothesize that MCA was a warm if not warmer than today, then show us the proof in those long term integrators.
    0 0
  46. I looked at the Loehle paper a while ago. He simply averages the different proxy deviations from normal, and does a bunch of slight of hand to claim the average is robust. There was to my reading no attempt to weight the individual proxies for geographic area covered or test non-MWP 'knowns' for statistical similarity or difference from the few non-northern hemisphere proxies. For the life of me I can't understand why such weren't demanded in peer review....although I do get the point that the paper wasn't in a truly peer reviewed journal. Unless someone can show otherwise, just collecting a bunch of proxies without geographic weighting simply isn't legit. And I'd still like to know what was driving the alledged MWP. I've yet to see a hypothesis for such. It's not enough to flap your arms and say "It's natural".
    0 0
  47. Dave... You might note where the Loehle paper is published, and just as important, where it's not published. I don't think there was much in the way of review there. If I'm not mistaken that paper got rejected all down the line, fairly aggressively, before landing at E&E.
    0 0
  48. Thank you DB. Anyways, the fig 1 is the temp pattern for the MWP unless I am misunderstanding it. It is very obvious that the Saragasso Sea was warmer during this period than depicted on fig 1. This does throw a large amount of uncertainty into the reanalysis presented.
    0 0
    Response:

    [DB] "This does throw a large amount of uncertainty into the reanalysis presented."

    Not on the basis of any information you have presented.  Your link shows that the area of the Sargasso Sea was warmer at various periods of time than it was at the most recent data point in the graph - 385+ years prior to 1966. 

    Which is odd, given that Keigwin 1966 includes station data for the period 1924-1966, which are not shown in the source you provide.  As constituted, the totality of the warming post-1880 is unrepresented. 

    Either way, you are still conflating a regional proxy into global effects.

    Keigwin 1966

    [Source]

  49. The issues with Loehle are well known - merely citing it should be a red flag that denialist site is involved somewhere. (Actually its fun to look at who has cited it Scholar and in what publication).
    0 0
  50. scaddenp, You were requesting information on glacial retreat. The first in from Schnidejoch in Central Europe, the second is from Glacier National Park in Montana, and the third is from the Greenland ice cores. http://www.giub.unibe.ch/klimet/docs/climdyn_2007_grosjean_et_al.pdf https://www.cfa.harvard.edu/~wsoon/RajeshKoushik10-d/MacGregoretal10-12900yrSwiftcurrentLakeGlacierNatlPark.pdf ftp://ftp.ncdc.noaa.gov/pub/data/paleo/icecore/greenland/summit/gisp2/isotopes/gisp2_temp_accum_alley2000.txt
    0 0

1  2  Next

You need to be logged in to post a comment. Login via the left margin or if you're new, register here.


The Consensus Project Website

THE ESCALATOR

(free to republish)


© Copyright 2024 John Cook
Home | Translations | About Us | Privacy | Contact Us