Climate Science Glossary

Term Lookup

Enter a term in the search box to find its definition.

Settings

Use the controls in the far right panel to increase or decrease the number of terms automatically displayed (or to completely turn that feature off).

Term Lookup

Settings


All IPCC definitions taken from Climate Change 2007: The Physical Science Basis. Working Group I Contribution to the Fourth Assessment Report of the Intergovernmental Panel on Climate Change, Annex I, Glossary, pp. 941-954. Cambridge University Press.

Home Arguments Software Resources Comments The Consensus Project Translations About Support

Twitter Facebook YouTube Mastodon MeWe

RSS Posts RSS Comments Email Subscribe


Climate's changed before
It's the sun
It's not bad
There is no consensus
It's cooling
Models are unreliable
Temp record is unreliable
Animals and plants can adapt
It hasn't warmed since 1998
Antarctica is gaining ice
View All Arguments...


Username
Password
New? Register here
Forgot your password?

Latest Posts

Archives

What happened to greenhouse warming during mid-century cooling?

Posted on 3 July 2010 by John Cook

A few weeks back while researching global brightening, I came across a gem of a paper: Impact of Global brightening and dimming on global warming (Wild et al 2007). The paper examines temperature trends over the second half of the 20th Century, including the cooling period in the middle of the century. From the 1950s to early 1980s, while CO2 levels were rising, global temperatures cooled slightly. How can this be if CO2 causes warming? Wild 2007 found there was greenhouse warming during this cooling period and they find it in an interesting place...

The paper looks at trends in the amount of sunlight reaching the ground over the latter 20th century. Various factors can affect how much sunlight gets through to the Earth's surface, with the amount of aerosols in the atmosphere being the main contributor. And of course, the amount of sunlight reaching the surface will have an effect on global temperatures. Wild 2007 attempts to disentangle just how much contribution this surface dimming and brightening has on global temperature.

They start by looking at measurements of surface radiation from 1958 (when widespread measurements began). They find a period of "global dimming" from 1958 to 1990 where surface radiation fell. Afterwards, the dimming levels off and transitions to slight brightening from 1985 to 2002. While the warming during the period of solar dimming is moderate, the warming is more rapid in the last two decades where dimming was no more present.


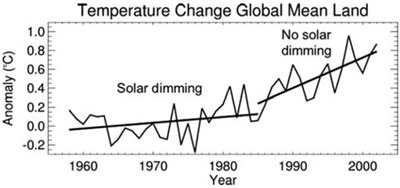
Temperature change over global land surfaces from 1958 to 2002.

How much does global dimming and brightening contribute to the temperature trends. To disentangle the effects of dimming and brightening from greenhouse warming, Wild digs a little deeper into the temperature record by looking at the daily temperature cycle. Sunlight affects the daily maximum temperature more than the nightly minimum, which is affected more by the greenhouse effect. What they find is from 1958 to 1985, during global dimming, the maximum daytime temperature falls. This makes sense as less sunlight is reaching and warming the Earth's surface. The interesting result is that over this period, the nighttime minimum temperature increases. While global dimming was cooling temperatures in the daytime, the increased greenhouse effect was warming in the nighttime.

From 1985 to 2002, the warming trend during the daytime increases significantly and almost catches up to the nighttime warming trend (almost but not quite). This is consistent with the surface radiation measurements which find global dimming levels off or transitions to brightening in the mid 1980s. Global dimming masked greenhouse warming until the 1980s. Once the atmosphere cleared and the dimming was removed, global warming came into its own.

Does this mean global brightening could be responsible for global warming? Not quite. While there has been some global brightening since 1985, the amount of sunlight hitting the Earth hasn't reached 1960 levels yet. Sunlight has fallen since 1960 while global temperatures have risen 0.8°C. The daily temperature cycle indicates its greenhouse warming that has driven the warming. Yet another human fingerprint!

Where did CO2 warming go during mid-century cooling? Global dimming caused by pollution masked the increased greenhouse effect. Nevertheless, the CO2 warming was still percolating away while we were sleeping.

0 0

Printable Version  |  Link to this page

Comments

Comments 1 to 25:

  1. John, You say, "They find a period of "global dimming" from 1958 to 1990 where surface radiation fell. Afterwards, the dimming levels off and transitions to slight brightening from 1985 to 2002." I think your 1990 should maybe be 1980?
    0 0
  2. Global dimming is covered at Wikipedia, of course, here. http://en.wikipedia.org/wiki/Global_dimming Or, watch the Nova Video, "Dimming the Sun," from April18,2006, here.
    0 0
  3. Very very interesting paper and post, nice catch. It must also be borne in mind that the global cooling was mainly Northern Hemisphere, as would be expected since that's where most of the pollution was. Temps in the Southern Hemisphere were more or less level. Has anyone disentangled dimming/brightening in the two hemispheres?
    0 0
  4. Guillaume Tell: Your link which you describe as the 'Nova Video', "Dimming the Sun," from April18,2006', is in fact the BBC Horizon documentary called 'Global Dimming' which I saw in 2005. It's a damn good film -- well worth watching -- and is summarised in the words (I conflate the last minute or so); "Global dimming has been protecting us from an even greater threat... global warming". "To carry on pumping out GHGs while cleaning our pollution is suicidal". "We're rapidly running out of time... This is not a prediction... it's a warning". A statement which echoes John's last para and does not pull any punches.
    0 0
  5. John Russell... I just watched that video. I knew about the study done on vapor trails during the few days after 9/11 but I somehow missed the extent of the warming they turned up. One degree C is nothing short of startling. Thanks for posting that, Guillaume.
    0 0
  6. Of course you fail to mention the good correlation with the PDO and 20th century temperature inflexions (albeit that the PDO doesnt explain the long term upward trend).
    0 0
  7. Wild has produced a review of the subject which might help give a broader picture of the subject. Enjoy.
    0 0
    Response: Thanks for the link. Wild's 2009 review features prominently on the examination of global brightening.
  8. My first question is that these changes outlined by Wild seem enormous. In his review I see figures such as -5.1W m-2/decade for the dimming period and 2-6Wm-2/decade for the brightening period. Given that the Hansen (and the IPCC) suggest all greenhouse gases contribute 3W m-2/decade to the present imbalance, and the nett imbalance is around 1 I was wondering if you like to comment on how these studies fit into the overall picture of global warming?
    0 0
  9. HumanityRules, Wild himself explicitly addressed your question: "The decadal changes in SSR found in the dimming/brightening literature are at first sight often unrealistically large from a radiative forcing viewpoint, as, e.g., presented by IPCC [2007]. [...] However, one should be aware that the radiative forcing concept as used in the IPCC reports applies to changes at the tropopause, which cannot be directly compared to changes at the surface."
    0 0
  10. Riccardo Yep thanks I read that after posting the question. Just to flesh that idea here is more of that quote. "Scattering and absorbing processes in the atmosphere are additive with respect to their effects on SSR at the surface, but may be opposed at the tropopause." I was interested how that fits with an idea further in the review. In 3. How Can We Explain Global Dimming/Brightening? he initially rules out changes in the sun as being responsible for this dimming/brightness changes with "The larger of these two estimates is equivalent to a global average increase of 0.17 W m2 decade1 in energy input to the climate system due to the variable emission from the Sun. These estimates are at least an order of magnitude smaller than the changes detected from surface observations of SSR." It seems in this sentance he is trying to directly compare TOA changes with SSR in order to rule out the changes in the sun as playing any major role in this process.
    0 0
  11. HumanityRules, yes; all else being equal, a change in TSI, i.e. input at TOA, will be proportionally seen at the surface as well.
    0 0
  12. 11 Riccardo But what about the "Scattering and absorbing processes in the atmosphere are additive with respect to their effects on SSR" Surely this is also true with respect to the extra energy from the sun?
    0 0
  13. My understanding is the additive nature comes from the energy being re-measured at the surface due to the greenhouse properties of the atmosphere, i.e. it is trapped and reflected back down to be measured again. This is why surface measurements are amplified compared to TOA measurements. Let's say more energy is entering the system from the sun (0.17 W m-2decade-1) surely that energy will also be scattered,absorbed and reflected to the surface and show as an amplified signal in the SSR. There is no reason this extra solar energy should behave in any special way. The question surely has to be the magnitude of this amplification in order to work out the contribution from changes in the sun?
    0 0
  14. HumanityRules, "all else being equal", the change is still proportional to the change in TSI (both scattered and absorbed fluxes are proportional to the incoming flux), and is "at least an order of magnitude smaller than the changes detected from surface observations of SSR."
    0 0
  15. Apologies that the quote from the review is so long but here it is in full. "The decadal changes in SSR found in the dimming/ brightening literature are at first sight often unrealistically large from a radiative forcing viewpoint, as, e.g., presented by IPCC [2007]. Therein, radiative forcings altering solar radiation between preindustrial (year 1750) and present day are on the order of minus 1–2 W m2 on a global average, while some of the surface-based estimates show similar or larger changes already within a decade (Tables 1–3). Indeed, under the assumption of a climate sensitivity of 0.5–1C perWm2 radiative forcing as suggested by current climate models, a change of several W m2 decade1 as inferred from surface observations would imply enormous decadal variations in surface temperature which are not observed." It appears from the numbers presented here that the decadal changes in SSR are an order of magnitude (or more) greater than the long term decadal trend at the TOA. Where does this enormous difference come from? Surely from the changes in the additive effects of a greenhouse atmosphere. That means the additive effects on the paltry 0.17 from changes in the sun must also be enormous when measured at the surface. The question surely has to be if "enormous" is anywhere near "an order of magnitude". Wild doesn't say. And until he does it seems difficult to rule out how much changes in the sun is contributing to these changes in dimming/brightening as measured at the surface. To go back to my original point, what he's doing here "The larger of these two estimates is equivalent to a global average increase of 0.17 W m2 decade1 in energy input to the climate system due to the variable emission from the Sun. These estimates are at least an order of magnitude smaller than the changes detected from surface observations of SSR." seems to be exactly what he warns against doing here. "The decadal changes in SSR found in the dimming/brightening literature are at first sight often unrealistically large from a radiative forcing viewpoint, as, e.g., presented by IPCC [2007]. [...] However, one should be aware that the radiative forcing concept as used in the IPCC reports applies to changes at the tropopause, which cannot be directly compared to changes at the surface." that is comparing a TOA reading to SSR. Maybe we could clear this up if you could state what the changes in SSR would be from the 0.17Wm2/decade measured at the TOA due to solar variation. I don't think Wild presents enough here to state that accurately.
    0 0
  16. HumanityRules, it's not that SSR and TSI are incommensurable quantities. Wild just said that you can not compare SSR and forcing at TOA taken at face values.
    0 0
  17. "Wild just said that you can not compare SSR and forcing at TOA taken at face values." That still doesn't detract from the idea that he uses an inadequate argument to dismiss the role of TSI in the change of measured SSR. An arguement he, and you, state is based on a false comparison. What is the magnitude of the "enormous" difference in the decade changes in SSR and the long term TOA trend and where does that difference arise? My argument is it is sufficiently large to allow changes in TSI to have some impact on the changes seen in the SSR measurement. Dismissing TSI based on the 0.17 figure is dismissing it based on the wrong measurement. That is what Wild does in his review.
    0 0
  18. Great post, John. What worries me about this situation is the relative life spans of CO2 and other pollution (sulfates, etc.) from burning coal. If we reduce our use of coal, the dimming effect will end almost immediately, leaving us at the mercy of a couple of centuries of CO2 emissions. If we keep burning coal as we are now, we're cooked. The only alternative is to find a way to make CCS work on a large enough scale and then deploy it to new plants as well as those already in operation. Quite the nasty corner we've painted ourselves into...
    0 0
  19. One of the things I've always wondered about is the effect dimming has on crop growth. If we are seeing a 10% reduction in brightness of sunlight reaching the Earth's surface, does this reduce our ability to produce the yields required for the 50% increase in food production that the UN says we'll need by 2050 for the additional 2.5bn people that will be clamouring to be fed by then? Perhaps this is something to factor in when considering dumping sulphates in the upper atmosphere as a geo-engineering 'fix'? I'd be grateful if one of the scientists here could set my mind at rest.
    0 0
  20. HumanityRules: Are you sure you have understood Wild's methods and reasoning? To me it seems not. First, the TOA and SSR changes are not model results, they are inferred from analysis of measurements, and different methods provide comparable estimates. Second, the surface effects of long-term TOA trend might be measurable, but, unless you postulate some dramatic kind of feedback, they must be of the same order of magnitude as the signal, that is, very small. Third, Wild notes in the abstract: "The relative importance of aerosols, clouds and aerosol-cloud interactions may differ depending on region and pollution level." Which indicates that there is no simple answer to your question about where the difference arises. And the volcanic record clearly shows us that the observed effects are possible. Maybe it would be helpful if you notice that solar irradiation not reaching the surface, may not be entirely "lost" to Earth, and that it is not really the SSR that counts, but the actual radiation balance. I'm not sure we would have had that much more warming without the global aerosol dimming.
    0 0
  21. The paper provides evidence that less cloud cover is responsible for a significant part of global warming, which is what skeptics have been saying. We are only talking a few percent of cloud cover to account for present global warming, although cloud cover may be only one factor. The proposed method for pollution causing dimming is that it provides more nucleation centers for water droplets, and fine drops reflect more energy back into space than large droplets. The energy is not destroyed. Analysis of pollution concentrations seem to be indicating that manmade pollution is too small an effect to account for the pre-1980 dimming. Some volcanoes put sulfates high up in the upper atmosphere, and that definitely results in cooling. Only a relatively few volcanoes get the sulfates up high enough to have the effect; Mount Pinatubo was one. There have been fewer such volcanoes in recent years. The models predicting climate crisis do not model volcano effects, although modelers are forced to discount the bad years. Skeptics argue that climate is complex, so that recent global warming is a product of CO2, ocean cycles, low volcano activity, cosmic ray activity, and so forth. Effects added during 1980-1995. Crisis advocates argue that nothing is going on of significance except CO2, and since nothing else was affecting climate the CO2 effects must be multiplied beyond what straight physics predicts. That's why 15 years of no warming is a problem for CO2 theory. However, it is consistent with complex causes.
    0 0
    Response: "Skeptics argue that climate is complex, so that recent global warming is a product of CO2, ocean cycles, low volcano activity, cosmic ray activity, and so forth"

    Climate scientists also argue this point. See CO2 is not the only driver of climate to discuss this point further.

    "That's why 15 years of no warming is a problem for CO2 theory."

    I'm guessing this is refering to the skeptic argument: "Phil Jones said no warming since 1995". This argument is analysed in detail - please continue any discussion of that argument at the relevant page.
  22. Roy Latham at 02:59 AM on 5 July, 2010 1) “15 years of no warming”. Please explain which data set you used to justify this and why you pick this period which happens to end with a La Nina cooling dip, and what the error bars are? All surface and troposphere data over the entire measurement period show warming trends. Ocean Heat Content also increased and the overall long term trend in all climate series since 1980 is upwards. Your statement seems dubious. 2) “Analysis of pollution concentrations seem to be indicating that manmade pollution is too small an effect to account for the pre-1980 dimming” Wild 2009 (HumanityRules at 16:01 PM on 3 July, 2010 beat me to this) proposes the opposite, that Sulphur pollution decreased in the 1930s, increased in the 1940s to the 1980s, and decreased since that time. He suggests a link with dimming and NH temperature variations (as opposed to trend). 3) “The paper provides evidence that less cloud cover is responsible for a significant part of global warming”, This is completely misleading. Cloud nucleation is proposed as one mechanism of dimming, However, (Wild 2009): In independent studies “results suggest that the dimming and brightening over Europe becomes even more pronounced after the effects of changes in cloud amounts were removed. Thus, cloud cover changes rather counteracted than enhanced the observed dimming and brightening trends over Europe.” And “cloud cover changes made negligible contributions to the SSR decline in China before the 1990s” From the section summary “Cloud microphysics effects thus saturate at some level of pollution. On the other hand, the overall absorption of solar radiation by aerosols increases steadily and linearly with aerosol loading and aerosol optical depth. This suggests that cloud microphysics effects, such as the first and second indirect effect, come more into play in relatively pristine regions, while the direct and semidirect aerosol effects play the major role in highly polluted areas” (ie the industrialized NH). 4) "The models predicting climate crisis do not model volcano effects" I have certainly read about climate modeling which accounts for volcanic aerosol emissions. I'm sure someone will provide references? I'll reserve judgement till then. To cap all this, Wild cites studies that suggest cloud cover increased over many continental regions over the second half of the 20th century, which is again the opposite to what you (and skeptics?) have said. If Wild 2009 contradicts Wild 2007 on all these points then I apologise. I will leave your rosy perception of what “skeptics” argue alone, but perhaps you should visit the “all arguments” section on this site?
    0 0
  23. Might some of the heat have possibly went into thinning the sea ice? Since the measurements are very sparse prior 1960s there's no knowing how thick it originally was.
    0 0
  24. Roy Latham wrote : "The models predicting climate crisis do not model volcano effects" Peter Hogarth replied : "I have certainly read about climate modeling which accounts for volcanic aerosol emissions. I'm sure someone will provide references? I'll reserve judgement till then." What about James Hanson himself : The congressional testimony in 1988 (13) included a graph (Fig.2) of simulated global temperature for three scenarios (A, B, and C) and maps of simulated temperature change for scenario B. The three scenarios were used to bracket likely possibilities. Real-world GHG climate forcing (17) so far has followed a course closest to scenario B. The real world even had one large volcanic eruption in the 1990s, Mount Pinatubo in 1991, whereas scenario B placed a volcano in 1995. Global temperature change (2006) Original paper here.
    0 0
  25. Roy Latham at 02:59 AM on 5 July, 2010: "Crisis advocates argue that nothing is going on of significance except CO2." Okay, name three then. Just thee "crisis advocates" claiming CO2 is the only significant factor. ("Name three" slightly stolen from blogger Dave Hitt, but I'm sure he doesn't mind.)
    0 0

You need to be logged in to post a comment. Login via the left margin or if you're new, register here.


The Consensus Project Website

THE ESCALATOR

(free to republish)


© Copyright 2024 John Cook
Home | Translations | About Us | Privacy | Contact Us