Why Greenland's ice loss matters
Posted on 27 May 2010 by John Cook
There are various stages of denial along the skeptic spectrum. The first stage is "It's not happening". In the case of the Greenland ice sheet, an early argument was that "Greenland can't be losing ice because it's gaining ice in the interior". However, a number of independent lines of evidence have all shown that overall, the Greenland ice sheet is losing ice. In fact, the rate of ice loss is accelerating. In light of this unequivocal evidence, many have moved onto the second stage, "okay, it's happening but it's not so bad. Greenland is losing 286 gigatonnes of ice per year? Big deal! There's around 3 million gigatonnes still remaining in the huge ice sheet. Take a chill pill, alarmist!"
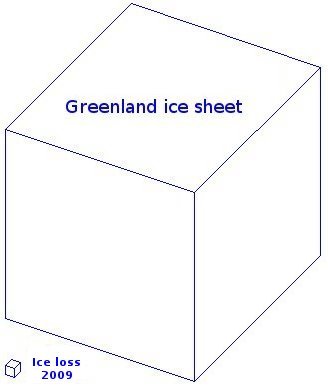
This view is articulated by Willis Eschenbach in On Being the Wrong Size (well, he didn't say to take a 'chill pill', that was creative licence on my part). Eschenbach argues that Greenland is losing about 0.007% of its total mass every year. At that rate, it will take 15,000 years to dissipate. Personally, I love a good visual so kudos must go to one of our regulars, Berényi Péter, who posted this picture in an earlier Skeptical Science comment, comparing 2009 ice loss to the total ice sheet:
The important point to remember here is that ice loss is accelerating. In 2002, the ice loss was 137 gigatonnes per year (Velicogna 2009). At that rate, the ice sheet would take nearly 22,000 years to dissipate. By 2009, this rate had more than doubled to 286 gigatonnes per year, reducing the ice sheet "lifetime" to 10,500 years. As the rate of ice loss increases, the ice sheet's lifetime is also diminishing.
So the crucial question is how will the Greenland ice sheet behave in the future? Extrapolating an accelerating curve into the future is always problematic. However, there are several different ways to approach the problem.
One method is to study the physics of glacier movements. One paper calculates glacier dynamics factoring Greenland's topography, the cross-sectional area of its glaciers and whether the bedrock is based below sea level (Pfeffer 2008). Including contributions from Greenland and Antarctica, the study estimates global sea level rise between 80 cm to 2 metres by 2100.
A semi-empirical technique looks at how sea level and global temperature have changed in the past (Vermeer 2009). Sea level change can then be expressed as a function of temperature change and future projections of global temperature can be used to simulate future sea levels. This method predicts global sea level rise of 75cm to 180cm by 2100.
Climate modelling of the Greenland ice sheet predicts eventual collapse of the Greenland ice sheet if CO2 levels go over 400 parts per million (ppm). We're currently at 392 ppm. At 400 ppm, they predict that over the next 400 years, the ice sheet will lose between 20 to 41% of its volume (). This is equivalent to roughly 1.4 to 2.8 metres of sea level rise just from Greenland.
Lastly, we learn much about how the Greenland ice sheet behaves by looking at sea level change in the past. The more optimistic IPCC emission scenarios predict warming of 1 to 2°C. The last time temperatures were this warm was 125,000 years ago. At this time, sea levels were over 6 metres higher than current levels (Kopp 2009). This tells us the Greenland and Antarctic ice sheets are highly sensitive to sustained, warmer temperatures and are likely to contribute sea level rise measured in metres in future centuries.
So Willis Eschenbach and Berényi Péter do us a service in illustrating how much ice is still left in the Greenland ice sheet. This is a vivid reminder of Greenland's potential to contribute significantly to sea level rise in the future. And multiple lines of peer-reviewed evidence, both modelled and empirical, all paint a similar picture. The Greenland ice sheet is highly sensitive to warmer temperatures and is likely to contribute sea level rise in the order of metres over the next few centuries.

Arguments


But isn't this what all the IPCC future climate projections do? These very 'problems' are what skeptics are concerned about.
Another point, wasn't the early Holocene also 1-2 degrees C warmer than now?
I think Eschenback is making a point that minute Greenland ice losses are sometimes reported as something large and worrisome right now, rather than if they continue to accelerate. It's ony going to be a major problem if the 'extrapolated acceleration curves' of the IPCC turn out to be correct.
models do not extrapolate current behaviour. They project on the basis of scenarios, not extrapolations.
immagine to have a pot of water sitting in equilibrium on a spring on a slowly subsiding land; the pot will go down with the land. Then you start draining water from the pot, the spring pushes the pot up and the result will be that the pot will slower motion downward or even reverse direction if you drain fast enough.
Not sure if this analogy makes it clearer.
In the period 1935-1950, the break-up point of the largest glacier was moving upward as fast as today
From the 1920s on. Indeed.
The thing that hath been, it is that which shall be; and that which is done is that which shall be done: and there is no new thing under the sun. Is there any thing whereof it may be said, See, this is new? it hath been already of old time, which was before us. There is no remembrance of former things; neither shall there be any remembrance of things that are to come with those that shall come after.
The power of any scientific theory is to explain what we observe, and to predict what we have not yet observed. Climate scientists are making their best effort to anticipate future trends, but there will always be uncertainty.
Thingamadonta @3 & FerdiEgb @2, the term "Climate Optimum" is value laden. It may have been optimal for some species, but surely not for woolly mammoths (among others). In any case, circumstances were quite different then, with continental glaciers still receding, sea levels considerably lower (stablizing at near current levels ~4,000 B.P.), Venice and New Orleans still in the planning stages, etc. In any case, warming at that time was apparently confined mostly to Arctic regions. Global temperatures are interpreted to have been cooler. We can't assume that contemporary warming will lead to "optimal" conditions.
And how does the total area compare to today? What about other glaciers?
One thing new "under the sun" (unfortunately) is another 100+ ppm CO2.... (and by "new" I mean post-Ecclesiastes!).
"Extrapolating a trend from a cyclic behaviour is quite triggy..."
No one is "extrapolating a trend from cyclic behaviour". Variation of Greenland temperatures/ice sheet mass balance through the Holocene has no element of "cyclic behaviour" (other than the very long term Milankovitch influences whose high N. hemisphere forcing resulted in high N. hemispheric warming around 9000-7000 years ago - this should be causing the Earth to cool achingly slowly now). The ice sheet varied according to variations in forcings and heat transfer, and the effects can be understood in relation to causes.
So we certainly don't look at historical variations of climate phenomena (temperature/ice sheet/heat transport/sea level or whatever) arbitrarily call these "cyclic" and then pretend that that's an "explanation". Variability has accessible explanations in relation to known physics. That's why we can make projections of future behaviour based on empirical observations and theoretical knowledge.
It's very difficult to escape the strong evidence that polar ice mass balance and its rate of change, and the resulting effects on sea level variation, are strongly linked to global temperatures (see references cited here here).
I think that's a reasonable point Arjan. There is still lots of uncertainty about ice sheet dynamics, the factors involve in acceleration of glacier outflow to the seas and so on.
It is possible that the Greenland ice sheet has several metastable states, the transition from one to another perhaps occurring rather quickly. So we can't rule out the possibility that we're seeing an acceleration of ice loss which will stabilise at some new state of reduced mass (e.g. perhaps when a particular region/volume of vulnerable ice has melted).
As far as addressing that specific point I think we probably need to defer to expert knowledge.
As far as I know, ice melt at the Greenland edges is mostly a matter of (summer) temperatures. It has been warmer in the period 1935-1950 (with a loss of 70 meter ice in height) around the ice sheet edges than in the past 10 years. Several stations in Greenland have data since 1880 and show a periodic behaviour with a length of about 40 years for cold(er) and warm(er) periods. There is no significant trend in the Greenland temperature data over this 130 year period. Thus extrapolating the Greenland ice melt from data over the past 10 years is not warranted.
That is also the case for global warming: part of the warming/sea level over the period 1970-2000 is certainly from natural variability (PDO, NAO, AO,...), which have some similar periodicity, while all warming of that period is attributed to CO2 by the models. But no model shows the influence of any known natural cycle with a periodicity between 1 and 100 years. This makes that all models overestimate the effect of CO2 and can't explain the halt in warming over the past decade. The current global temperature is already at the lower end of all projections (except for the brief El Niño period, which is at its end now).
But even a much smaller loss of ice on the century timescale would be economically and socially problematic. If Greenland lost only 10% of its ice, that translates to 0.6-0.7 m sea level rise on top of the sea level rise from thermal expansion, loss of mountain glaciers, and loss of Antarctic ice (so well over a meter of SLR total).
In other words, even a trend much less extreme than that of the past decade would yield much higher rates of SLR than the overly cautious IPCC projections, which don't include dynamical changes to ice sheets.
What about other glaciers?
Click on image or just here for an overview of ancient literature.
Compare the temperatures during recent El Nino episodes. The 1982-1983 and 1997-1998 Ninos were much larger than the 2009-2010 one (both in duration and in magnitude of the peak, e.g. as represented by NINO3.4 anomaly). But 2009-2010 temps are much higher than those in 1982-1983, and rival those of 1997-1998 (slightly lower in the lower troposphere, slightly higher at the surface) despite being a far weaker El Nino.
In other words, natural variability such as ENSO is superimposed on a long-term warming trend from greenhouse gases. A small ENSO peak today produces temperatures comparable to a big ENSO peak in the 1990s, and much warmer than a big ENSO peak in the 1980s.
If the question is, how long before Greenland has disappeared, or is half missing, then yes, a very very long time.
If the question is, is this another line of evidence of warming in that region? Then the topic of lifetime is not so relevant.
If the question is, what does this mean for sea level rise in the next 100-200 years? Then the scale here is not negligible.
Have a look at the ancient inlets all around Greenland. They do not taper to points at their ends. It seems to me that their blunt, squared-off, wedge-shaped ends were formed from meltwater pouring down from massive and very high waterfalls in ancient times when the ice sheet was much much larger and higher (I'm going out on a limb with this one).
Also, has anyone noticed all the melting going on up and around the ice stream that feeds into the end of the Jakobhavns Glacier? It is so bad that it is creating its own clouds of vapor.
Temperatures just to the south have been in the mid 60s.
This year, the edge of the ice sheet already appears to be receding fairly rapidly all along the mid-west to north-west coast.
What about other glaciers?
Or try this.... (from a glacier's perspective.)
Quite simply, it is not the disappearance of Greenland's ice sheet that is worrisome but instead sufficient shrinkage as to significantly exacerbate sea level rise. When Eschenbach directs his readers to follow calculations leading to the elimination of Greenland's ice sheet he's distracting them in a way that one could reasonably conclude is principally intended to be witty as opposed to genuinely insightful and productive.
Greenland could end up looking at a casual glance from space nearly identical to what it does today yet have also bumped up sea level noticeably and indeed even destructively. Why Eschenbach should skip over that point is going to remain an enduring mystery, more so than uncertainties in measuring Greenland's mass balance.
The second issue to consider is what other factors may be a play here that can contribute to an increase in melting. One possible argument was made in 2007 by a study that identified the warming as a result of a thin section of the earth's crust.
"They have found at least one “hotspot” in the northeast corner of Greenland -- just below a site where an ice stream was recently discovered.
The researchers don't yet know how warm the hotspot is. But if it is warm enough to melt the ice above it even a little, it could be lubricating the base of the ice sheet and enabling the ice to slide more rapidly out to sea."
http://researchnews.osu.edu/archive/hotgreen.htm
Sometimes we can't see the forest because of the trees.
Subglacial topography and geothermal heat flux: Potential interactions with drainage of the Greenland ice sheet
Many of the outlet glaciers in Greenland overlie deep and narrow trenches cut into the bedrock. It is well known that pronounced topography intensifies the geothermal heat flux in deep valleys and attenuates this flux on mountains. Here we investigate the magnitude of this effect for two subglacial trenches in Greenland. Heat flux variations are estimated for idealized geometries using solutions for plane slopes derived by Lachenbruch (1968). It is found that for channels such as the one under Jakobshavn Isbræ, topographic effects may increase the local geothermal heat flux by as much as 100%.
Leaving the question, how did the ice sheet reach the size it did in the presence of this flux, assuming it is relatively constant, and what has changed to cause new behavior in the form of broadly distributed mass loss?
By the way, this research was heavily (and appropriately) dependent on modeling combined with observations to produce results. My general point being, let's not disparage some models while highlighting others unless we can offer informative and useful criticism of the model in question. (Geo Guy, I know you did -not- do that here but I think it's a helpful example)
Told you there was no new thing under the sun.
Doug_b..I agree. All I would like to see is a fair assessment of all research before conclusions are arrived at. In the past I have read posts that some scientists believe the rapid movement of the Greenland ice sheet is attributed to surface melt seeping down and lubricating the base of the ice sheet. Now it appears that the water at the base could be attibuted to melting
from below..who really knows?
As for your comments about the flux, don't assume the heat is constant..magma moves like an ocean only in slow motion. There are hot spots and there are cold (relative) spots as the currents move about. Think of it as a period of warm magma currents that have washed against the overlying crust..eating away at the crust thereby making it thinner - much like a warm current eating away at a layer of ice on a lake or ocean. Just as we see in the air and waters, currents move around and switch from hot to cold etc and we can expect the same characteristics within the earth's magma.
As for your comments regarding modeling, it seems the same can be said for many conclusions regarding global warming and climate change which seem to be made based on the output of models. My views regarding models are best suited for another forum
Told you there was no new thing under the sun.
Less important the novelty perhaps and more the particular arrangement. For instance, moving hydrocarbons from entombment to liberation...
The rate of ice loss has accelerated abruptly over the last decade or so. Geothermal heat flux did not change over the last decade or so. It's not responsible for the change.
There are numerous studies that identify the role of magma activity to crustal thinning that supports the contention that von Frese arrived at. It is widely known that geothermal activity originating from magmatic activity can extend well into the crust warming the rocks.
There are active volcanoes under the ice in Greenland and the most recent eruption was in 2006
Doug..I don't pretend to say the problem is only the result of one activity but rather the result of multiple events.
What I would like to see is a recognition that climate is a very complicated systems and that changes to climate are linked to multiple sources, To point the finger entirely at man made (should I say ground originated?) CO2 emissions without correctly accounting for all of the other sources to me is tunnel vision and not reflective of good science.
Hopefully this page will satisfy you then: CO2 is not the only driver of climate
No climate scientist would say CO2 is the only driver of climate. The reason we harp on about CO2 emissions is because when you compare CO2 forcing to all the other forcings in climate, it is the dominant forcing and it's also the fastest rising forcing.
The paper I linked is evidence that the zone of ablation has risen in at least some parts of Greenland, given the fact that glaciers would not be thinning at the headwall if it hadn't.
If you're going to continue saying that there are volcanoes under the ice in Greenland, you'll need some better proof than your say-so.
Think about it for a moment and you might agree, this is a case of science going to extraordinary lengths to get it just as right as possible. No choice, really; look at what's happened to researchers producing climate science findings causing them to collide with public policy and our habits. Spotlights, accusations, recalculations, reobservations, reconfirmations, gaps identified, leading ever more researchers to pile on. I don't think it's paradoxical to say it's all been an ironically extraordinary boon to our understanding of climate. I do however hate to see people tortured because their curiosity leads them in the "wrong" direction. Outrage over silly accusations of fraud is what led me to bother participating on places such as SkS.
http://initforthegold.blogspot.com/2010/05/eschenbach-has-half-point.html
Willis Eschenbach, MT and others are expressing doubt about Velicogna's 2009 finding of accelerating mass loss from Greenland and Antarctica in the period 2002-2009. The suggestion is that she has neglected (or otherwise failed to account properly for) the effect of smoothing on the number of degrees of freedom in the data. My suggestion is that this criticism, if it's well-founded, needs to be conveyed in a comment to GRL. Does anyone else more statistically competent than me want to venture an opinion?
By the way, Ned (#16), on MT's blog I asked "Why would anyone extrapolate a quadratic fit based on a sample of 7 years of data out to 91 years beyond the sample end-points? In either direction?!". You have gone one better by converting it to an exponential before extrapolating. I can only admire your boldness, sir!
But seriously I think we all can agree that "Extrapolating an accelerating curve into the future is always problematic." Or into the past, I might add. We need understanding of the processes.
Not sure that I agree with too much of that Ferdi. There is certainly a trend in Arctic temperatures with a reversal of a long-term very slow cooling, starting in the mid-late 19th century, to yield a rather dramatic warming especially over the last 100-plus years [*].
Greenland itself is more difficult to assess. However it seems also to have warmed considerably since the mid-19th century. The temporal variation in warming is more complex, but recent analysis indicates that this is likely to have been strongly influenced by atmospheric aerosols (volcanic and anthropogenic) to which the Greenland ice sheet is especially susceptible (i.e. to cooling effects) [**]. So the suppression of Greenland temperatures in the late 19th century and the rapid warming especially from around 1910 has likely got a strong contribution from the high volcanic activity in the late 19th/early 20th century, and then a rapid recovery from this aerosol-induced cooling to "catch up" with the enhanced greenhouse-induced forcing. The same likely applies to the cooling in the middle of the 20th century.
So there’s nothing necessarily “cyclic” about these contributions. Rather they’re likely to have been stochastic. A concern raised by Box et al (see [**]) is that Greenland temperature anomalies should rise above N. hemisphere anomalies, and they haven’t got there yet. So it seems we have a bit of extra Greenland warming still to come irrespective of present and future enhanced greenhouse forcing (see [**] for a discussion of this).
As for polar ice melt, there’s no evidence from the trajectory of 20th century sea level rise that early 20th century warming of Greenland was associated with ice melt to the extent that we’ve seen in the last decade. Of course that's not really surprising since globally-averaged temperatures were quite a bit lower then than now. Clearly in a world with globally enhanced temperatures, the rate of ice melt will be greater. That seems to be pretty well established (see papers cited here).
It’s all very well to talk about “natural variability (PDO, NAO, AO,...)” but that doesn’t have much meaning without a quantitative analysis. Swanson et al (2009) have done this and find that while natural variability relating to ocean circulation likely made contributions to early-mid 20th century temperature progression, its contribution to the warming since the early 1970’s has been small (~ 0.1 oC) [***]. And any putative absence of natural cycles from models doesn’t “overestimate the effects of CO2” since natural cycles don’t contribute to long term forcing (they just introduce "noise” around any trend). So Swanson et al. (2009) conclude that natural climate variability (including ocean circulation variability) has made close to zero contribution to the warming since the start of the 20th century.
And it’s very difficult to sell the notion that there has been a “halt in warming over the last decade” when every year of the past decade has been warmer than every year of the previous one bar the highly anomalous 1998 (not to mention that we’ve just had the warmest Dec-Feb quarter on record; NASA Giss).
And I don’t think it makes sense to say that the current temperature is at the low end of all projections when at least through 2006, the temperature trend was near the top end of the IPCC projections [****].
There's no question that Greenland melt is now faster than any previous record of Greenland melt outside glacial-interglacial transitions, and it's rather certain that Greenland melt and its contribution to sea level rise, is going to increase in the coming decades. There is some very fundamental physics involved in these phenomena, and vague reference to ill-defined "cycles" isn't going to alter those facts!
[*] Kaufman, D. S. et al. (2009) Recent Warming Reverses Long-Term Arctic Cooling Science 325, 1236 – 1239
abstract
[**] Box, J. E. et al. (2009) Greenland Ice Sheet Surface Air Temperature Variability: 1840-2007 J. Climate 22, 4029-4049.
abstract
[***] Swanson, K. L. et al. (2009) Long-term natural variability and 20th century climate change Proc. Natl. Acad. Sci. USA 106, 16120-16123.
abstrsct
[****] Rahmstorf, S. et al. (2007) Recent Climate Observations Compared to Projections Science 316, 709.
abstract
I’m a little doubtful of your statement “There is no significant trend in the Greenland temperature data over this 130 year period” I’ve looked at the records, but they are visually summarized nicely by the DMI:
The overall Greenland (and global) temperature trends are strongly positive over 130 years. There does indeed appear to be anomalous Greenland warming between 1920s and 1940s. This is strongest at these NH latitudes, there is some debate as to why. Recent work on aerosols is interesting as the US has been a major industrial source of sulphates and the concentrations extracted from Greenland ice cores (which give high resolution records covering this period, I think it’s in McConnell et al., 2007) mirror the variations, even if they do not mirror the overall rising trend. Perhaps the “natural variations” aren’t so natural.
Tamino at OpenMind would be -ideal- for this work but surely he has a day job, might not be able to take it up.
"Extrapolating an accelerating curve into the future is always problematic." Or into the past, I might add. We need understanding of the processes.
We understand the processes pretty well hadfield. If the Earth temperature stabilises, land ice volume (and sea level) will eventually settle around an equilibrium state. Raise the temperature and the ice will melt, and sea levels will rise towards a new (reduced land ice volume) equilibrium state. If the temperature is higher, then the rates of land ice melt and sea level rise will be faster.
It's pretty simple physics. At a given temperature above the equilibrium temperature there will be a fairly constant rate of melt on the decadal timescale. As temperatures rise, so the rate of melt accelerates. Extrapolating this into the near future is likely to be pretty reliable.
The simple physics of this phenomenon and its agreement with empirical observations, has been recently reiterated here
On the former, I was hoping to get a few more eyeballs on the issue. As you say, Doug, Tamino could offer an informed opinion. He could probably sort this out before breakfast, and then get to his day job.
On the latter, I was pointing out the instability and ill-foundedness of purely mathematical extrapolations. A pretty obvious point, I admit.
And now I must get back to my day job.
Kaufman, et al., “Recent Warming Reverses Long-Term Arctic Cooling,” Science, 4 September 2009: 1236-1239, DOI: 10.1126/science.1173983 concluded that 20th Century Arctic warming reversed a trend of Arctic cooling that had persisted for some 2000 years prior to that. Such (it would seem) is the power of AGHGs (although the warming apparently got started rather early, it would appear), as shown below.
Moreover, the unusual Arctic warming described by the estimable Sir Joseph Banks, actually seems to show up during the mid-teens on the proxy-temperature trends of Kaufman et al., yet it is barely a 'blip'. In fact, the entire proxy temperature curve reminds me of a hockey stick, that is in the process of being lowered to the ice by a sharp-eyed goalie, in the hopes of blocking an oncoming slapshot! (Where is the Medieval Warm Period, when Vikings apparently basked in the warmth of sunny Greenland?!)
I was, however, very pleased to see in the Summary, and on p. 288 of the proceedings, that the Royal Society saw fit to honor Sir Humphrey Davy, who, among his other important scientific contributions, designed a lamp that could safely illuminate underground coal workings, while not causing them to explode. There are current efforts underway to attempt to capture 'coal mine methane' before it escapes into the atmosphere.
Has this feedback been studied, and is it significant, compared to normal melting?
I think the most of criticisms there are off-base. There was some complaint about certain corrections not being applied in the figure, but I think those effect either a constant value or trend, not acceleration. I can't access the paper right now (too many of my usernames and passwords are remembered only by my browser, on the computer that is in the shop), but the question about the quadratic fit F-test may be on target (it is if the commenters are right about the smoothed data set being used). However, given that the annual variation has a solid physical basis, the better way to handle it would be to compare a linear + annual period model to a quadratic + annual using the monthly data points (each monthly point is independent). My bet is that the quadratic model fits significantly better.
This factor is a subject of some arguments amongst the professionals. I've come across some articles on the subject; the ones I remember were looking more at Antarctic Peninsula glaciers and shelves rather than Greenland glaciers. Pine Island Glacier comes to mind. The impression I left with was that tides and storm surges were much larger effects, but every little bit adds up, and, as the ice thins through increased outflow, eventually a balance point is reached where small changes can matter. However, obviously, a spring tide in combination with a storm surge would dwarf any sea rise that is expected any time soon.
Jeff F., I'm not sure that uplift will play much around the coast. I'm thinking that uplift will be greater where the mass loss is greater. Since the edges of the ice are inherently thinner than the interior, I'd suspect that there is greater potential for uplift in the interior.
In the larger picture, I consider sea level rise to come in third, in terms of threat level, behind reductions in agricultural production as a result of changing patterns of temperature and precipitation, and behind problems associated the ocean acidification. Problems associated with sea level rise involve relocating people and the buildings they live and work in; the others lead to problems feeding all the people.