Climate Science Glossary

Term Lookup

Enter a term in the search box to find its definition.

Settings

Use the controls in the far right panel to increase or decrease the number of terms automatically displayed (or to completely turn that feature off).

Term Lookup

Settings


All IPCC definitions taken from Climate Change 2007: The Physical Science Basis. Working Group I Contribution to the Fourth Assessment Report of the Intergovernmental Panel on Climate Change, Annex I, Glossary, pp. 941-954. Cambridge University Press.

Home Arguments Software Resources Comments The Consensus Project Translations About Support

Twitter Facebook YouTube Mastodon MeWe

RSS Posts RSS Comments Email Subscribe


Climate's changed before
It's the sun
It's not bad
There is no consensus
It's cooling
Models are unreliable
Temp record is unreliable
Animals and plants can adapt
It hasn't warmed since 1998
Antarctica is gaining ice
View All Arguments...


Username
Password
New? Register here
Forgot your password?

Latest Posts

Archives

The human fingerprint in global warming

What the science says...

Select a level... Basic Intermediate Advanced

Multiple sets of independent observations find a human fingerprint on climate change.

Climate Myth...

It's not us

'What do the skeptics believe? First, they concur with the believers that the Earth has been warming since the end of a Little Ice Age around 1850. The cause of this warming is the question. Believers think the warming is man-made, while the skeptics believe the warming is natural and contributions from man are minimal and certainly not potentially catastrophic à la Al Gore.' (Neil Frank)

At-a-glance

Since the pre-industrial era, we have burned ever-increasing amounts of fossil fuels. This we can see for ourselves, often just by looking out of the window or hear, by listening to the flow of traffic. The sights and sounds of fossil fuel burning, constant, perpetual.

We cannot see or taste carbon dioxide, one of the two main products of that combustion, the other being water vapour. But it's constantly heading up into our atmosphere – in 2021 alone the figure for such emissions, according to the International Energy Agency, was 36,300,000,000 tonnes of the stuff. Just imagine for a moment that amount of sand piled up in a heap!

Once up there, one key difference between carbon dioxide and water vapour becomes critically important. Water vapour condenses to form clouds and freezes to form ice crystals. Rain, hail, sleet and snow all fall from clouds – it's a constant, ongoing cyclic process, even though different places see much more – or much less precipitation.

Carbon dioxide has no liquid state at the pressures encountered in Earth's atmosphere. Instead, at normal atmospheric pressures, it sublimes from solid to gas at −78 °C. Solid carbon dioxide is also known as dry ice, but cannot form in the range of temperatures found within Earth's atmosphere, although it is produced industrially for various purposes. So as opposed to water vapour, carbon dioxide is an example of a non-condensing gas: once up there it stays up there for a long time. That's why our vast CO2 emissions are causing levels of the gas to build and build.

If you needed a smoking gun in order to accept the above, there is one: carbon dioxide derived from fossil fuel burning has a very distinct chemical fingerprint that is readily measurable in air samples. To find out how we do that, read the further details below. Such measurements, with a trend precisely following the pathway we would expect due to our increasing emissions, show that far from being someone else's problem, one way or another we are all bang to rights in this case.

Please use this form to provide feedback about this new "At a glance" section. Read a more technical version below or dig deeper via the tabs above!


Further details

If you wanted to find a smoking gun with respect to human carbon emissions and their role in global warming, where would you look? There are several and the Intermediate version of the rebuttal lists and describes many of them, but we’ll start here with the most important one.

Fossil fuel production and usage is all well-documented. For that reason, CO2 emissions are also well-documented. In 2019, some 44.25 billion tons (or gigatons) were emitted to the atmosphere (IPCC AR6, WG III Technical Summary 2022). That figure was the highest recorded in a steady year-on year upward annual trend.

So we know all too well that every year of late we have added tens of billions of tonnes of CO2 to the atmosphere. How do we detect that fossil fuel signature in the air? 

Human fingerprints

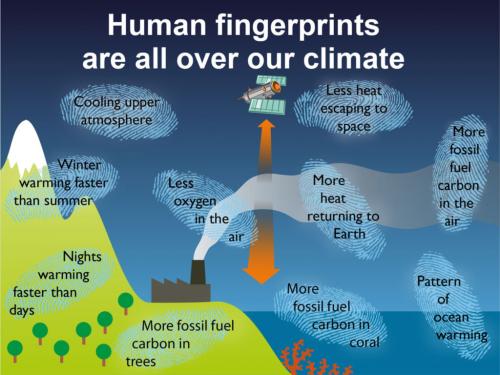
Fig. 1: human fingerprints on the crime-scene of climate change. Note several lines of evidence refer to 'fossil fuel carbon'. Now read on….

The answer lies in carbon isotopes.

Most chemical elements exist in nature as more than one version. These different versions are an element's isotopes. Carbon is no exception to the rule. Its most important natural isotopes are carbon 12, carbon 13 and carbon 14, written 12C, 13C and 14C. All three contain six protons in their atomic nuclei – that's carbon's atomic number and it's fixed. But carbon 12 atomic nuclei contain six neutrons whereas 13C has seven and 14C has eight.

Carbon 14 only occurs in tiny traces – about one atom per gram of carbon is a ballpark figure. It forms in nature through neutron bombardment of nitrogen atoms from cosmic rays near the top of our atmosphere. Man has had a hand here too: nuclear explosions also produce high-energy neutrons and the weapons-testing mania last century increased the amount of 14C by two orders of magnitude. The isotope is useful since it is radioactive and can be used to radiometrically date geologically young materials. Because its decay-rate is rapid (half-life of 5,700 years), anything more than about 50,000 years old is too 14C-depleted for radiocarbon dating. The fossil fuels, millions to hundreds of millions of years old, are devoid of 14C.

Carbon 12 is stable and very common, constituting 98.93% of all carbon on Earth, with carbon 13 making up the remainder, apart from the tiny amount of carbon 14. In that vital process of photosynthesis, carbon dioxide and water are absorbed by plants. These raw ingredients are converted into nutrients (sugar) and as a by-product, two thirds of their contained oxygen are released to the atmosphere, making it breathable by us and our fellow life-forms. The important bit is that during photosynthesis, carbon isotopes fractionate, meaning that the proportions of 12C and 13C are changed by the chemical reactions involved, with a preferential uptake of 12C in that sugar. So photosynthesis produces a shift in favour of 12C.

Any carbon-bearing sample – a bottle of oil, lump of coal, a piece of calcium carbonate such as limestone or a sea-shell, a flask of air - there are numerous examples – can be analysed and its carbon isotopic composition determined. Therefore, its ratio of 13C to 12C (known as delta or d13C) can be calculated and compared to an internationally-agreed standard composition. The equation is as follows:

delta 13C = ((13C/12C sample)/(13C/12C standard) -1) x 1000%

Now, because of that preferential take-up of 12C in plants, the d13C value, expressed in ‰, of anything derived from their decomposition, combustion, preservation or consumption will be similar. As such the smaller (or more negative) d13C value spreads up the food chain, gets preserved in coal, oil or gas deposits, in carbonate rocks like limestones and in shelly fossils.

It should come as no surprise, then, that if you dig up and set fire to fossil fuels, the CO2 emitted in that process will give the atmosphere a more negative d13C – and that's exactly what we find. If all the CO2 in the atmosphere was that outgassed by volcanoes, we would see d13C closer to zero; instead the ongoing trend is more and more negative; a cumulative plot from the Mauna Loa and South Pole air sampling stations (fig. 1) shows values of -7.5‰ in 1980, heading steadily downwards to -8.5‰ in 2020. The estimated pre-industrial value is around -6.6‰ (Graven et al. 2020). This is one smoking gun of man-made carbon dioxide emissions. Another is that because the fossil fuels are devoid of 14C, it follows that fossil fuel CO2 emissions are, too - thereby further diluting the already tiny amount of 14C in the atmosphere.

The carbon isotope record


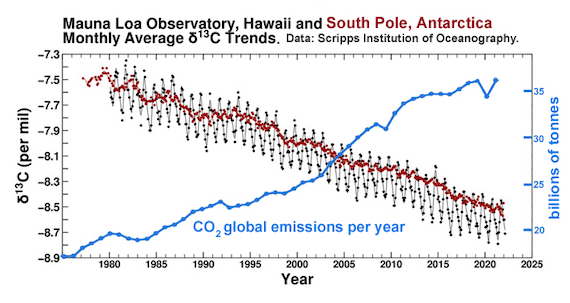
Fig. 1: the carbon isotope record, 1975-2022. Black Dots: Monthly average carbon isotope ratio (d13C) of atmospheric carbon dioxide at Mauna Loa Observatory, Hawai. As with the Keeling Curve of CO2 levels, the graph shows the seasonal wobble caused by photosynthetic plants as leaves grow and then die.Red Dots: Monthly average d13C of atmospheric carbon dioxide at the South Pole, Antarctica.

Carbon isotope ratios are also very useful in geology. Sudden changes in their values, known as positive or negative “excursions”, tell us something monumental has occurred. For example, one of the biggest negative d13C excursions in the geological record marks the end-Permian mass extinction, 250 million years ago (Saitoh & Isozaki 2021).

That one of the most prolonged and voluminous episodes of volcanism in the past 500 million years occurred at the same time as the end Permian mass extinction suggests a lot of CO2 was released back at the time. But volcanogenic CO2, originating in Earth's Mantle, has a “heavier” or more positive d13C of around -6‰. It cannot have caused the negative excursion, but one thing could. In the sedimentary basin through which the magma rose from deep in the Earth there were vast oil and coal deposits and they got comprehensively roasted in the process. It is estimated that as a consequence, the Siberian Traps eruptions released between ten trillion and one hundred trillion tons of carbon dioxide over just a few tens of thousands of years, some of volcanic origin but a heck of a lot from those cooked fossil fuel deposits. What happened in Siberia 250 million years ago thereby presents Mankind with its starkest possible warning about messing with Earth's carbon cycle.

Last updated on 2 July 2023 by John Mason. View Archives

Printable Version  |  Offline PDF Version  |  Link to this page

Argument Feedback

Please use this form to let us know about suggested updates to this rebuttal.

Further reading

Professor Scott Mandia has a detailed explanation of why more CO2 causes stratospheric cooling that is well worth a read.

Denial101x video

Here is a related lecture-video from Denial101x - Making Sense of Climate Science Denial

Comments

1  2  3  4  5  Next

Comments 1 to 25 out of 114:

  1. What about stratospheric cooling? An increasing greenhouse effect means the surface and the troposphere should be warming, but the stratosphere should be cooling (because the troposphere is trapping more heat and stopping it from reaching the stratosphere). Satellite and weather balloon measurements indeed show a cooling trend in the stratosphere, the opposite of what would be expected if the Sun was causing global warming. And it looks like it isn’t caused by ozone depletion either.
  2. It seems very strange that the big umbrella arguments (“It’s not happening”, “It’s not us”, etc) are so far down the list. Why don’t all the instances of each sub-argument count towards the tally of its parent?
    Response: Initially when I submitted skeptic articles, I did include the umbrella arguments but I stopped doing it fairly early on - was just a bit tedious and I decided to focus on the specific argument being made. If anything, over time, I've even been dividing sub-arguments into sub-sub-arguments and getting narrower with the focus.

    I think I prefer this way - otherwise "It's not happening" and "It's not us" will be #1 and #2 which is a bit too general for my liking.
  3. I covered the stratosphere and other upper atmospheric layer cooling in the Advanced rebuttal, James.
  4. Will somebody please post a link to a paper that concludes that an increased greenhouse effect should increase Tmin faster than Tmax. That claim is NOT supported by the papers that are posted here. Instead the papers that are used as references either A) Don't attempt to attribute DTR changes or B) They attribute DTR changes to clouds, aerosols, or land surface changes. e.g Paragraph 15 of the paper cited above Braganza, K., D. J. Karoly, and J. M. Arblaster (2004), Diurnal temperature range as an index of global climate change during the twentieth century, Geophys. Res. Lett., 31
  5. Ptbrown31, the shrinking differential between day/night temperatures is entirely implicit in the mechanism of GHGs. You might ask yourself, how could it not be true that more "efficient" concentrations of GHGs in the atmosphere could leave evening temperatures unchanged? As to finding papers, you'll find plenty of links by via : Google Scholar
  6. doug_bostrom "You might ask yourself, how could it not be true that more "efficient" concentrations of GHGs in the atmosphere could leave evening temperatures unchanged?" Of course I am not implying that increased greenhouse gasses would leave evening temperatures unchanged I am implying that I do not think that there is an obvious reason that an increased greenhouse effect should increase evening temperature MORE than daytime temperatures. The Earth emits LW radiation at all times of day and in fact it emits MORE LW radiation during the day. So why is it "entirely implicit in the mechanism of GHGs"? Furthermore, I have indeed looked for papers in various search engines and I have consistently found that the literature attributes the changes in DTR to changes in one of a) clouds b) aerosols or c) land albedo. Here is another example: Stone, D. A., and A. J. Weaver (2002), Daily maximum and minimum temperature trends in a climate model, Geophys. Res. Lett., 29(9), 1356, doi:10.1029/2001GL014556. ABSTRACT: The recent observed global warming trend over land has been characterised by a faster warming at night, leading to a considerable decrease in the diurnal temperature range (DTR). Analysis of simulations of a climate model including observed increases in greenhouse gases and sulphate aerosols reveals a similar trend in the DTR of −0.2°C per century, albeit of smaller magnitude than the observed −0.8°C per century. This trend in the model simulations is related to changes in cloud cover and soil moisture. These results indicate that the observed decrease in the DTR could be a signal of anthropogenic forcing of recent climate change.
  7. 1. Humans are currently emitting around 30 billion tonnes of CO2 into the atmosphere. Check 2. Oxygen levels are falling as if carbon is being burned to create carbon dioxide. OK 3. Fossil carbon is building up in the atmosphere. (We know this because the two types of carbon have different chemical properties.) OK 4. Corals show that fossil carbon has recently risen sharply. I get it. 5. Satellites measure less heat escaping to space at the precise wavelengths which CO2 absorbs. Makes sense. Are they also checking to see if the waves that water vapor blocks are escaping less/more? 6. Surface measurements find this heat is returning to Earth to warm the surface. Duh 7. An increased greenhouse effect would make nights warm faster than days, and this is what has been observed. Pretty much the norm for warmer periods. More water vapor available does the same thing. We had a warm period this summer that was all about higher nighttime temps. We also had some of the the highest ever average dewpoints. 8. If the warming is due to solar activity, then the upper atmosphere (the stratosphere) should warm along with the rest of the atmosphere. But if the warming is due to the greenhouse effect, the stratosphere should cool because of the heat being trapped in the lower atmosphere (the troposphere). Satellite measurements show that the stratosphere is cooling. OK 9. This combination of a warming troposphere and cooling stratosphere should cause the tropopause, which separates them, to rise. This has also been observed. OK 10. It was predicted that the ionosphere would shrink, and it is indeed shrinking. OK again, now let's go back into the models and try it with water vapor.
    Response: Regarding 5, yes, they are checking to see if the waves that water vapor blocks are escaping less/more. Regarding your "now let's go back into the models and try it with water vapor": The models most certainly do already include water vapor. See Water Vapor Is The Most Powerful Greenhouse Gas, and then Humidity Is Falling. [fixed broken link]
  8. > fossil carbon ... we know this ... > the two types of carbon have > different chemical properties. Erm, well, that's not how; isotopes can behave slightly differently in chemical reactions, but http://www.realclimate.org/index.php/archives/2004/12/how-do-we-know-that-recent-cosub2sub-increases-are-due-to-human-activities-updated/
  9. Continuing a reply to a comment here. "if one presupposes that human activity in some way affects the temperature of the Earth" Let's think of some things that human activity affects that we might agree on. I won't bother to provide citations for these things; you can find them quite easily if you want: a. ozone - remember that 'hole' that we could close by restricting CFC use? b. smog - air pollution controls have successfully reduced smog problems (caused in part by auto exhaust) in Los Angeles. Look also at successful pollution controls in central Europe put in place in the early 90s. c. acid rain - caused by SO2 emissions from industrial activity, reduced by scrubbers. d. dust clouds/storms - over farming in the US dust bowl; coal-fired power plants and urban pollution in Asia. e. CO2 -- there are a lot of studies measuring 'urban CO2 domes' that are directly tied to daily, weekly and seasonal traffic patterns. Of course, there is all that annual CO2 input from fossil fuel consumption. f. clouds - we know how to 'seed' clouds and make rain, at least in limited areas. How many of these human activities 'affect the temperature of the Earth' in some way? Some might say they all do. Here's what the experts say (I've quoted this a number of times and will continue quoting it wherever necessary until John says enough): Weather in a given region occurs in such a complex and unstable environment, driven by such a multitude of factors, that no single weather event can be pinned solely on climate change. In that sense, it's correct to say that the Moscow heat wave was not caused by climate change. However, if one frames the question slightly differently: "Would an event like the Moscow heat wave have occurred if carbon dioxide levels had remained at pre-industrial levels," the answer, Hansen asserts, is clear: "Almost certainly not." The frequency of extreme warm anomalies increases disproportionately as global temperature rises. "Were global temperature not increasing, the chance of an extreme heat wave such as the one Moscow experienced, though not impossible, would be small," Hansen says.
  10. I read that most of the CO2 from fuel emissions is located at the upper reaches of the troposphere. Is that true? If it is true, how can claims be made that the extra CO2 is causing faster plant growth? thanks if you have any links for this. Gail
  11. #10: "located at the upper reaches of the troposphere." That seems unlikely as the increasing concentrations are measured at surface stations with a wide variety of elevations, notably Mauna Loa at 3400 m. But it would be helpful to know where you read that, because I've seen everything from 'they are well-mixed' to 'they are at highest concentrations near the surface'.
  12. I read this: "The second problem is that the excess CO2 in question is located at the top of the lower troposphere where it does not nourish any plants." Which was based on this: http://www.realclimate.org/index.php/archives/2007/06/a-saturated-gassy-argument/ But I think this was my misinterpretation. It's the "CO2 in question" meaning, the CO2 that contributes to heating, not "most' of the CO2. "Among other things, the new studies showed that in the frigid and rarified upper atmosphere where the crucial infrared absorption takes place, the nature of the absorption is different from what scientists had assumed from the old sea-level measurements" thanks.
  13. #12: "the excess CO2 in question is located at the top of the lower troposphere" I can't find that particular line in the excellent RC article you reference. That article deals with CO2 effect saturation, a topic addressed here on SkS.
  14. From a comment here. "industrial aerosol emissions are mitigated somewhat during the last three decades. Therefore the actual climate sensitivity to carbon dioxide should be considerably less" Not sure why you're mixing your aerosols with your CO2 sensitivity. But if, by mitigated, do you mean that the ongoing increase in the magnitude of annual CO2 emissions of +0.67 Gtons/year worldwide somehow indicates a slowdown?
  15. #13 muoncounter at 11:33 AM on 30 December, 2010 Not sure why you're mixing your aerosols with your CO2 sensitivity. If you gave a thought to it, you'd be absolutely sure. BTW, the other thread is continued here.
  16. You can't average temperature readings (impossible due to physics) so can't really prove temperatures are increasing. We simply do not know enough to make extreme statements that changes are the result of humans- the total Earth weather system(s) has only studied intensively for 40 years compared to the Earth existing for 30+ million years so only 4 "fingerprints" are real evidence. The rest are changes.
    Response: [Daniel Bailey] You have me at a loss for what to say (and that never happens). All I can say is that you are not even wrong. I recommend that you start here, then go see the big picture, then top it off with a proper demonstration on how to compare temperature records.
  17. cloa513, could you provide more details of the difficulties due to physics, relating to average temperature readings. Also, what makes you state that the earth has existed for "30+ million years" ? Why not write '4.5+ billion years' - the reality ? Do you think it is nearer to 30 million years old ?
  18. @cloa513: "You can't average temperature readings" Sure you can.
  19. #16: "the total Earth weather system(s) has only studied intensively for 40 years compared" Wow. Aside from being factually incorrect (weather and indeed climate science is more than 40 years old): We've only gone into space since the '60s, not even a mere 50 years. So by your illogic, we cannot know anything about what happened before we went into space? However, moon rocks are much older than even '30+ million years' (try 3.5 Byears). We study those moon rocks, as we study signals in the universe that are almost as old as the universe itself! Please, for your own self-respect if nothing else, stop making statements things like that.
  20. I find your knock-down attributions of warming to anthropogenic causes less than convincing. Perhaps you could clarify a couple of things? 1. More fossil fuel carbon in the air. Presumably you mean 'more light isotope carbon in the air'. How is this light carbon attributed to human emissions? It is trivially easy to think of other causes of a 12C signal -- disruptions of the biosphere will alter the flux of isotopes and change the absolute values, a minute warming will enable methanophages to devour clathrates which have been building up for millennia. Etc -- if I remember correctly I found five possible changes which could give this signal - six if you count the burning of fossil fuels. So, without post hoc ergo propter hoc reasoning, how do we know that the signal is anthropogenic? 2. Fossil fuel carbon in coral. I have the same objection to this one: there is a light carbon signal. How do you assign it to fossil fuel burning? 3. Less oxygen in the air. Well, the methanophages would cause that, as would a major disruption of C-fixing, oxygen-producing plankton. There has been a fall in plankton population of 40% in the last seventy years. Does it not seem more reasonable that oxygen use by civilisation is dwarfed by the huge fluxes found in nature? Having seen a flow diagram of CO2 with an uncertainty of +- 70 Gt in the value of export to deep ocean reservoirs, my take on the whole affair is that we are like a little boy peeing into a reservoir during a cloudburst and worrying about whether we will cause the dam to burst. It's warming. CO2 levels are rising. Attribution please. Your assertions above do not reach the standard of proof. Julian Flood
    Response: [Daniel Bailey] Here's a recent study with data you can download & play with, so you can see for yourself.
  21. Julian Flood@20 Are you questioning the attribution of the observed rise in atmospheric CO2 to anthropogenic emissions? If so, you don't need isotopic arguments to establish that the attribution is correct. The principle of conservation of mass requires that if both man and the natural environment are carbon sources (i.e. emissions exceed uptake) then the annual increase in atmospheric CO2 must be greater than anthropogenic emissions (our uptake is negligible), as it is the sum of the net anthropogenic and natural contributions. This is observed not to be the case, atmospheric CO2 is rising at a rate about 45% of anthropogenic emissions, so the natural environment must be a net sink, and hence is not causing the observed rise. That particular piece of attribution is rock solid. The fact that the long term rise in atmospheric CO2 has been steady at 45% of anthropogenic emissions would be abit of a coincidence if the observed rise were natural and nothing to do with us!
  22. Dikran Marsupial at 06:52 AM on 30 January, 2011 wrote quote Julian Flood@20 Are you questioning the attribution of the observed rise in atmospheric CO2 to anthropogenic emissions? If so, you don't need isotopic arguments to establish that the attribution is correct. The principle of conservation of mass requires that if both man and the natural environment are carbon sources (i.e. emissions exceed uptake) then the annual increase in atmospheric CO2 must be greater than anthropogenic emissions (our uptake is negligible), as it is the sum of the net anthropogenic and natural contributions. This is observed not to be the case, atmospheric CO2 is rising at a rate about 45% of anthropogenic emissions, so the natural environment must be a net sink, and hence is not causing the observed rise. That particular piece of attribution is rock solid. unquote I'm afraid you'll have to go through the logic of your case in baby steps, as to me they don't make sense. If the world had only two agents working on CO2 production and sequestration then perhaps you would have a point. However, this is not the case. Just take, for example, the biology of the oceans: numbers of phytoplankton vary as nutrient flows (run-off from land, deep current upwelling, wind-mediated stirring of the top few hundred feet of the oceans, volcanic rain-down, seasonal changes etc etc) and this will change the amount of CO2 pulled down and/or the amount of CO2 given off. So to do your calculation of 'mass balance' you need to know the figures for all of these. Further, and more importantly, you need to know the amount going into and coming out of the biggest reservoir of CO2, the deep ocean. I think the figures you are using for your mass balance are dwarfed by the uncertainties in the figures for all of the above. To illustrate: human emissions go up by X, deep ocean export swings up by 99X, sequestration by phytoplankton goes up by 99.55X. Net increase, .45X. Now add error bars to those figures -- plus or minus 70 Gt. 70! So you don't know the numbers within something like 10X and you're calculating to decimal places. And from this you can claim that it's all the fault of the little boy piddling in the reservoir? I must be misunderstanding something basic. Please explain again a different way and I'll try and follow the logic better. quote The fact that the long term rise in atmospheric CO2 has been steady at 45% of anthropogenic emissions would be a bit of a coincidence if the observed rise were natural and nothing to do with us! unquote So Zog, when he picked up his first bit of seacoal and threw on his fire, altered the CO2 content of the atmosphere by 45% of the C in that coal? You know that bit in Borat where he looks at someone with disbelief? Picture me like that. How does the process know to only sequester 45% of the extra, and how does it distinguish that 45% blip from all the other processes which are not steady state but which vary with the season, run-off etc. What, in other words, is the _mechanism_? TIA JF (thanks for isotope data. I think the same error is being made here as in the mass balance argument, that there is a steady state in the isotopic composition of the pull down -- just adding a little dissolved silica to the oceans will invalidate that assumption.)
  23. Julian@Flood@22 The mass balance argument does not need to make any assumption about the carbon cycle other than conservation of mass (of carbon), neither does it depend on any knowledge of the individual fluxes into and out of the atmosphere. The diagram below shows annual anthropogenic emissions (for which we have good records), the annual increase in atmospheric CO2 (for which we have accurate records, in this case Mauna Loa), and the difference between total natural emissions and total natural uptake, which can be inferred from anthropogenic emissions and atmospheric increase assuming conservation of mass. For conservation of mass, we know that dC = E_a + E_n - U_n where dC is the annual change in atmospheric CO2, E_a is anthropogenic emissions, E_n is "natural" emissions and U_n is "natural" uptake. Of these, we can directly measure dC and E_a, so rearranging, we have E_n - U_n = dC - E_a This is the green line, which gives total net emissions into the atmosphere from all natural sources (including soil respiration). As you can see, it is always negative, demonstrating that the natural environment is a net sink, and is hence opposing the atmospheric rise, not causing it. The data is shown here it can all be downloaded from the Carbon Dioxide Information Analysis Center CDIAC, the specific datasets you need are: anthropogenic emissionshere and Mauna Loa data here. Note that the error bars on the inferred natural net sink depends on the uncertainty in anthropogenic emissions and measurements of atmoispheric CO2, both of which are small. The bottom line is that the annual rise in atmospheric carbon is the sum of anthropogenic emissions, natural emissions (whatever the mechanism) minus natural uptake (whatever the mechanism). If the annual rise is less that anthropogenic emissions, then the only way that can happen is for natural uptake to excede natural emissions.
  24. Julian@Flood@22 wrote "How does the process know to only sequester 45% of the extra, and how does it distinguish that 45% blip from all the other processes which are not steady state but which vary with the season, run-off etc. What, in other words, is the _mechanism_?" It stems from the fluxes of carbon between reservoirs being proportional to the atmospheric concentration and the fact that emissions are rising approximately exponential. The carbon cycle is a dynamical system, which can be described by linear differential equations. If you apply exponential forcing to such linear D.E.s you get an exponential result (with the same rate constant). As both exponentials have the same rate constant, their ratio is constant. I did the D.E.s myself last year to satisfy myself that a constant airborne fraction is what you would expect for an anthropogenic origin, and indeed it is.
  25. I've seen the balance argument before and I find it makes me uneasy, not least because there are assumptions unspecified. U_n and E_n may both vary, for example, depending on total emissions and e.g. pollution. Could you follow my logic below and point out how it is in error? Mostly I just follow your reasoning, simply adding an unknown additional input. Civilisation emits CO2 from the burning of fossil fuels, disrupts the natural mechanisms by which uptake occurs and may also cause an increase in 'natural' emissions -- deforestation, methane consumption in permafrost by bacteria as acid rain effects wear off, etc etc. The loss of uptake and the increase in emissions can be lumped together into a single figure, the equivalent of an emission increase(of positive or negative sign), which we will call indirect anthropogenic emissions. We have, for the purposes of my argument, no knowledge of the size or isotopic composition of indirect anthropogenic emissions. The size also seems to be internally unconstrained as U_n, E_n and E_ua may cancel each other out. For conservation of mass, we know that dC = (E_a +E_ua) + E_n - U_n where dC is the annual change in atmospheric CO2, E_a is fossil fuel emissions, E_ua is indirect anthropogenic emissions, E_n is "natural" emissions, and U_n is "natural" uptake. Of these, we can directly measure only dC and E_a. Rearranging, we have E_n - U_n = dC - (E_ua +E_a) Now, we know that the level of atmospheric CO2 is not rising as fast as it would if all the fossil fuel emissions were causing the rise, let alone including the indirect emissions. So the natural environment is a net sink and the increase in atmospheric CO2 must be due to (E_ua + E_a). It would seem likely that the sinks will treat E_a and E_ua in the same way, and atmospheric CO2 will therefore contain a proportional amount from each. Question: does the isotopic composition of the dC indicate that the the fossil fuel CO2 addition U_a is sufficient to explain the change in 12C amount, or does the 12C proportion indicate another source of CO2 which is rich or depleted in 12C? It is unlikely that the isotopic proportions of E_ua would match E_a and it may be that a mismatch can give us some indication that there is more going on than your first explanation suggests. I will think about your second post and the explanation there. Are there any papers on this? The difficulty of applying atmospheric CO2 levels to the export from upper to deep ocean reservoirs I would have thought precluded this sort of analysis, but presumably someone must have overcome this. JF

1  2  3  4  5  Next

Post a Comment

Political, off-topic or ad hominem comments will be deleted. Comments Policy...

You need to be logged in to post a comment. Login via the left margin or if you're new, register here.

Link to this page


The Consensus Project Website

THE ESCALATOR

(free to republish)


© Copyright 2024 John Cook
Home | Translations | About Us | Privacy | Contact Us