Climate Science Glossary

Term Lookup

Enter a term in the search box to find its definition.

Settings

Use the controls in the far right panel to increase or decrease the number of terms automatically displayed (or to completely turn that feature off).

Term Lookup

Settings


All IPCC definitions taken from Climate Change 2007: The Physical Science Basis. Working Group I Contribution to the Fourth Assessment Report of the Intergovernmental Panel on Climate Change, Annex I, Glossary, pp. 941-954. Cambridge University Press.

Home Arguments Software Resources Comments The Consensus Project Translations About Support

Twitter Facebook YouTube Mastodon MeWe

RSS Posts RSS Comments Email Subscribe


Climate's changed before
It's the sun
It's not bad
There is no consensus
It's cooling
Models are unreliable
Temp record is unreliable
Animals and plants can adapt
It hasn't warmed since 1998
Antarctica is gaining ice
View All Arguments...


Username
Password
New? Register here
Forgot your password?

Latest Posts

Archives

Did global warming stop in 1998, 1995, 2002, 2007, 2010?

What the science says...

Select a level... Basic Intermediate

Global temperatures continue to rise steadily beneath the short-term noise.

Climate Myth...

Global warming stopped in 1998, 1995, 2002, 2007, 2010, ????

"January 2008 capped a 12 month period of global temperature drops on all of the major well respected indicators. HadCRUT, RSS, UAH, and GISS global temperature sets all show sharp drops in the last year" (source: Watts Up With That).

A common claim amongst climate skeptics is that the Earth has been cooling recently. 1998 was the first year claimed by skeptics for 'Global Cooling'. Then 1995 followed by 2002. Skeptics have also emphasized the year 2007-2008 and most recently the last half of 2010.

NASA and climate scientists throughout the world have said, however, that the years starting since 1998 have been the hottest in all recorded temperature history. Do these claims sound confusing and contradictory? Has the Earth been cooling, lately?

To find out whether there is actually a 'cooling trend,' it is important to consider all of these claims as a whole, since they follow the same pattern. In making these claims, skeptics cherrypick short periods of time, usually about 20 years or less.

The temperature chart below is based on information acquired from NASA heat sensing satellites. It covers a 30 year period from January 1979 to November 2010. The red curve indicates the average temperature throughout the entire Earth.

The red line represents the average temperature. The top of the curves are warmer years caused by El Niño; a weather phenomenon where the Pacific Ocean gives out heat thus warming the Earth. The bottoms of the curves are usually La Niña years which cool the Earth. Volcanic eruptions, like Mount Pinatubo in 1991 will also cool the Earth over short time frames of 2-3 years.
UAH
Figure 1: University of Alabama, Huntsville (UAH) temperature chart from January 1979 to November 2010. This chart is shown with no trend lines so the viewer may make his own judgment.

Below is the same temperature chart, showing how skeptics manipulate the data to give the impression of 'Global Cooling'. First they choose the warmest most recent year they can find. Then, in this case, they exclude 20 years of previous temperature records. Next they draw a line from the warmest year (the high peak) to the lowest La Niña they can find. In doing this they falsely give the impression that an ordinary La Niña is actually a cooling trend.

UAH

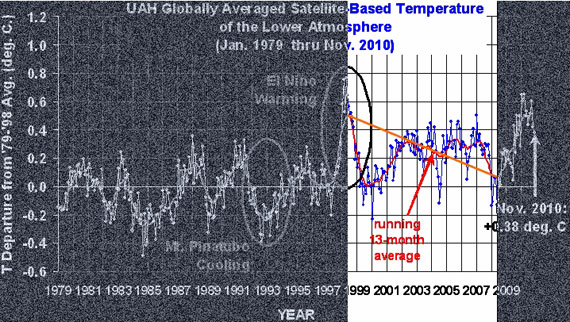
Figure 2: Representation of how skeptics distort the temperature chart. Even though the chart clearly indicates increased warming, skeptics take small portions of out of context to claim the opposite.

What do the past 30 years of temperature data really show? Below is the answer.

UAH

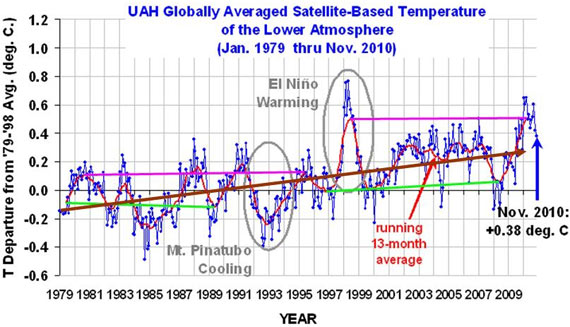
Figure 3: Trend lines showing the sudden jump in temperatures in the 1995 La Niña (Green lines) and the 1998 (Pink lines) El Niño events. Brown line indicates overall increase in temperatures.

The chart above clearly shows that temperatures have gone up.  When temperatures for the warm El Niño years (pink lines) during 1980-1995 are compared to 1998-2010, there is a sudden increase of at least 0.2o Centigrade (0.36o Fahrenheit). Temperatures also jumped up by about 0.15oC (0.27oF) between the cool La Niña years (Green lines) of 1979-1989 and those of 1996-2008 (the eruption of Mount Pinatubo in 1991 lowered the Earth's temperatures in the midst of an El Niño cycle). The overall trend from 1979 through November 2010 (Brown line) shows an unmistakable rise.

This is particularly clear when we statistically remove the short-term influences from the temperature record, as Kevin C did here:

In spite of these facts, skeptics simply keep changing their dates for 'Global Cooling', constantly confusing short-term noise and long-term trends (Figure 4).

Escalator

Figure 4: Average of NASA GISS, NOAA NCDC, and HadCRUT4 monthly global surface temperature anomalies from January 1970 through November 2012 (green) with linear trends applied to the timeframes Jan '70 - Oct '77, Apr '77 - Dec '86, Sep '87 - Nov '96, Jun '97 - Dec '02, and Nov '02 - Nov '12.

 Basic rebuttal written by dana1981


Update July 2015:

Here is a related lecture-video from Denial101x - Making Sense of Climate Science Denial


Last updated on 7 September 2017 by MichaelK. View Archives

Printable Version  |  Offline PDF Version  |  Link to this page

Argument Feedback

Please use this form to let us know about suggested updates to this rebuttal.

Comments

Prev  1  2  3  4  5  Next

Comments 26 to 50 out of 101:

  1. Re #24: That's incorrect. The overall trend of the last 5 million years has been a mildly cooling one. Re #21 There's no such thing as "normal" temperature in relation to the Earth. The Earth is on a journey through time, and it's properties (atmosphere, temperature, biosphere, geology and so on) evolve according to a whole range of intrinsic and extrinsic factors. For human kind and the current biosphere, "normal" only really has a meaning in relation to evolutionary adaptedness. The biosphere in its current state is adapted (i) to the relatively cool period of the last several million years, and (ii) to a world with rather more continuous and connected environments that has, until the recent past, allowed migration as a fundamental means of adapting to climate change.
  2. "Alternatively, Camp 2007 adopts an empirical approach to calculate solar influence on global temperature. He determines the solar cycle contributes 0.18°C cooling to global temperatures as the sun moves from maximum to minimum. Employing back of a napkin calculations, TSI would need to fall roughly 4.3 W/m2 to provide 0.6°C of cooling." Isn't this what the graph shows? Lows of around 1360.25 to highs of 1363.5...roughly 3.25W/m2 or around .45C of cooling?
  3. Re #27 Not really Mizimi. Remember that the effect of a forcing (whether a warming or a cooling forcing) relates to the temperature change at equilibrium.... ...at equilibrium... Note two things about the influence of the solar cycle on the Earth's temperature response: (i) the solar cycle has a rather rapid sinusoidal variation. The entire cycle takes only 11 years to evolve from its maximum TSI to its minimum TSI and back again (ii) The Earth's surface temperature response is damped, and it comes to equilibrium much more slowly than the few years "allowed" for it to "track" the solar cycle variation. So the tracking of the Earth's temperature response to the solar cycle is continuously "frustrated" (very much like the temperature response to a thermostat). The atmosphere follows the solar cycle most faithfully. The ocean and land surface is much slower to respond. So the effects of the solar cycle is damped, and the entire effect of the solar cycle is to contribute around 0.1 oC of temperature difference at the Earth's surface, between the solar maximum and solar minimum (Tung considers that the solar cycle contribution is a bit larger...around 0.18 oC). If the solar cycle were to stop and the sun emit solar radiation equivalent to 1363.5 W/m2 for a long period (say 30 years to come close to equilibrium)...and then the sun switched to a constant TSI output equivalent to 1360.25 W/m2 for 30 years to establish the new equilibrium temperature, the temperature difference at the Earth's surface would be your 0.45-ish oC of cooling (all else being equal). ..but these temperature changes in response to forcings are equilibrium changes..
  4. Chris, I'm not sure I accept your view of solar cycle 'damping'. The annual response to orbital & axis fluctuations (which are basically the same as increasing/decreasing TSI) is quite rapid, even for large masses of water. I live on the coast and the seasonal fluctuation in sea temp is quite pronounced and predictable...peaking at around 27C and dropping to around 17C in the summer/winter cycle. These seasonal fluctuations are much greater than the solar cycle and I suspect the small warming of the solar cycle gets overshadowed somewhat rather than retarded.
  5. Yes there's no doubt that the effects of the solar cycle are "overshadowed" by internal variations in the climate system. After all the peak to trough surface temperature variation between the solar cycle max and min is around 0.1 (maybe as much as 0.18) oC. Since year on year variation in the Earth's temperature anomaly can easily be 0.1 oC, the solar cycle doesn't really show up in the surface temperature record without efforts to deconvolute this. In general we expect the sun to contribute a little cooling during the solar minimum and a little warming (supplementing greenhouse gas warming) around the solar max. But just like the damped solar cycle contribution to the Earth's surface temperature, so the seasonal temperature variation is damped. For example if, rather than a seasonal drop in insolation where you live, the sun changed its output to give a constant insolation corrsponding to the cold season insolation, the water in the sea where you live would get a whole lot colder than 17 oC. But it would take a while for this new horribly cold temperature to settle at a new chilly equilibrium temperature.....
  6. "The Eastern U.S. Keeps Its Cool While The World Warms" ScienceDaily (Jan. 31, 2001) — Much of the Earth has warmed over the last half-century, but the eastern half of the United States has shown a cooling trend. NASA-funded research indicates cooler temperatures in the eastern U.S. are caused by an increase in sun-shielding clouds produced by warmer ocean temperatures in the Pacific.
  7. But naturally, local observations are much better than instrument readings (it only took 30 years to catch up with what we all already knew). Next they can explain the cooler temps in southern CA.
  8. I'm very new here but can you tell me if in fact the cooling referred to at the start of this post "2007's dramatic cooling is driven by La Nina which historically has caused similar drops in global temperature and should recede in mid-2008" actually happened? I find it difficult to reconcile the various conflicting opinions but it seems the prediction that warming would recommence in mid 2008 is not borne out by reality as 2008 was overall quite cool. Was the prediction that warming would start again in mid 2008 from computer models? If so it seems to reinforce the findings that modeling predictions don't agree with the subsequent actuality..
  9. Re #33 IRL: Yes, the cooling was confined pretty much to the first half of the year. You can assess this by inspecting the monthly-averaged temperature anomalies. Here's the UK Hadcrut3 global temperature analysis: http://www.cru.uea.ac.uk/cru/data/temperature/crutem3gl.txt The temperatures in early 2008 through May were highly suppressed (except oddly for March). Temperatures recovered in the second half of the year so that the last half of 2008 was as warm as the second half of 2007. And 2007 was one of the top three warmest years on record. Overall 2008 will be cooler due to the cold start. Despite that it's one of the top 10 warmest years on record. The prediction that warming would start again in mid 2008 was not a prediction from computer models. It was a prediction based on our basic understanding of the Earth's temperature response to rising greenhouse gas forcing, our understanding of the temporal evolution of La Nina events and so on...
  10. It is my understanding that methane traps heat only while forming its hydrate and can hold up to 400 degrees F in each and every molecule and its ignition continues without melting the ice which it encompasses. Is there not a serious threat from these hydrates both in the warming deep sea and permafrost that would contribute to global warming since methane hydrate is 20 to 30 times more dangerous as an absorber of heat than CO2? Is it likely that this coming Spring, as it warms and the hydrates that have formed during the winter start fighting to survive the warmer weather, they will dissociate especially in Russian, Canadian and Scandanavian permafrost?
  11. #35 https://www.llnl.gov/str/Durham.html gives a brief outline of methane hydrate properties which are totally different to methane gas - which I suspect you are confusing it with.
  12. I am confused. Watts claims that there has been cooling and you suggest to attack that but all you do is explain that cooling and so confirm it. Also that prediction that cooling would end somewhere in 2008, did that come true? And as for the sun. I am just a journalist, but professor Kees de Jager from the Netherlands has recently published about this in a peer reviewed journal. He still thinks that the larger part of the warming from the past century can be explained by the sun. See: http://www.cdejager.com/sun-earth-publications/ His cv may be interesting as well: http://www.cdejager.com/about/ Cheers, Theo Richel
    Response: There's no denying there's been cooling in the last few years - that's an observed, empirical fact. What needs to be done is understand the cooling in the broader context. The earth has an energy imbalance. More energy is coming in than is coming out. The planet is gradually accumulating heat and hence showing a long term warm trend. But superimposed on this long term trend is short term fluctuations such as the El Nino pattern and solar cycle. Both of these cycles are in strong cooling phases at the same time - a cooling perfect storm if you will.

    Re cooling subsiding in 2008, La Nina did subside and then flipped right back into strong La Nina conditions again (see graph in the next comment). Thus demonstrating the difficulties in predicting short term ocean cycle variability.

    As for the sun, many peer reviewed papers examine the link between sun and climate. They all note that the sun has showed little to no trend since the 1950's and hence has had a minimal contribution to global warming over the past 4 decades.
  13. I second Theo's question - is there updated information available on the most recent temperature trends and whether La Niña has been receding in the last year (since mid-2008, that is). Does anyone have any current information indicating one way or another?
    Response: Southern Oscillation Index monthly data is available at the Australian Bureau of Meteorology while monthly global temperature anomaly is available at NASA GISS. Here's a graph of the updated data:

  14. Hi, to evrybody. I'm new on this 'very-well-done' site. I'm italian and not a great english speaker/writer, but I'm sure you fine people will forgive me. I just want post a question on this arcticle. I read in it that to cause a chute of 0.6 degrees it need a 13 W/m2 fall of TSI. OK, so far so good. This other article say "The correlation between sun and climate ended in the 70's when the modern global warming trend began." So, if i understand, before 1970 the sun was the cause of climate variation. And in the graph i see that (before 1970) a variation of less than 1 W/m2 causes a temparature increasing of almost 0.4 degrees. It is not that a contradiction? I'm sure i'm missing something... Thanks
    Response:

    The sun was not necessarily the primary cause of climate variation before 1970. In fact, the forcing from solar variation is not particularly large. The breakdown in correlation is just to show that the sun cannot be the cause of global warming in the last few decades.

  15. Another possibility that in effect alters TSI is albedo. The earth's albedo is not constant and is dominated by cloud cover. Increased cloud can warm or cool the earth depending on the type and altitude. More high level cloud increases the albedo but traps more heat resulting in warming. More mid-low level cloud increases albedo but relects more radiation causing cooling. Goode & Palle (2007) suggest small changes in albedo produce changes in radiation levels over twice as high as GHGs. Charting albedo from 1985 to 2004 shows an interesting correlation to GMT. Albedo declines some 3% from 1984 to 1995 and drops fast (by another 8%) between 1995 to 1998 where it is at a minimum.....and 1988 was of course a very warm year. Since then the albedo has increased ( albeit hesitantly)by 4% up to 2004, which is possibly a major factor in the present downtrend in GMT. http://bbso.njit.edu/Research/EarthShine/literature/Goode_Palle_2007_JASTP.pdf
  16. That should have been '1998 was of course a very warm year'
  17. I would like to draw attention to the non-averaged version of the TSI graph used in this article, avaliable here: http://lasp.colorado.edu/sorce/images/instruments/tim/tsi_database.jpg Note that the TIM data is 4-5Wm(-2) below other instruments, and the averaged version of the graph has lowered previous records to match the TIM data. TSI is not a settled matter. The graph used on this page would be better used to demonstrate the solar cycle argument, where the image is slightly out of date (2000)
  18. All the of the global temperature metrics, GISS, UAH, HadCrut etc say that temperature rises are NOT being balanced out, and overall temperatures are rising. As to whether current sea-level rises matches the current level of ice loss, the water budget seems to be closed quite well. eg Willis
  19. Continued from comment here by Norman. "The interesting thing about the GISS anomaly map above is the choise of base=line (1951-1980). This was a relatively cooler period of time and to use that to show Arctic warming may distort what has recently been going on. I went to the GISS page ... GISS Arctic temp map using 2000-2010 as the baseline. " A baseline needs to be a long time period -- its supposed to represent an average condition, so that anomalies are relative to that average. Your 10 year baseline doesn't accomplish that. It is interesting to choose an historically relevant baseline and look at the relative anomalies. Prior to 1946, carbon emissions were increasing at a steady rate; however, after WW2, carbon emission rates exploded. So much so that the cumulative CO2 emissions from fossil fuels after WW2 virtually eclipses all CO2 emissions in the prior 150+ years (you can verify this with data and graphics readily available at CDIAC). So 1900-1946 is a relevant baseline period. Here is the anomaly for 1970-1980. Here is the 1980-1990 anomaly. Fast forward, here is the 2000-2010 anomaly. Look at the numbers in the upper right hand corner, which are the estimated global means for the period mapped. It's obvious that warming rates dramatically increased in the '80s, nearly 4 decades after the rapid increase in CO2 emissions began. Considering that it takes time for the warming effect of CO2 to be fully realized (see the 40 year delay thread) that result is not surprising.
    Response: [DB] Your images aren't showing up anymore (and the links don't work so I no canna fix 'em). [mc] Aargh - should work now.
  20. New study about chinese aerosol/sulphur cooling effect during the 2000s : (Reconciling anthropogenic climate change with observed temperature 1998–2008) "Given the widely noted increase in the warming effects of rising greenhouse gas concentrations, it has been unclear why global surface temperatures did not rise between 1998 and 2008" Are they aware of the exceptionnaly warm 1998-niño-year flaw in their decadal trend ?
  21. Papy - Yes, they are not great communicators. I've had a wee to-and-fro with other SkS authors over that point, but regardless it seems a useful attempt to understand recent variability in the climate. And no global warming didn't stop, just like it hasn't throughout the instrumental records - all of them If Kaufmann and co-author's findings are validated by other research, it's not good news. Sulfate aerosols have a short atmospheric lifetime, and when the Chinese stop pumping out all that extra sulfate pollution, it's going to unleash some warming. And yes they have to at some point, for health reasons and to prevent Ocean Acidification.
  22. I agree and I don't contest its interest, but the presentation (title/abstract) of the study sounds like a communication deal to me, like if they were perfectly aware of their decadal flaw (part of the answer about this apparent stagnation is in the question), but made this deliberated choice to promote their work... and some media titles confirm this feeling : "Chinese coal pollution halted global warming !". Thanks for your answer anyway.
  23. No worries Papy. I'm just finishing up a post on Kaufmann 2011 - let's say my take is a bit different.
  24. You know that stuff that ain't happenin'? Still ain't: [Source] Shows over, folks. No warming here, nothing to see.
    Response:

    [DB] Fixed images.

  25. Sniff sniff . . . I smell a penguin BBQ.

Prev  1  2  3  4  5  Next

Post a Comment

Political, off-topic or ad hominem comments will be deleted. Comments Policy...

You need to be logged in to post a comment. Login via the left margin or if you're new, register here.

Link to this page


The Consensus Project Website

THE ESCALATOR

(free to republish)


© Copyright 2024 John Cook
Home | Translations | About Us | Privacy | Contact Us