


 Arguments


Did global warming stop in 1998, 1995, 2002, 2007, 2010?
What the science says...
| Select a level... |
 Basic
Basic
|
 Intermediate
| |||
|
Global temperatures continue to rise steadily beneath the short-term noise. |
|||||
Climate Myth...
Global warming stopped in 1998, 1995, 2002, 2007, 2010, ????
"January 2008 capped a 12 month period of global temperature drops on all of the major well respected indicators. HadCRUT, RSS, UAH, and GISS global temperature sets all show sharp drops in the last year" (source: Watts Up With That).
The flaw in this interpretation is in drawing conclusions about long term climate change over a relatively short period of time. Only over a period of decades can you confidently discern climate trends. Otherwise, you run the danger of mistaking weather for climate.
Nevertheless, several important questions remain - what's caused the warming of global surface temperatures to slow in the short-term?
Solar Minimum
The general consensus among skeptic blogs is that diminished solar activity is the cause. The sun is currently at solar minimum - cycle 23 just ended and cycle 24 is having trouble kicking along. It's as cool as it gets in the solar cycle.
However, a temperature drop of 0.6°C would require a dramatic reduction in Total Solar Irradiance (TSI). According to theoretical calculations at Atmoz, TSI would need to fall to 1347.65 W/m2 to produce a global cooling of 0.6°C. In other words, 13 W/m2 less than current levels. This is ludicrously large considering the solar cycle varies only around 1.3 W/m2.
Alternatively, Camp 2007 adopts an empirical approach to calculate solar influence on global temperature. He determines the solar cycle contributes 0.18°C cooling to global temperatures as the sun moves from maximum to minimum. Employing back of a napkin calculations, TSI would need to fall roughly 4.3 W/m2 to provide 0.6°C of cooling.
Either way, TSI needs to drop considerably to be considered the driver of 2007 cooling. So what has the sun been doing over the last few years?
Figure 1: TSI Composite and Sunspot Numbers (graph courtesy Greg Kopp).
Satellite measurements show no dramatic drop in TSI over the past several years. Instead, the solar cycle is following its usual 11 year cycle, flattening out as it reaches solar minimum. So if not the sun, what's causing the cooling?
La Niña
Currently, the Pacific Ocean is in a La Niña phase. During La Niña, cold waters upwell to cool large areas of the equatorial Pacific Ocean. This has the effect of cooling the atmosphere. During the La Niña episode of 1999, global temperatures dropped around 0.5°C.
The Southern Oscillation Index (SOI) is a measure of La Niña. Positive SOI corresponds to a La Niña phase. In 2006, the Pacific Ocean was in El Niño phase (negative SOI). However, in late 2006, El Niño subsided and in mid 2007, crossed into La Niña phase. La Niña peaked around January 2008 and is the strongest La Niña since 1999. In the Eastern Pacific, sea-surface temperatures are about two degrees colder than normal over an area the size of the United States.
Figure 2: Southern Oscillation Index (graph courtesy bom.giv.au).
In fact there was a preponderance of El Niño events in the 1990s and a preponderance of La Niña events since 2000. If we just look at the surface warming trend for El Niño years, for La Niña years, and for neutral years, in each case the trend is very consistent (Figure 3).
Figure 3: NOAA annual global surface temperatures from 1968 through 2012 with La Niña years in blue, El Niño years in red, ENSO neutral years in black, and volcanic years as orange triangles. Linear trends for 1968–2012 for each of the three categories (excluding volcanic years) are shown in the final frame.
Signal vs. Noise
Ultimately arguments that global warming has magically stopped are based on a failure to differentiate between short-term noise and long-term global warming signal (Figure 4).
Figure 4: Average of NASA GISS, NOAA NCDC, and HadCRUT4 monthly global surface temperature anomalies from January 1970 through November 2012 (green) with linear trends applied to the timeframes Jan '70 - Oct '77, Apr '77 - Dec '86, Sep '87 - Nov '96, Jun '97 - Dec '02, and Nov '02 - Nov '12.
Foster and Rahmstorf (2011) used multiple linear regression to filter out the effects of the El Niño Southern Oscillation (ENSO), and solar and volcanic activity (Figure 5), and found that the undelying global surface and lower atmosphere warming trends have remained very steady in recent years (Figure 6).
Figure 5: Temperature data (with a 12-month running average) before and after the exogeneous factor removal
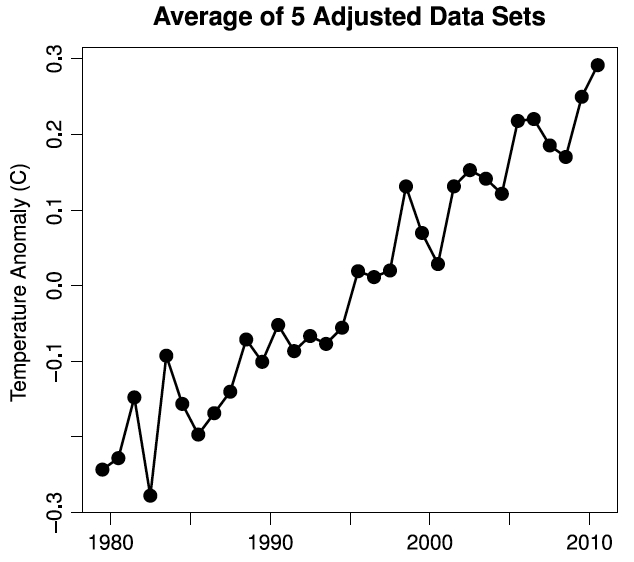
Figure 6: Average of all five data sets (GISS, NCDC, HadCRU, UAH, and RSS) with the effects of ENSO, solar irradiance, and volcanic emissions removed (Foster and Rahmstorf 2011)
In fact, when removing these short-term effects, the warming trend has barely even slowed since 1998 (0.163°C per decade from 1979 through 2010, vs. 0.155°C per decade from 1998 through 2010, and 0.187°C per decade for 2000 through 2010). This excellent video from Kevin C illustrates the point beautifully:
Oceans are Still Accumulating Heat
As Nuccitelli et al. (2012) (Figure 7) and Balmaseda, Trenberth, and Källén (2013) (Figure 8) demonstrated, the oceans have continued to accumulate heat over the past decade even while the warming of surface temperatures has slowed.
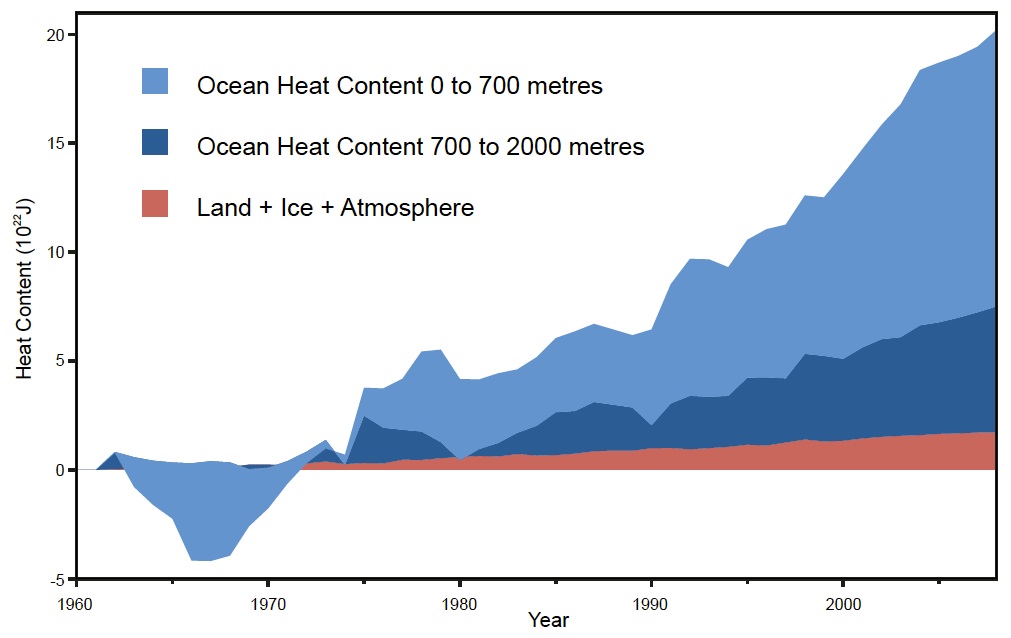
Figure 7: Land, atmosphere, and ice heating (red), 0-700 meter ocean heat content (OHC) increase (light blue), 700-2,000 meter OHC increase (dark blue). From Nuccitelli et al. (2012).
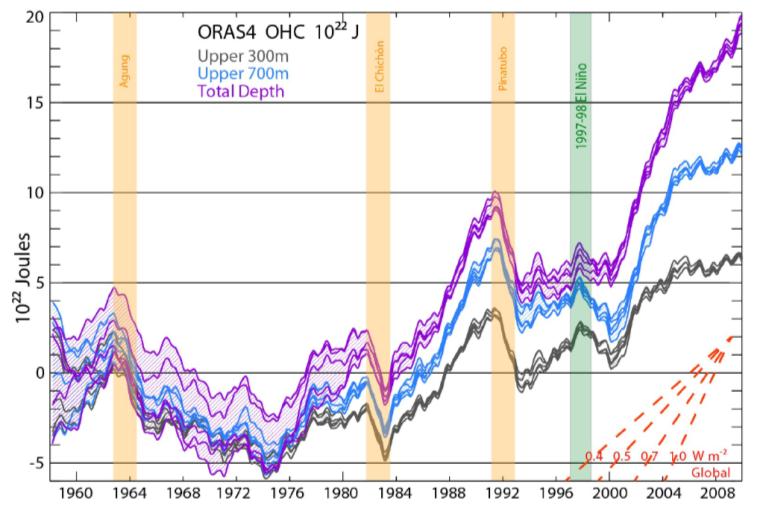
Figure 8: Ocean Heat Content from 0 to 300 meters (grey), 700 m (blue), and total depth (violet) from ORAS4, as represented by its 5 ensemble members. The time series show monthly anomalies smoothed with a 12-month running mean, with respect to the 1958–1965 base period. The vertical colored bars indicate a two year interval following the volcanic eruptions with a 6 month lead (owing to the 12-month running mean), and the 1997–98 El Niño event again with 6 months on either side.
And in fact most of the heat accumulation resulting from global warming goes into the oceans (Figure 9).
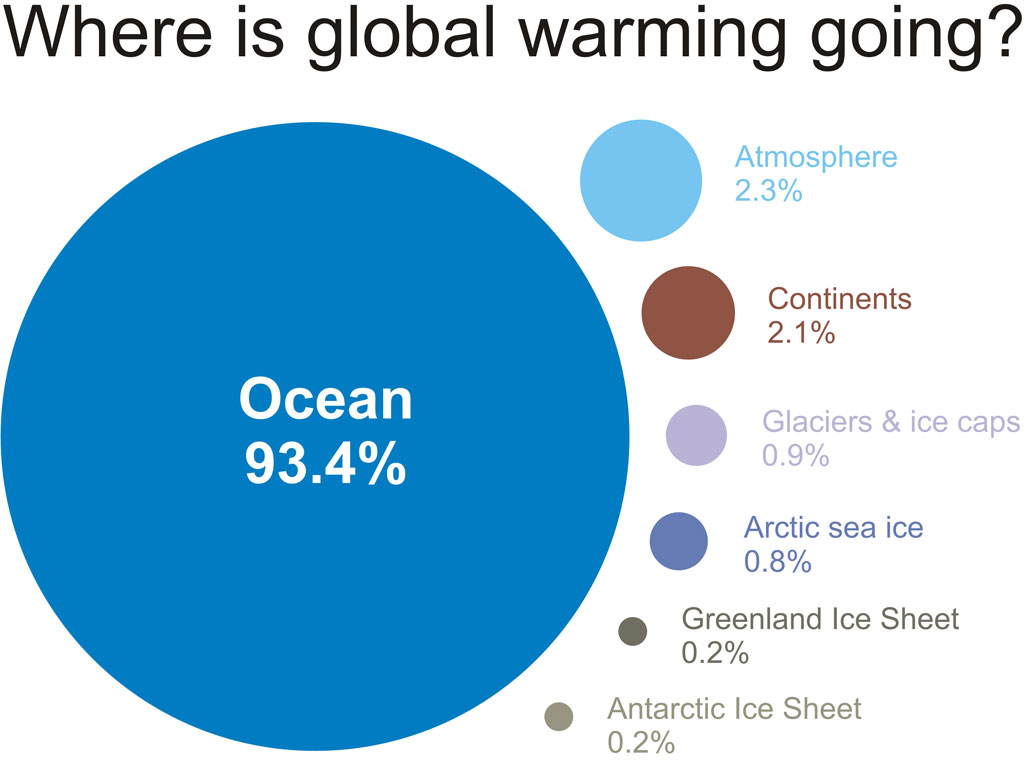
Figure 9: A visual depiction of how much global warming heat is going into the various components of the climate system for the period 1993 to 2003, calculated from IPCC AR4 5.2.2.3. Note that focusing on surface air temperatures misses more than 90% of the overall warming of the planet.
In fact Meehl et al. (2011)found that climate models expect 'hiatus decades' to occur, during which surface temperatures don't warm significantly because more heat is transfered to the deap oceans. This is what appears to have happened over the first decade of the 21st Century.
Intermediate rebuttal written by dana1981
Update July 2015:
Here is a related lecture-video from Denial101x - Making Sense of Climate Science Denial
Last updated on 2 May 2018 by pattimer. View Archives


Initial results from the Argo system contained a cooling bias due to issues with the pressure system. The latest results from Argo show warming. This is particularly the case when the results down to 2000 metres deep are considered (the upper waters show more variability while the overall warming trend is more apparent when viewing the 2000 metres heat content).
Bottom line - the oceans are still warming.