


 Arguments


What ended the Little Ice Age?
What the science says...
| Select a level... |
 Basic
Basic
|
 Intermediate
|
 Advanced
| ||||
|
The sun was warming up then, but the sun hasn’t been warming since 1970. |
|||||||
Climate Myth...
We're coming out of the Little Ice Age
"The global temperature has been rising at a steady trend rate of 0.5°C per century since the end of the little ice age in the 1700s (when the Thames River would freeze over every winter; the last time it froze over was 1804). On top of the trend are oscillations that last about thirty years in each direction. In 2009 we are where the green arrow points [on graph showing said oscillations- SkS], with temperature leveling off. The pattern suggests that the world has entered a period of slight cooling until about 2030." (David Evans)
At a glance
Where were you in 2009? It seems an age ago now. Climate science denial was everywhere. Skeptical Science was just two years old. It was like whack-a-mole - as one myth was dealt with, more would pop up.
Among the talking-points emerging around that time was the one that global warming was simply the planet recovering from the Little Ice Age (LIA). The LIA was a period of regionally cold conditions, usually said to have occurred between 1350 and 1850. Glaciers in the European Alps reversed their decline and advanced. In London, UK, the tidal Thames froze over sufficiently for 'frost-fairs' to be held on the ice, between 1608 and 1814. Their frequency is often exaggerated; roughly one winter in ten would be a realistic estimate.
Why was it so cold? Here, time travel would be wonderful. In the absence of that, we have had to develop more ingenious ways of reconstructing what happened.
A key factor is the LIA's regional nature. Its most dramatic effects were in Europe and North America. That suggests there was an element of 'internal climate variability' involved. The latter term refers to how heat is moved around within Earth's climate system, as opposed to being added to or removed from it.
During the LIA there were 'external forcing' factors too - these are things that do add or remove heat from the climate system. There was an extended period of minimal Solar activity, known as the Maunder Minimum. However, the Maunder Minimum took place between 1637 and 1719, more than 200 years into the LIA. It cannot have caused the initial cooling.
There were several colossal volcanic eruptions during the LIA, such as Laki in 1783 and Tambora in 1815. The Samalas eruption on the Indonesian island of Lombok was also huge, but occurred in 1257, almost a century before the LIA started. Volcanogenic cooling episodes typically last just a few years, but they wouldn't have helped: Laki and Tambora likely prolonged the cold conditions.
Recent research is instead hinting that the LIA was triggered by a dramatic weakening of the Gulf Stream. That was caused by warm ocean currents penetrating far into the Arctic, causing a dramatic breakup of the sea-ice. Resultant ice-floes were 'exported' en-masse out into the North Atlantic, where they melted, generating cool freshwater. This process peaked around the year 1350. The overloading by all that cool freshwater disrupted ocean circulation patterns and a rapid regional cooling followed.
At the other end of the LIA, what warmed things back up? Firstly, the 1850 end-date is not necessarily reflected in temperature datasets. These show a steady warming trend that only emerged after 1910, steepening and becoming less interrupted after 1970. That is not a regional but global pattern, suggesting that unlike the LIA, an external forcing was dominant. There's one obvious one - our pumping out of greenhouse gases.
The year 2009 was full of predictions from well-known deniers that we were entering a cooling trend. Fourteen years on, there's no sign of that!
Please use this form to provide feedback about this new "At a glance" section. Read a more technical version below or dig deeper via the tabs above!
Further details
Some climate science deniers like to insist that because the climate has changed dramatically in the past without man’s intervention, the current changes are also a natural event. You may be familiar with paintings depicting Londoners skating on the frozen River Thames. These mostly date from a period when Northern Hemisphere winters were more severe. The beginning and end of this cold period are subject to various interpretations, but the period is referred to as the Little Ice Age (LIA) and it occurred between the 14th and 19th centuries.
Limited History
If we are to understand the LIA, we need to figure out what caused it. Scientists have examined a number of important strands of evidence about the LIA. These include key natural drivers of climate change such as Solar activity, volcanoes, the Arctic and ocean heat circulation.
The activity of the Sun can be assessed by looking at proxies – processes that we know to be affected by the Sun’s activity. One of these is the formation of the radioactive isotope Carbon-14 (C14) in the atmosphere. The half-life of the C14 isotope is 5730±40 years. Radioactive carbon is mainly produced by cosmic particles reaching Earth's upper atmosphere. These particles vary in abundance through time. During times of high Solar activity, the Solar wind shields the Earth, whereas when activity is low, that shield is weaker. Thus, it is possible to deduce past Solar activity from changes in the concentration of C14 in the atmosphere. Because plants can absorb C14, past levels can be deduced by measuring C14 in tree rings and in other accurately age-constrained biogenic materials. Hence, we can estimate how active the Sun was in the past. A graph showing the Sun’s activity over the last few thousand years is presented in fig. 1.
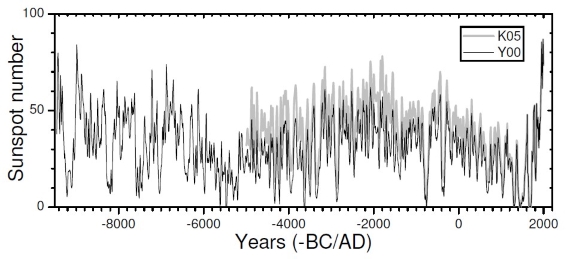
Fig. 1: Long-term sunspot-number reconstruction from C14 data. All data are decade averages. The Maunder Minimum is visible near the far right of the reconstruction. Source: Usoskin (2017).
Marked deviation from the norm in Solar activity may be expected to have effects on the climate. The Maunder Minimum, a long period when the Sun was particularly inactive, lasted from 1637 to 1719 (Owens et al. 2017). If the 1350 onset of the LIA is accepted, it cannot have been initiated by the Maunder Minimum, although it may well have helped prolong it.
Volcanic activity was high during this period of history. We know from modern studies of volcanism that major eruptions can have strong cooling effects on the climate, albeit for a limited number of years. Notably violent eruptions occurred during the LIA, such as that of Laki in Iceland in 1783 and Tambora, on the island of Sumbawa in present-day Indonesia, in 1815. These were big enough to be detected in ice-cores as sulphate-rich layers caused by sulphuric acid aerosol fall-out. They cannot have caused the LIA but they would almost certainly have prolonged it.
Going further back in time, the Samalas eruption, on the Indonesian island of Lombok, was colossal. It too left a sulphate-mark in ice-cores. The only thing is that the Samalas eruption occurred in 1257, almost a century before the accepted start of the LIA.
Socioeconomic factors may be relevant. Sudden and major population decreases occurred at this time, due to the Black Death and other pandemics. In turn, that would have resulted in a decrease of agriculture and reforestation of agricultural land. Such changes might have had a role, but how big is uncertain.
Since the original version of this rebuttal was published, advances in tracking the former extent of Arctic sea-ice have been dramatic. They are starting to provide important clues regarding the onset of the LIA. Miles et al. (2020) presented a reconstruction of sea ice export from the Arctic Ocean over the past 1400 years, using a spatial network of proxy records. They found robust evidence for a previously unknown period of extreme export of sea ice that commenced abruptly around the year 1300 and terminated in the late 1300s. The pulse of ice along East Greenland resulted in downstream increases in polar waters and ocean stratification that was sustained during subsequent centuries. Such an intense injection of fresh water into the North Atlantic Ocean could have so disrupted the ocean's circulation that the warm water currents of the Gulf Stream were weakened. That would have inhibited their moving so much heat around the Northern Hemisphere. Such a change would in turn have cooled countries adjacent to the North Atlantic, in a regional cooling phenomenon - which the LIA certainly was.
Can We Draw a Conclusion?
To some extent, the climatic shift of the LIA remains subject to speculation. Variable output from the Sun was most marked long after the LIA onset. From the end of the LIA to the 1950s, the Sun’s output increased, so its role may have been important. But since then, the Sun has slowly grown quieter, yet the temperature on Earth has continued to go up (fig. 2). This shows that whilst the Sun has an obvious role as an external climate forcing agent, it's not the only one out there. Modern global warming is mostly the result of adding manmade greenhouse gases to the atmosphere as the result of fossil fuel combustion.

Fig. 2: Annual global temperature change (thin light red) with 11 year moving average of temperature (thick dark red). Temperature from NASA GISS. Annual Total Solar Irradiance (thin light blue) with 11 year moving average of TSI (thick dark blue). TSI from 1880 to 1978 from Krivova et al. 2007. TSI from 1979 to 2015 from the World Radiation Center (see their PMOD index page for data updates). Plots of the most recent solar irradiance can be found at the Laboratory for Atmospheric and Space Physics LISIRD site.
Instead, internal climate variability, driven by abrupt and drastic changes to Arctic sea-ice, are increasingly being pointed at as the trigger for the LIA. Such an event has now been detected and will come under further scrutiny in the coming years. The end of the LIA coincided with recovering Solar output plus increasing greenhouse gas emissions with growing industrialisation. Like many changes in climate, there's no single cause and different mechanisms can dominate at different times. Today, there's no doubt about the chief agent of rising temperatures and it's not the Sun!
Last updated on 5 May 2024 by John Mason. View Archives


"The activity of the sun can be assessed by looking at proxies... One of these is the formation of the radioactive isotope Carbon-14 in the atmosphere... By measuring carbon-14 in tree rings... we can estimate how active the sun was at the time."
Can you please clarify if so-called skeptics do this? If they rely on proxy data to establish history of solar activity, how can they reject it (proxy data) for temperature?
There seems to be some very comprehensive collation of historical records here:
climate-and-human-civilization-over-the-last-18000-years
The large graphic image does expand to be very readable and informative. Hopefully the very interesting references will not be taken to be too off-topic (as they go back 18000 years).
[TD] It is pretty much off topic, for the reason you gave. And not especially interesting or informative, because it uses only a very few very small geographic regions' temperature proxies with rather low resolutions. How about posting your comment in one of these instead:
What evidence is there for the hockey stick?
Real Skepticism About the New Marcott 'Hockey Stick'
TD47 @63, the poster uses just three temperature poxies for the holocene. Two (Agassiz/Renland and GISP2, ie, Alley et al, 2000) are from the north Atlantic region. The former is a composite of four ice cores from the Agassize Ice Cap on Ellesmere Island (just west of the northern end of Greenland) and one ice core from Renland (on the south east coast of Greenland, more or less north of Iceland). They represent the regional signal, therefore, of just one region on Earth, and one of the most variable temperature wise. The author mis-cites the source of the Agassiz/Renland data as Vinther et al (2009), whereas it is in fact Vinther et al (2008).
The third core is the Vostock core from Petit et al (2001). That means all three cores are from polar regions, and exhibit polar amplification. They are therefore not representative of global temperatures. In addition, they represent just two regions, and consequently show the typically large regional fluctuations in temperature which cancel out when averaged across the globe. As a result, they significantly overstate temperature change when compared to global figures.
To compound this problem, there are two errors in the presentation of the proxies. First (unsurprisingly), the GISP2 data is plotted to end in 1905 (determined by pixel count). In fact it terminated in 1855, as discussed here. You should note that Richard Alley has confirmed that the that 1855 is the correct termination of the data. More troubling is the extended, uniform plateau at the end of the Vostok period. Checking the data, I find the last data point is for a gas age of 724 BP (=774 B2K), or 1226 AD. The extended plateau at the end of the data shown in the poster must be samples taken from the firn, ie, the upper region of the ice core where pressure has not yet sealed air gaps, allowing free exhange with the atmosphere. The consequence is that it represents an average temperature over the last few centuries rather than modern temperatures, and completely conceals all variation over that period. Coupling these facts with the fact that the final data point for the Agassiz/Renland composite core is 1960, and there are no proxy data points that actually show recent temperatures.
These flaws (regional, polar amplified proxies PLUS incorrect terminations of ice cores with no modern, regional comparisons) tend to reinforce Andy May's false claim that "...we have not seen unusual warming in the present warm period, relative to other warming events in the last 18,000 years...". In fact recent warming is unusual relative to the past 18,000 years, as is shown by Marcott et al (see second link by the moderator); and may be unprecedented in that period.
I also note that May has relied on the very obsolete, and obvsiously schematic temperature reconstruction by Scotese rather than an actual, modern reconstruction of temperatures over the Phanerozoic, such as this one by Dana Royer:
The preference May shows for obsolete data, inaccurately presented suggests the poster is of dubious value as an information source.
"The IPCC blames human emissions of carbon dioxide for the last warming. But by general consensus human emissions of carbon dioxide have only been large enough to be significant since 1940—yet the warming trend was in place for well over a century before that." (David Evans)"
Hello,
Is this 1940's thing in dispute? I read through the LIA stuff here, but it only talks about the LIA itself. It is in the "myth" section, but unless I'm missed something, I didn't see anything saying anything otherwise. I was curious when was human industry significant enough to impact climate (roughly)?
[PS] Please see "It cooled mid-century" section. Climate change is a response to net forcings not just one - aerosols are important as well.
greg84 @65:
It depends on what you mean by impact.
William Ruddiman believes (and I believe that he has shown) that absent anthropgenic emissions from land clearing and agriculture, CO2 concentrations would have fallen from a high aroun 8,000 years ago to at least 240 ppmv, or lower. That fall may well have been enough to kick us into a new iceage by now, and would certainly have resulted in LIA conditions being the norm rather than the exception. (Note, the linked paper is the earliest presentation of his hypothesis, which is supported by a number of more recent papers, and by more than just Ruddiman. His theory is, however, not universally accepted among climate scientists.)
From about 1650, coal burning in London was sufficient that there was a selective advantage for dark forms of the Peppered Moth due to soot coating trees. So from then there was an appreciable anthropogenic forcing from black carbon.
More directly related to your question, in 1940, the forcing from CO2 relative to 1832 was 0.47 W/m^2, or 29.4% of the 1.6 W/m^2 in forcing 2008. (The exact figure and percentage will change, depending on your base year. I have used 1832 for convenience as I have a spreadsheet with CO2 concentrations back to 1832.) That is clearly significant, but also not enough to account for the majority of the warming trend from 1900-1940. Deniers like David Evans, however, tend to talk as though it was completely irrelevant. In fact, that forcing is larger than the probable chang in solar forcing over that period. It is, however, likely smaller than the volcanic forcing over that period. The near complete absence of volcanoes from 1910 to 1940 is the probable primary cause of the warming in that period; supplemented by (in order of magnitude) anthropogenic forcing, and solar forcing; with those two combined being approximately of the same magnitude as the volcanic forcing.
The interesting thing is that since 1940, there has not been a pause in volcanism, so that the volcanic forcing has been negative. Likewise, the solar forcing, after peaking in 1950, has declined so that in 2008 it was almost as low as the 1910 minimum. Consequently, while anthropogenic forcings account for only about 25% of the early twentieth century warming (give or take), they account for nearly 100% of the warming from 1900 to 2013.
In a recent poll of climate scientists, 86.76% thought that 50% or more of the warming since 1850 was anthropogenic. Given a distinct, and clearly natural cooling trend from 1850 to 1900, that figure would rise significantly if the start year had been 1900, and to near unanimity for a start year of 1950. The modal (most preferred) value was 80%, with twice as many thinking it was above 80% as thought it was below 50%. Science is not settled by consensus, of course. But scientists hold their opinions for good reasons. Anybody challenging so strong a concensus must show very good reasons to do so. Unfortunately no such good reasons have been presented.
Replying to comment from here.
Donny, first point of call for any question like this has to be IPCC WG1. You want the chapter of paleoclimate, and eg Fig 5.7.
Do you accept the physics law of conservation of energy? Assuming you do, then warming of the surface is a change in the energy flow. Apart from ocean-atmosphere heat exchanges, then warming or cooling are due to changes in forcings. These can be natural or man-made. To accept the idea that "half the change" is natural, then you need evidence that there is a natural forcing, operating since LIA, of about the same magnitude as anthropogenic forcing. That evidence is tough to find.
Instead LIA (which is much more pronounced in NH) is adequately accounted for by changes in volcanic and solar forcings, certainly not operating today.
Scaddenp. ...
Are you suggesting that there are no natural forcings now?
How can you say there are no solar forcings today?
Donny @69, a forcing is the change in net energy flux at the top of the atmosphere. The Sun provides essentially all of the energy that warms the Earth, but is very constant. Over the solar cycle, it changes its output by only around 0.1%, so the change in forcing is small. Short term (decade to millenia) changes in solar output in addition to the solar cycle are not much larger. More importantly, the greatest solar output in this century was acheive around 1958, with a slight decline thereafter, becoming more rapid over the last decade. Therefore the change in solar ouput, ie, the solar forcing, since 1950 has been very close to zero, and perhaps slightly negative.
Donny, estimates of forcings operating from AR4 below:
and for the current best estimates with error bars of forcing now, see:
Solar and volcanic are clearly natural but not long term players. Again, see the WG1 for estimates of forcings at play during LIA and for how the model perform.
In an apparent flyby comment, arationofreason wrote here:
Not only do I doubt it, I doubt the comment even means anything. That is because the key word is "recovery", and it is meaningless to talk about a recovery unless you can identify a ground state to which you are recovering. However, people who discuss the "recovery from the LIA" never identify that groundstate. Indeed, they insist the recovery was ongoing to the end of the 20th century even though end 20th century temperatures were likely higher than those of the Medieval Warm Period, a period of noteworthy and unusual global warmth, at least according to climate pseudo-skeptics. I have commented more on the purely rhetorical nature of the word "recovery" in this context elsewhere.
Not only do I doubt the "recovery" rhetoric based on its emptyness, however. More importantly it does not match what we know about global temperature trends.
I realized this due to a recent discussion I had about mean global temperature around 1750. The upshot is that mean global temperatures over the twenty year period centered on 1750 (1741-1760) are statistically indistiguishable from those centered on 1900, ie, there was no strong trend in mean global temperatures representing any "recovery" from the LIA.
arationofreason specifies the last 160 years, thereby restricting the timeframe to that covered by the instrumental record. Unfortunately for his hypothesis, the first 50 years of that record show a negative trend in GMST. Their "recovery" is actually an ongoing decline in GMST (see table in next paragraph), so that if we were to merely continue it, we would have had declining temperatures over the whole of the twentieth century.
Indeed, extending beyond the instrumental record, we see that there has been no recovery going back to the most intense phase of the LIA in the seventeenth century. Using Mann08 EIV global, we find trends as:
1616-1750 -0.097 C/century (Mann08)
1751-1850 0.000 C/century (Mann08)
1851-1900 -0.020 C/century (HadCRUT4)
1901-2014 0.768 C/century (HadCRUT4)
Clearly the "recovery" is a fiction of the imagination. Global temperatures declined from a peak around the 10th century AD (see graph) to a minimum around 1500 AD, from where they bumped around about the same level until after 1900, well after the start of industrial emissions of CO2.
So not only is the rhetorical appeal to the "recovery from the LIA" meaningless, it does not even get the facts about global temperature trends right.
The focus of this article is the LIA, so none of the three rebuttals address the Thames Frost Fairs mentioned by David Evans. As Robin at 57 mentions, these fairs were not every winter. BBC article: "between 1309 and 1814, the Thames froze at least 23 times and on five of these occasions -1683-4, 1716, 1739-40, 1789 and 1814 - the ice was thick enough to hold a fair".
As a Londoner, I can say it now seems implausible the Thames would freeze at London Bridge because it has been embanked by Bazalgette, flows fast in both directions, and is navigable and tidal as far as Teddington Lock. However, when it was shallower and slower, flow could become blocked at the Old London Bridge, which was demolished in 1831. There may be research into how important the LIA was as a factor in Thames freezing, but I recall reading how it was mostly down to commercial and architectual changes.
Separately, research published Jan 2017 clarifying the 'pre-industrial' global temperature baseline as mid-eighteenth century rather than 1850-1900 makes a difference of about 0.1 °C, which actually has policy implications related to Paris targets, shaving off a few years of inaction. That seems to give an indication of the order of magnitude of any difference the LIA made at a global scale.
Suggested supplemental reading:
Scientists discover ‘surprising’ cause of Europe’s little ice age in late medieval era
Change in ocean currents – similar to phenomena seen today – likely cause behind substantial cooling, US scientists say.
by Harry Cockburn, Climate, The independent (UK), Dec 16, 2021
https://www.independent.co.uk/climate-change/news/little-ice-age-ocean-currents-b1976776.html
This question may be off topic, but I'm not used to posting anything here. I'm interested to know what is the prevailing thinking about the lack of any change or signal in global CO2 levels as a result of the decline in CO2 emissions in 2020.