


 Arguments


Real Skepticism About the New Marcott 'Hockey Stick'
Posted on 10 April 2013 by dana1981
A new global temperature reconstruction over the past 11,300 years by Marcott et al. (2013) has been described as 'the new hockey stick,' and adopted into 'the wheelchair' by Jos Hagelaars by including temperatures further in the past and projected for the future (Figure 1).
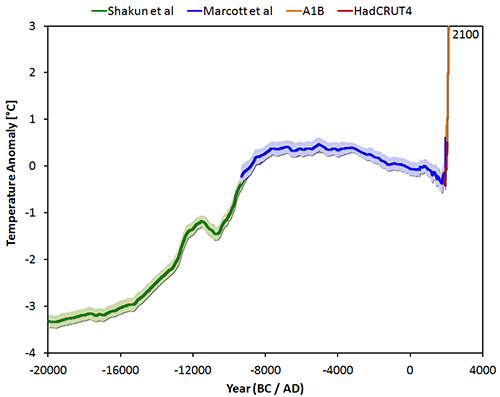
Figure 1: The temperature reconstruction of Shakun et al (green – shifted manually by 0.25 degrees), of Marcott et al (blue), combined with the instrumental period data from HadCRUT4 (red) and the model average of IPCC projections for the A1B scenario up to 2100 (orange).
The Marcott paper has been subjected to an immense amount of scrutiny, particularly in the climate contrarian blogosphere, with criticisms about everything from the wording of its press release to the timing of its Frequently Asked Questions (FAQ) publication. Unfortunately climate contrarians have been so noisy in their generally invalid criticisms that the media has begun to echo them, for example in this Washington Post blog.
With all the hubub, it's easy to lose sight of the important conclusions of this paper. The bottom line is that the rate of warming over the past century is very rapid and probably unprecedented for the past 11,000 years. That's actually both good and bad news.
Why Climate Contrarians Should Love the Hockey Sticks
The last, best hope for climate contrarians is for climate sensitivity (the total global surface warming in response to the increased greenhouse effect from doubled atmospheric CO2) to be low. We know the planet is warming due to humans increasing the greenhouse effect, and the only remaining plausible argument against taking action to do something about it is the hope that future climate change will be relatively minimal.
This is where climate contrarians lose the plot. It's understandable to look at 'hockey stick' graphs and be alarmed at the unnaturally fast rate of current global warming. But in reality, the more unnatural it is, the better. If wild temperature swings were the norm, it would mean the climate is very sensitive to changes in factors like the increased greenhouse effect, whereas the 'hockey stick' graphs suggest the Earth's climate is normally quite stable.
On the one hand, these graphs do suggest that current climate change is unnatural – but we already knew that. We know that humans are causing global warming by rapidly burning large quantities of fossil fuels. On the other hand, the past climate stability suggests that climate sensitivity is probably not terribly high, which would mean we're not yet doomed to catastrophic climate change. See, good news!
In their efforts to deny that the current warming is unprecedented and human-caused, climate contrarians are actually scoring a hockey stick own-goal because they're also arguing that the climate is more sensitive than the IPCC believes. For those who oppose taking major steps to reduce greenhouse gas emissions, that's the worst possible argument to make.
The good news for climate contrarians is that the current rate of global warming appears to be unprecedented over the past 11,000 years. During that timeframe, the difference between the hottest and coldest average global surface temperature is around 0.7°C, with the cooling between those temperatures happening slowly, over about 5,000 years.
Over the past 100 years, we've seen about 0.8°C global surface warming (Figure 2). While the time resolution in the Marcott reconstruction is relatively low, there is simply no evidence of a similarly rapid or large natural climate change in the past 11,000 years. As Tamino at the Open Mind blog shows, any similar rapid and large warming event to the current one would likely have shown up in the Marcott analysis, despite its low resolution. Tamino concludes,
"the Marcott et al. reconstruction is powerful evidence that the warming we’ve witnessed in the last 100 years is unlike anything that happened in the previous 11,300 years."
While it may seem counter-intuitive, that's a good thing, because it means the climate is not highly unstable.
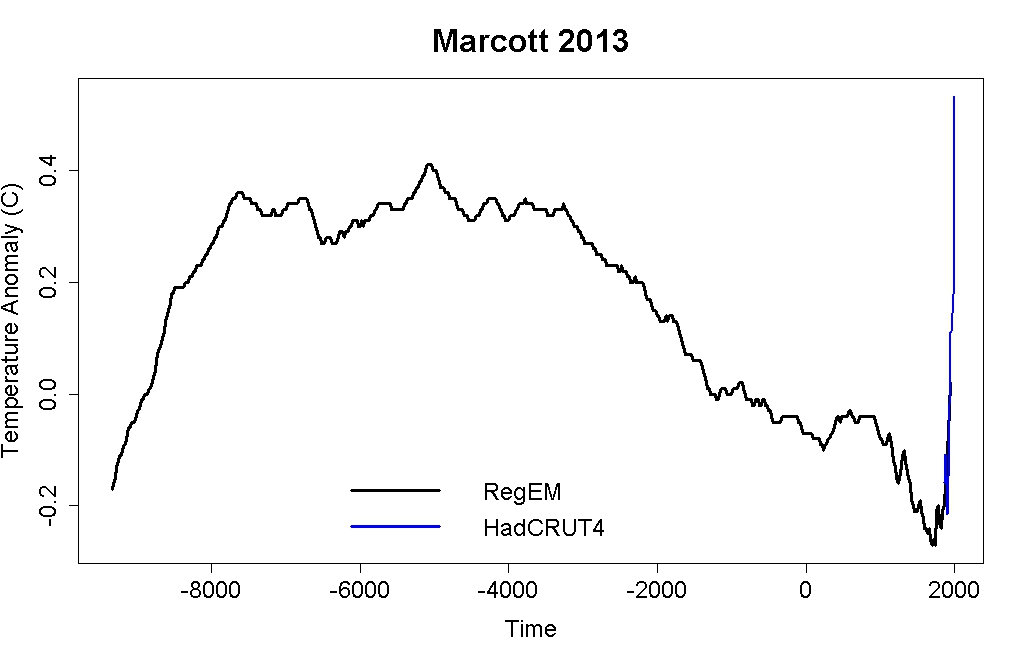
Figure 2: Regularized expectation maximization (RegEM) Marcott reconstructions (black), plus the HadCRUT4 series in 20-year averages centered on the times of the Marcott reconstruction (blue). Created by Tamino.
The Hockey Stick 'Blade' is Real
Much of the manufactured controversy about the Marcott paper is in regards to the 'blade' or 'uptick' – the rapid warming at the end of the graph over the past century. While their reconstruction does identify an approximately 0.6°C warming between 1890 and 1950, the authors note in the paper that this result is probably not "robust." Tamino notes that this uptick appears to largely be a result of proxies dropping out (although a smaller uptick seems to be a real feature), as many individual proxies do not extend all the way to the year 1950. If proxies with colder temperatures drop out, the remaining reconstruction can show an artificial warming toward the end.
In the paper, where they talk about temperatures over the past decade, the authors reference the instrumental temperature record rather than the proxies. As Tamino notes in another excellent analysis of the paper,
"for the Marcott et al. reconstruction data coverage shrinks as one gets closer to the present. But that’s not such a problem because we already know how temperature changed in the 20th century."
Certain parties have complained that the press release and subsequent media coverage of the paper have not made it sufficiently clear that the 'blade' of this hockey stick comes from the instrumental temperature data. This is the focus of the Washington Post article, for example. However, the authors were clear on this point in the paper, and in several interviews and subsequent discussions, like the FAQ.
In reality, the 'blade' of the 'hockey stick' – the instrumental temperature record – is our most accurate temperature data set. As noted in the FAQ on RealClimate, the instrumental temperature record is also consistent with proxies from other studies. For example Anderson et al. (2012) compares their study's natural proxy temperature reconstruction (Paleo; solid line in Figure 3) to the instrumental surface temperature record (MLOST; dashed line in Figure 3) and finds a strong correlation (of 0.76) between the two. Reanalysis data, as in Compo et al. (2013), has also independently confirmed the instrumental global surface temperature record accuracy (correlations between 0.84 and 0.92), as of course did the Koch-funded Berkeley Earth study.
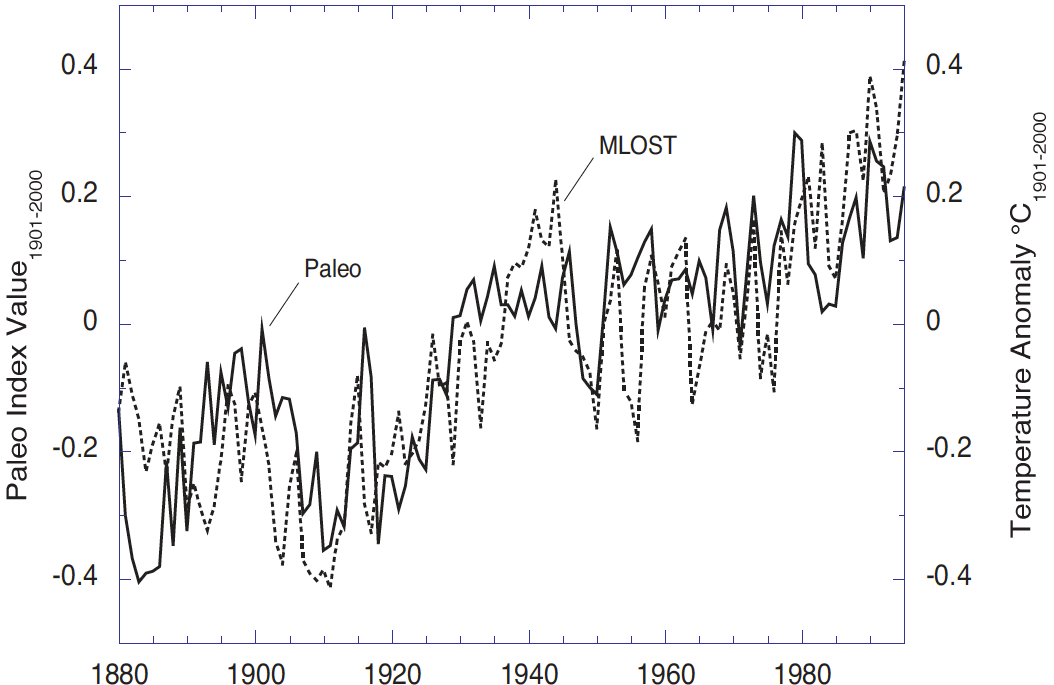
Figure 3: Paleo Index (solid) and the merged land-ocean surface temperature anomalies (MLOST, dashed) relative to 1901-2000. The range of the paleo trends index values is coincidentally nearly the same as the instrumental temperature record although the quantities are different (index values versus temperature anomalies °C). From Anderson et al. (2012).
There may be some valid criticism that the press release and some media discussions were not clear that the comments about recent unprecedented warming are based on comparing the instrumental temperature record to the Marcott reconstruction, but that is a very minor criticism that has no bearing on the scientific validity of the discussion or the Marcott paper. Unfortunately the media has begun amplifying this minor and scientifically irrelevant point.
Real Skepticism
It's worth taking a moment here to reflect on real skepticism. Spending literally dozens of blog posts attacking a study because its results seem inconvenient is not real skepticism. Comparing climate scientists to the mafia is not real skepticism. Nitpicking minor details in press releases and media articles while ignoring the discussion in the paper itself is certainly not real skepticism.
If you want an example of real skepticism, look no further than Tamino's Open Mind blog. Tamino read the Marcott paper, noted they had expressed doubt about the robustness of the final uptick in their proxies, looked at the data, identified the proxy dropout issue, tried some new analyses, and found that the proxy uptick is probably real but probably smaller than it appears in the paper. Also see similar efforts by Nick Stokes. These are the approaches of real skeptics. At least the manufactured controversy over the Marcott paper has served to show who the real skeptics and "honest brokers" are.
The irony is that the climate contrarians are being their own worst enemies here. A 'hockey stick' shape means less past natural variability in the climate system, which suggests that climate is relatively stable. It's revealing that in their zealotry to deny that the current global warming could possibly be unnatural and unprecedented, the contrarians are actively trying to undermine their only potentially valid remaining argument against serious climate mitigation.
Nevertheless, all signs indicate that the current rate of warming is very rapid, probably unprecedented in the past 11,000 years; that if we're not at the highest temperatures during that timeframe, we will be soon; and that despite the contrarians' best efforts to argue otherwise, we're not yet doomed to catastrophic climate change.
Also see this good post on the subject by John Timmer at Ars Technica, and this one by Climate Science Watch.


Some people are trying to credit Steve McIntyre, who apparently first spotted the issues with Marcott 2013 interpretations. In fact, McIntyre's comments inspired Tamino's analysis.
To those allegations, Tamino has an excellent response in his For the Record post. I particularly like this part:
In other words: McIntyre lost a real chance of contributing to paloeclimate science by seeking to confuse and deminor the Marcott 2013 results rather than constructively criticise/explain them. He can blame only himself.
Dana. You say
Part of the problem is the difficulty that some in the media had in understanding the article. When Andrew Revkin of the NYT was asked to substantiate his claim that
he stated the following
Yet Borenstein's article was quite clear as Nick Stokes pointed out when the same claim was made on his blog.
Im struggling with this article. Nobody, not even ”contrarians” disputes that surface temperatures have risen in the last 100 years, the dispute concerns the causes. I have understood that the point about the marcot blade is that it is incompatible with the rest of the curve. If the data added at the end had been taken from another time – one where there had been a short term downturn in temperatures – and this was joined to the smoothed long term curve – then the graph would show a different picture – a smooth curve with a downturn at the end. Therefore it is scientifically invalid to consider the data from the blade (which is real in its own right) together with the data from the smoothed long term series (which are also correct within their framework). Given this understanding the Marcot curve itself is quite correct, and it does not change anything we didn’t know before. But its interpretation is open to misunderstanding and misuse – and gives endless opportunities for biased input from both sides of the debate. So in that way Marcot et al were misguided in adding the two curves together.
No, Martin, they are not ”adding the two curves together”. What happens i this:
Their statistical algorithm generates the whole curve from the proxies, with the uptick. On that curve they perform a number of tests, which show that the reconstruction from 1890 onwards is not robust. This is shown in detail in the article.
This means they can't use the last part of their curve. To be able to compare the rest of the reconstruction with modern temperatures they align its mean whith one of the curves from Mann (2008), which in turn is referenced to the instrumental 1961-1990 mean.That gives them access to the modern temperature scale. They never use the uptick in any of their conclusions.
The whole thing is very elegant. The confusion comes from all those commenters who did not read the paper.
MartinG @3.
It is true that almost all contrarians don't dispute the surface temperature record but there are plenty who dispute its validity as a true record of surface temperature.
As for your assertions that if the end point of the Marcot curve were at an earlier time would yield some sort of 'anti-hockeystick', this is entirely wrong. The Marcot curve does still have an uptick all of its own, even after the 'proxy fall-off' issue is addressed. See the Tamino graph here.
And while marrying up the last century's temperature record at the correct equivilant reference temperature may not be an entirely trivial process, even if the temperature record was stuck on at an obviously low position, the resulting up-tick remains a feature of unprecedented suddenness.
The thing which tickles me about the whole Marcott uproar is that the graph isn't really 'new'. Past studies had shown the same basic shape... which is why the Shakun reconstruction can be lined up with Marcott in the first graph in the post above. The Marcott study has just narrowed the uncertainty ranges. Just as subsequent versions of the original 'hockey stick' time period have given us an increasingly clear image there.
There will inevitably be more analyses of the Marcott (and Shakun) time periods which will continue to give us better and better data. The 'skeptics' are now clinging to a ridiculous belief in 'magical temperature spikes'... there is some disagreement over whether the Marcott study conclusively disproves that or not, but it really doesn't matter because there is no logical explanation for how they could exist in the first place.
The BEST surface temperature study had an interesting approach of including even very fragmentary temperature records and correcting for outliers. I expect we'll eventually see something like that applied to the various proxy records... so you'd have the widely spaced proxies from Shakun and Marcott in the same study with annual proxies from Mann and other ~1400 year 'hockey sticks' and the even more detailed proxies used to match the instrumental record in Anderson. Different proxies over different time periods, but they can all be woven together to create a single record of equal or greater accuracy than the individual studies.
CBDunkerson @6,
Tamino explains here why 'magical temperature spikes' of last century's magnitude could not go undetected in Marcott 2013 reconstruction.
To those who doubt the possibility of detecting the high frequency periodic signal with lower frequency sampling, just think what Fourier transform can do for you. Look here for the simplest example.
I agree with Tamino that Marcott 2013 signal proves conclusively their main result (that last century warming trend is unprecedented) regardeless of logical explanations.
MartinG @3: "Nobody, not even ”contrarians” disputes that surface temperatures have risen in the last 100 years"
That just isn't true. Even a US senator claims that nobody disagrees that we are in a cold period. A short read on contrarian blogs shows that they throw doubt on anything they don't like, including the modern temperature record.
(1) I have added a comment (awaiting moderation) to the Tamino blog post.
(2) I don't find anything in the Marcott analysis to give me reasons to be optimistic about the future. First, we have rather good reasons to believe that nothing like the last two hundred years (approximately) of climate history has happened in the last several million years. Second, despite all that we don't know about the fine details of the Earth's climate system, I think we have a rather good general understanding of the role of greenhouse gases (carbon-based gases in particular) in controlling temperature and the carbon cycling in the atmosphere-hydrosphere-biosphere system with slow but more or less steady draining to the lithosphere and occasional brief small releases of carbon from the lithosphere (principally volcanic releases) to the active atmosphere-hydrosphere-biosphere climate system. Third, as I understand the Pleistocene ice core data, the general picture is that CH4 was the initial amplifier of the Milankovich warming stimulus with CO2 being the subsequent "enforcer" of the warming periods. Fourth, about two hundred years ago, humans began a massive transfer of carbon from the lithosphere to the atmosphere-hydrosphere-biosphere system. So far as I know, this massive injection of lithospheric carbon into the climate system is unprecedented in recent history (recent meaning the last few million years). To me, it seems somewhat similar to the volcanic transfer of lithospheric carbon that preceded the Paleocene-Eocene Thermal Maximum. And we only need to continue business as usual for a few more decades to achieve in about three hundred years something similar to the change in atmospheric CO2 concentrations that occurred over about ten thousand years 50 million years ago.
Given the above, I don't think we really have sufficient historical information to accurately predict the outcome of a really new climate ball game. My main point is that it is not simply that we have increased the carbon-based greenhouse gases in the atmosphere (and dissolved in the hydrosphere) but it is most significant where we have taken that carbon from.
With respect to possible spikes in the Holocene record, as claimed by 'skeptics' looking for alternative explanations for current warming: It's worth noting that there is a 200-400 year spike that we have significant evidence for - the 8.2 Kya decrease in temperatures, possibly caused by meltwater from the Laurentide ice sheet. This shows up in ice cores, sediments, and changes in sea level.
On the other hand, we have no evidence for major warm spikes in the Holocene, certainly nothing like the ~0.9 C current warming, nor any plausible natural mechanisms that could cause one. Claims to the contrary are, IMO, a mix of claiming "it's a natural cycle, "it's not us" and simple denial of the greenhouse effect.
Correction: the climate was relatively stable in the past 10,000+ years. That does not necessarily mean that it is still stable today. Perhaps that past stability had to do with the fact that ecosystems were relatively intact then. Currently, we have destroyed half the forests on land and overfished and destroyed three-quarters of the marine fisheries. Will the climate remain relatively stable as we merrily continue with the destruction of ecosystems at an exponentially growing pace, mainly to satiate the appetites of the rich one-third of humanity? That question cannot be answered based on simple extrapolations from the past.
Now some, including Eli to be sure, might think you should give Nick Stokes more credit for his posts on Moyhu and on CA. Nick might run a designer botique, but he is always worth reading on these things.
Eli @12 - good point, have updated the post to give Nick Stokes credit for his genuine skepticism as well.
Another issue which seem to be allulded to in the comments here involves confused claims that Marcott spliced the instrumental temp record onto his proxy data set. The study did not do that. They did compare the 0.8°C warming in the instrumental temperature record over the past century to the cooling of similar magnitude over the past 5,000 years in their proxy data set, which is certainly a valid and useful thing to do.
If some "skeptic" has actually thought about the implications of more variability in the past, he/she may have thought along the following lines.
Larger temperature variations in the past does not necessarily imply a higher climate sensitivity. They might instead indicate some stronger natural forcings, which might in principle have gone undetected or unaccounted for during the last century, and these forcings may have then contributed singificantly to the warning in the last 100 years in which case the contribution from CO2 would be less and hence climate sensitivity might be lower.
So this leaves a rather slim but still existing possibility that larger temperature variations in the past and a low climate sensitivity can both be true at the same time.
Lars, with all due respect... you're bending over so far backwards there that... well, you know :-)
Lars Karlsson - Just to make certain I have your points straight:
According to your post, large scale temperature rises in the past, which we have no evidence for (despite proxy evidence showing events like the 8.2 Kya cooling, which should indicate our ability to see such changes), nor any plausible physical mechanism for such a spike, involving forcings that we somehow haven't detected over the last century (the most measured period in human history), are sufficiently possible for you to argue against known radiative physics (the CO2 contribution) and/or that because of these unseen forcings you feel the climate sensitivity might be low?
I find myself oddly unconvinced...
KR: I took Lars' comment as a prediction of what we'de hear from the fake skeptics, rather than an expression of his own beliefs, but it's hard to read tone into the printed word.
...and the "plausible physical mechanism" is called "pixie dust" (AKA "natural cycles").
Lars... The problem there is, what ever magical unknown forcing that might have occurred has to also square with very well known changes in forcing we see today. And those forcings have to square with climate changes seen in the deep past as well.
The holocene is not some isolated segment of time in Earth's history that had different forcings and CS than the rest of Earth's history and the present.
It's just odd to me how hard it is for some people to accept that the overwhelming body of scientific research is mostly likely correct.
Bob Loblaw - Good point.
Lars Karlsson - You're correct, some 'skeptics' might argue those points. And as I stated, I would find such arguments rather silly. They could use roughly the same arguments from unsupported possibilities to make claims about unicorns, after all.
Dana,
Thanks for the summary of Marcott reaction, great point about what it says about real vs. false skepticism.
Inspired the post by Jos Hagelaars here is a poster annotated version of Hagelaars' Marcott graphic I have put together with temperature bands indicating human history and with last dates to constrain warming to different temperatures from Stocker (2012).
If a bit cluttered but is intended as a poster to convey science to policy types as another attempt to convey the enormity of what is now occurring. Any constructive comments or corrections welcome, especially if there are other strong references in contrast to Stocker for peaking or carbon budget exhaustion dates.
Paul
[TD] Thanks, Paul! A related SkS post is The Y-Axis of Evil.
Paul R Price @20, much as I appreciate the effort, your graph contradicts the data in Marcot et al. Specifically, it ignores the fact that the mean reconstruction is heavilly smoothed by Marcott et al's proceedure, and that it therefore conceals probable events with higher temperatures in the past. For example, you say that current temperatures exceed any experienced in the last 125,000 years. Marcott et al, in contrast say that between 18 and 28% of Holocene temperatures exceed modern temperatures. You place a line which even crosses the 1 sigma error bar with the label, "Temperatures unknown to human civilization". In fact, if we are to take Marcott et al's figure 3 seriously, human civilization has experienced temperatures up to 0.5 C greater than current temperatures in the interval between 6000 and 2000 BCE, albeit for less than 5% of that time.
These may seem like quibbling errors to you. They are not. Such errors provide "skeptics" an opportunity to point to a mistake, for the benefit of themselves or their friends. Having found such a mistake, it is then used as an excuse to switch their minds of and not consider the true ramifications, which apart from these errors you have admirably illustrated.
KR @16, as we have already discussed, the 8.2 Kya cooling event, which was large, wide spread and possibly global, does not show up in the Marcott et al reconstruction. Or more precisely, it shows up as a 0.01 C dip in the general rising pattern at that time (in the reconstruction). That dip is too small to be seen in standard representations of the reconstruction.
Tom Curtis - And as already discussed, we have sufficient proxy evidence (completely aside from the Marcott reconstruction and statistics) indicating the 8.2 Ka event and the drop in global temperatures then, an excursion lasting only a few centuries. As I noted here, there is no such support (nor physical mechanism) for any upward spike in temperatures during the Holocene of the nature and scale seen in current warming.
You certainly do have a point re: Marcott and the 8.2 Ka event - I had not carefully considered the timeline in previous remarks - but there's no evidence of 0.9 C warming spikes during the Holocene.
That's from the full body of evidence - completely aside from the Marcott et al time resolution, there is no indication of such a spike in proxy data that shows the 8.2 event. Hence arguments based upon "a spike might have been missed" are inconsistent with that body of evidence. And claims about such spikes are IMO the result of arguing about only one paper, when there is a great deal more data available contradicting such claims.
[ Not to mention that current warming will not be a short 'spike' - thousands of years will be required to draw down the CO2 we've put up in the last 150 years. And therefore claims about Holocene spikes too short to show in Marcott are irrelevant. ]
In that regard I find the 'spike' arguments seen from Watts, McIntyre, and the like to be in essence cherry-picking and red herrings; arguing about one set of data (which has its pluses, minuses, and uncertainties, and which definitely will be discussed/elaborated upon in future work) by making hypothetic claims clearly contradicted by the rest of the information available. I'm rather appalled at the time wasted on this nonsensical side-line.
Incidentally, the count of 'skeptic' posts terribly upset about this paper is up to at least 26 on WUWT, and 14 at ClimateAudit. Apparently they find the outlines of Holocene temperatures, compared to where we're going now, very threatening in some fashion.
As has previously been discussed, the 8.2 Kya event was a very significant cooling event associated with the suden release of large volumes of melt water into the North Atlantic. The volume of melt water released may have raised sea levels by as much as 1.2 meters. The effect in the North Atlantic was drastic, dropping regional temperatures by as much as 3 degrees C. The fall in temperatures is detectable in Soreq Cave (in Palestine) and in Kilamanjaro Ice cores. It is unclear whether it is detectable further afield. There are large negative excursions within age uncertainty in Antarctic Ice cores. The temperature excursion is large enough to effect the global mean surfacte temperature even if regionally confined. If, as is possible, it was a global excursion, it would have resulted in a fall, then recovery of global mean temperature of about 1 degree C.
The significance of this is that it hardly registers on the Marcott et all reconstruction. It barely registers even on Tamino's emulation, which is more sensitive to short term variations. If you look at figure 2, just prior to 6000 BCE there is a sharp decline. That is followed by a short up and down blip, followed by a general rise. Shortly after the start of that general rise there is a very brief downward blip. That blip is the 8.2 Kya event as it shows up in Tamino's version of the Marcott reconstruction.
This specific example shows, again, that Tamino's test was not adequate to support his claims, as repeated in the main post above.
KR
There are a couple of current pieces on Climate Audit looking in some detail at the proxies used in the Marcott paper and making some comparisons between these and other similar proxcies. The language used isn't hysterical and the conclusions drawn don't seem overly comtentious. McIntyre, whatever his shortcomings, perceived or otherwise, is a competent statistician and there are points made, which, to me at least, give a wider perspective on the pros and cons of the various proxies that used in climate science.
Ray - I've read through a number of the McIntyre discussions on Marcott, and (personal opinion only) have found them to be a mix of cherry-picks and arguments in detail while ignoring the larger picture. With language like "Marcottian uptricks upticks" and the like, McIntyre appears to be taking more an ideological approach than a scientific one.
I've also seen numerous statistical mistakes made by McIntyre, such as not knowing how to judge principal component weighting or deal with normalization (such as incorrectly selecting significant components, giving unsupported results), both in his attacks on Mann et al and Lewandowsky et al - I have not been impressed.
Your mileage may vary, but I don't find his work a useful contribution.
The point isnt whether McIntyre is a competent statician or not. It's what he does with it. Mostly what he has done is to draw attention aware from the main points of the paper to a sideshow. However the main point of the article is that the statistics were used simply to give people a reason to dismiss the paper whereas Tamino took the criticism on board and explored the effect and what it would do for the conclusions. Tamino's stuff advances science and could be worth publishing. McIntyre? All you seem to get sniping from sidelines, innuendo about improprietary and nothing published since M&M. I'd say put up or shut up.
Tom @ 21... "Such errors provide "skeptics" an opportunity to point to a mistake..."
You know, it seems to me, that's something that can never end. Science is iterative. It's never perfect. There is always something more to understand, always a better and more accurate way to look at things.
I keep getting the sense that the "skeptics" prey on this essential element of the scientific process in order to try and undermine it. Any real skeptic would look at a paper like Marcott and find ways that improve it by being skeptical. McIntyre and his ilk do the same thing, but in order to try to tear down other scientists and their work.
Tom that is a very interesting point. I asked around here and no 8.2ka event known NZ circles but dating is lousy. Suppose you just used Alantic-influence proxies. If the spike doesnt show with them using Marcott/Tamino's methods you must definitely conclude that the method isnt capable of resolving such spikes.
McIntyre's work is rhetorical rather than scientific. Hence the innuendoes and sarcasm.
scaddenp - There's a good set of information on the 8.2 Ka event from NOAA, which lists various paleotemperature proxies from Minnesota, Germany, Costa Rica, Greenland, and the North Atlantic as supporting evidence.
They also list paleo evidence for the end of the African Humid Period, drought during the Akkadian Empire, and the drought leading to the collapse of the Mayan Empire. Those were all regional events of only a few hundred years, but multiple sets of relevant paleo evidence is available for each.
I would therefore consider a larger scale global warming event to be something for which we would see paleo evidence - and we do not.
Just to clarify - Is anyone actually claiming both that the Marcott data might miss such a spike (which I'm willing to postulate for the sake of the discussion), and that we wouldn't see such a global event in the rest of the data? There really is no evidence for such a spike, let alone a physical mechanism.
WRT Tamino's work, I have yet to see anyone put forth a convincing counter to his work regarding a hypothetic Holocene 0.9 C global warming event, and his conclusion that it would be visible in the Marcott data. There has been a lot of discussion and/or complaints with regards to sampling effects and averaging, but - IMO there needs to be math, or it didn't happen.
scaddenp There are some calculations and comments by Clive Best on the Tamino generated peaks that reach somewhat (but not entirely) different conclusions that you might find interesting.
Steve, KR and others,
To the convinced "skeptic", <a href="http://www.skepticalscience.com/marcott-hockey-stick-real-skepticism.html#93376">all those "might" would turn into "must"</a>, and the alternatives hiding behind them would be invisible.
KR - if you applied Marcott method to only the altantic proxies and failed to find a 8.2ka cooling spike, then this would suggest problems with the method in resolving spikes. The magnitude of the 8.2ka event on global temperature being definitely debatable. The mechanism for sudden cooling in that region is there.
However, I have little time for the argument that could be 0.9 warming spikes in the absence of any physical mechanism for creating one. I just share Tom's doubts the Marcott (and Tamino's) work conclusively provide observational evidence to show that they didn't occur. I am also of the opinion that it is a side-show from the significance of the paper.
Tom,
Instead of debating yourself here, have you tried going to Tamino's blog and asking him what he thinks of the 8.2 ka event? What did he say? Tamino frequently replies to informed questions.
As I read Tamino, he does not claim the analysis proves that no sudden spikes could occur. He claims Marcott is strong evidence that such spikes did not occur. This seems reasonable to me.
How could all the proxies have missed such a spike? As you point out, there is evidence of a drop in proxies at 8.2 ka. Others challenge that as a global event. Marcott may be correct that it was mostly a North Atlantic event, like the midieval warm period. Manns' data shows that if you cherry pick your proxies you can find a lot of spurious, local trends. KR lists several known local events. Where are the proxies for a sudden, global spike? I do not see skeptics here providing a list of proxies showing a spike. They must have searched for such proxies without being able to find them.
In addition to showing that Marcott might have missed a sudden spike, a physical mechanism for such a spike is required.
michael sweet @36, when I first raised issues regarding Tamino's argument, I raised them at Open Mind. They never got past the "awaiting moderation stage". I reposted the comment to be sure, with the same result. I have drawn the conclusion that Tamino does not want my comments, for whatever reason, and given that, would not deign to comment at Open Mind again if future.
Since you asked ...
Ray - While Clive Best has some interesting work there, it isn't (IMO) complete.
He presents data binned into 50-year blocks, rather than with 20-year linear interpolations (meaning a larger smoothing at 1/4 the spike length, reducing/spreading the hypothetic spikes). That is not directly comparable to either Marcott or Tamino - the difference in processing may make a considerable difference in results, and I don't see any evaluation of its effect.
In addition he has (as far as I can see) only presented two realizations of the data; one with nominal dates and one with a randomization of 20% of proxy resolution (not the age uncertainties described in the supplemental data). Given the high variability of individual realizations, a fairly large number of runs will have to be evaluated - which is why Marcott et al did 1000 perturbations - to see the signal common to all realizations. Running a 5-point smoothing (as Best did on his first realization) is not equivalent to a Monte Carlo permutation of the uncertainties.
There are other differences in approach that I suspect don't matter much, such as date-shifting an entire proxy rather than random-walking the radiocarbon age control points, and the Marcott modeling of time uncertainty as a first-order autoregressive process. But those first two (additional smoothing and only two realizations) may account for much of the difference in results between Best and Tamino.
---
Again, though, since current warming will not be a 200-year spike, but rather take thousands of years to reverse, well covered by the Marcott resolution, such hypothetic arguments about Marcott et al processing are irrelevant to current conditions - there is zero evidence for, and considerable evidence against, warming akin to current conditions during the pre-Industrial Holocene, including in the Marcott data.
Regarding the 8.2 kYr event: This isn’t necessarily a fair test of the sort of analysis that Tamino has done. That’s not to say that the issue settled and I personally think it’s a shame that this interesting study has become factionalised.
The astonishing thing about the 8.2 kYr event as captured in Greenland cores is how fast it was. Temperatures dropped and rose so fast that there was only a 70 year period in which isotope ratios were below the Holocene average.
The event is captured in high resolution Greenland cores and is also seen in N. Atlantic proxies. However a detailed analysis of these indicates that the amplitude of the event in proxies drops quite rapidly away from the main event. There isn’t much evidence that the 8.2 kYr event had much of a temperature impact further afield. Modelling of the event suggests that the cooling is expected to be localised mostly in the N. Atlantic with a warming in the Southern Oceans (as less heat is transported by the AMOC). The Kilimanjaro paper Tom linked to has an indirect proxy for the climate event around (fluoride levels in dust arising from partial lake drying). This doesn’t necessarily arise from a local temperature change but might involve changes in hydrology arising from the event further afield. However if one wanted a more direct local temperature measure (e.g. delta 18O) the Kilimanjaro cores actually have a “warming” spike (or series of spikes) around the 8.2 kYr period.
The Antarctic cores don’t help to pin things down very much. The dome C core shows a very long slow cooling that starts around 10,000 years ago and continues through the 8.2 kYr event with no particular change in rate (the temperature in the starts to rise slowly soon after). I don’t see how this can be taken as evidence of Antarctic cooling associated specifically with the 8.2 kYr event in Greenland. Interestingly the Vostock core has a very marked positive temperature spike right at the time of the 8.2 kYr event. Not sure if this is considered to be an artefact but it is represented by 3 or 4 points in the core time series that rise and then fall (I was going to plot this but someone has already done so ).
I would conclude:
i) If the Marcott proxy set is a representative selection of global temperatures captured in proxies then (a) the large N. Atlantic signal is likely to be diluted (or negated) by the relative smaller cooling elsewhere (or warming contributions from the S. hemisphere) so that the nett global signal is small (e.g. relative to the globally averaged warming that has accrued over the last ~ century). The fact that it hardly exists in the Marcott composite may simply reflect the fact that globally-averaged there wasn’t much of a temperature change (need to inspect each of the Marcott proxies to assess this).
(ii) The extremely rapid signal in the ice cores approximates to around 70 years in total up and down. Such rapid temperature excursions (much faster than current warming) might be poorly captured in the proxies and/or smeared by the Marcott/Tamino methods (again would be helpful to inspect the individual proxies).
What this boils down to is that the 8.2 kYr event isn’t a particularly fair test of the ability of the Marcott/Tamino methodologies to preserve a contemporary-style temperature excursion since (a) the 8.2 kYr event may not have involved much of a temperature change globally averaged and (b) it was much faster up and down compared to our (pretty fast) temperature rise.
Hmm, I wonder if Tamino simply confused you with Tim Curtin (definitely persona not grata there)?
hmmm...my HTML hasn't worked...oh well
@21 Tom Curtis
I am not sure what to make of your response, on the one hand you seem to admit that the graphic in @21 does show the "broad ramifications" of climate change well, though you do not seem to engage with the ramifications and instead concentrate on details.
All of your points do reduce to quibbles given that the graphic's intent is to give the broad ramifications from the graphic and from the comments regarding Marcott et al.'s findings by Mann, and others here at SkS. Any real skeptics will go to Marcott et al. and read it and discussions directly, as referenced in the graphic, to get the detail.
By concentrating on 'uncertainty', and anything rather than on the ever increasing certainty of our predicament given the extreme rate of warming now under way, you seem to be criticising by saying we should worry about exactly the type of false skeptics that Dana's post above concerns. They can go elswhere, why bother with time wasters? We need to move on to mitigation action, that should be clear from the graphic, especially when combined with the analysis by Stocker.
We need to get policy-makers to understand where the science is at, and that does mean we need 'un-sciencey' broad brush identification of dangerous global risks. The vital message we need to convey and that comes through so clearly, thanks to the scientific work, is that the current rate of warming is outside any seen in the Holocene. It does not take a climate scientist to see through the quibbling nonsense of the critiques from Pielke Jr and co.
The aim of the Hagelaars' graphic and my attempt to present in another form is to convey the recent science to the public and decision-makers, to convey the enormous existential choice humanity faces regarding carbon emissions. Somehow all of this weight of science has to get through more quickly and more fully to policy-makers, economists and most especially the public so that they too can recognise the dangers to their own childrens' future.
chris
If the 8.2 kYr event is that sharp and localised to the NA then you would not expect it to show up under Tamino's analysis. In fact it might be hard to detect at all in Marcotts data once you have looked at the global average. Although more of the proxies are in the NH, Marcott uses area weighting when calculating it so any localised event is going to be filtered out in the averge.
Really what Tamino is showing is how likely a global spike is to be detected. Regional spikes, or regional spikes compensated for by opposite changes elsewhere will be even harder to detect if they can be detected at all.
The point of the test is to evaluate whether a global change comparable to the current rise would be detected.
And as an aside, how does a spike that intense and that short occur in the NA? If there was a significant collapse of the MOC, would it recover that quickly?
Chris @39:
1) In Marcott's Agassiz-Renland data, the 8.2 K event first shows at 8.21 Kya and last shows at 8.09 Kya event, giving the event a total distinguishable duration of 140 years, with a peak duration of 100 years. That compares to a Tamino spike with a total distinguishable duration of 180 years and a peak duration of 20 years. (The total distinguishable duration is 180 rather than 200 as, for the first and last 10 years the spike would not be distinguishable from the background in any way.) Thus the 8.2 K event is comparable to a Tamino spike, and if anything should be easier to detect due to its longer duration at low values.
This is in close agreement with your first link on the timing of the 8.2 K event, which shows the following graph, in which it can be clearly seen that the event starts at just under 8.25 Kya, has a period of lowest values from 8.21 kya to 8.14 Kya and finishes around 8.07 Kya, giving a total distinguishable duration of 180 years and a distinguishable peak duration of 70 years. Or, as claimed in the abstract:
"Using a composite of four records, the cold event is observed as a 160.5 yr period during which decadal-mean isotopic values were below average, within which there is a central event of 69 yr during which values were consistently more than one standard deviation below the average for the preceding period."
Finally, your second link on duration says:
"Greenland temperature cooled by 3.3±1.1 °C (decadal average) in less than ∼20 years, and atmospheric methane concentration decreased by ∼80±25 ppb over ∼40 years, corresponding to a 15±5% emission reduction. Hemispheric scale cooling and drying, inferred from many paleoclimate proxies, likely contributed to this emission reduction. In central Greenland, the coldest period lasted for ∼60 years, interrupted by a milder interval of a few decades, and temperature subsequently warmed in several steps over ∼70 years. The total duration of the 8.2 ka event was roughly 150 years."
(My emphasis)
If you are going to quote only the coldest period of the 8.2 K event, as you appear intent on doing, you must compare it with only the coldest period of a Tamino style spike. At that spike has a triangular, not a square wave form, that coldest period is just 20 years.
All in all, the comparison of durations suggest an 8.2 K event is more likely rather than less likely, to be picked up in the proxy record than a Tamino style spike.
2) From the Kilamanjaro paper I linked to, the Kilamanjaro oxygen isotope data show a negative excursion at 8.2 Kya, although it is not large relative to other excursions. The Soreq Cave oxygen isotope data shows a positive oxygen isotope excursion at that time, indicating an enhanced isotope signature in groundwater. The isotope signature of d18O in caves depends on two functions, one of which always gets heavier (more 18O) with increasing decreasing temperature, and one which can get heavier or lighter with decreasing temperature. Thompson et al 2006 invert the d18O data for Soreq cave, presumably because the former function dominates at Soreq Cave, hence indicating a significant temperature excursion in palestine.
Morril et al, 2013 show an up to date picture of the cooling pattern of the 8.2 K event. It is characterized by marked cooling in the North Atlantic and surrounding regions including the Tropical Atlantic; but by an amiguous pattern of regional warming or cooling in the south:
Overall it would have been a net cooling event. GMST would have shown a negative excursion even if not all points globally experienced such an excursion. In fact, had it not we must assume that climate sensitivity is very low, because there was definitely an increase in albedo from extended glaciers, sea ice extent and snowfall in the Northern Hemisphere.
The question is not whether there was an excursion, but how large (which is indeterminate) and why does it not show up in either the Marcott et al reconstruction or Tamino's partial replication of that reconstruction?
3) Dome C data shows four large negative excursions within two standard deviations of the error in dating of 8.2 K. I doubt that they are statistically significant, but it provides no evidence of warming at 8.2 K, and is consistent with (that weakest of evidentiary measures) cooling at that time. They do not show up at low resolution as there are intervening spikes in temperature. Vostock does show a statistically significant spike, but depending on the age error that may or may not align with the 8.2 K event. If either of the two troughs on either side of that spike were in actuality the period of the 8.2 K event, then the 8.2 K event was global and about the size of a Tamino spike. If instead the spike was aligned, the 8.2 K event, while still reducing the GMST would only do so by a small amount. Which of these is the case we do not know.
We too often pay only lip service to the error in dating or temperature estimation. We simply align proxies across the globe as though their mean date represented the actual date - but it does not. It is only the best estimate out of a range of dates, and may have a probability of being the actual date as low a 5% or less.
Consequently, if I could suggest any single improvement to Tamino's attempted demonstration that a spike would show, it would be that he introduce the spike, then vary the time of that spike in each proxy based on the temporal error at the control points; and then from the pseudoproxies so created then attempt to reconstruct the spike using the full Marcott proceedure. His method assumes that all the temperature spikes are in fact alligned across all proxies, with the temporal jittering only smoothing the data. The temporal jittering, however, is an attempt to allow for the fact that, with very high probability, the temporal allignment of the various proxies has been lost. That is, events dated at 8 Kya in all proxies probably occured at different times by a varying amount depending on the temporal error of the proxy.
It is a great advance by Marcott et al, IMO, to find a way to allow for that and to produce a statistical description of the constraints on global temperature given that error. Unfortunately many of us have insisted on interpreting Marcot et al as though they had not made that advance, or as if it was of no consequence.
Glenn Tamblynn @43, Chris overstates the brevity of the 8.2 K event to the point of misrepresentation IMO. He understates the geographical area of coverage; and overstates the SH warming by using model data where proxy data shows a more heterogenous situation. Finally, he fails entirely to allow for the effects of errors in synchronization between different proxies. See my post @44 for details.
Paul R Price @42, the question is whether or not we will accurately report the science. As it stands, your diagram shows as temperatures never experience by human civilization where, at one point, Marcott et al show there was a 50% chance the 300 year average of temperatures experienced by human civilization where higher than that; with a near certain chance that for individual decades they were higher than that. You also say:
That, again, contradicts what Marcott et al actually found.
You may think it too much trouble to correct the graph by raising the "never experienced by human civilization" limt by 0.4 C to accurately reflect Marcott et al; or to modify the second claim to read:
If you do so, you are choosing to be "effective" over being scientifically "honest", in Schneider's terms. Why do so when you could so easilly do both?
Paul, just a small additional note.
Where you to make the corrections I recommend (or equivalent), I think you graphic would be an excellent tool that should be more widely spread; to which point I would heartilly recommend that SkS add it as an update to both this post and to the Y-axis of evil quote.
@46/47 Tom Curtis
Quite right, I would indeed prefer the @20 graphic to be both effective and honest to the science and I'm happy to spend the time to improve it. I had a problem with discerning your tone in @21, you will understand if I am wary on climate comment threads, so it is good of you to have another go.
By taking the time to spell them out, your suggestions now make a lot more sense to me and I will definitely look at them again as soon as I can. I am happy to spend the time to get it 'right' in the kinds of ways you suggest. And, of course, the broad message of the graphic remains sadly the same.
Thanks, Paul
Paul@48,
While you work on your poster, consider my little technical advice:
Don't save it as JPG file. JPEG format (natural contone image compression) does very bad job with text (does not compress it well and a lossy result means text is distort), save it in PDF format.
Your embedded graphic (being simple, non-natural image) will be shown best in PNG format (both smallest and lossless).
You'll achieve both small file size (easily downloadable) and nice resolution independent zoom-in.
@49 chriskoz
Many thanks for the excellent advice. I had not yet taken the time to explore how to format the graphic for the net so thanks for saving me the time.