Climate Science Glossary

Term Lookup

Enter a term in the search box to find its definition.

Settings

Use the controls in the far right panel to increase or decrease the number of terms automatically displayed (or to completely turn that feature off).

Term Lookup

Settings


All IPCC definitions taken from Climate Change 2007: The Physical Science Basis. Working Group I Contribution to the Fourth Assessment Report of the Intergovernmental Panel on Climate Change, Annex I, Glossary, pp. 941-954. Cambridge University Press.

Home Arguments Software Resources Comments The Consensus Project Translations About Support

Twitter Facebook YouTube Mastodon MeWe

RSS Posts RSS Comments Email Subscribe


Climate's changed before
It's the sun
It's not bad
There is no consensus
It's cooling
Models are unreliable
Temp record is unreliable
Animals and plants can adapt
It hasn't warmed since 1998
Antarctica is gaining ice
View All Arguments...


Username
Password
New? Register here
Forgot your password?

Latest Posts

Archives

Is extreme weather caused by global warming?

What the science says...

Select a level... Basic Intermediate

Global warming amplifies the risk factors for extreme weather events - and that is all that Climate Science claims.

Climate Myth...

Extreme weather isn't caused by global warming

"The 30 major droughts of the 20th century were likely natural in all respects; and, hence, they are "indicative of what could also happen in the future," as Narisma et al. state in their concluding paragraph. And happen they will. Consequently, the next time a serious drought takes hold of some part of the world and the likes of Al Gore blame it on the "carbon footprints" of you and your family, ask them why just the opposite of what their hypothesis suggests actually occurred over the course of the 20th century, i.e., why, when the earth warmed - and at a rate and to a degree that they claim was unprecedented overthousands of years - the rate-of-occurrence of severe regional droughts actually declined." (source: CO2 Science)

At-a-glance

Have you experienced an extreme weather event?

The answer to that question first requires a definition for 'extreme' weather. What threshold must be passed for 'bad' weather to take on the distinction of being 'extreme'?

The IPCC Sixth Assessment Report (AR6) defines an extreme weather event as, “an event that is rare at a particular place and time of year”. So we're getting somewhere now, although we're still left with 'rare', which is not a precise term. But we have to be pragmatic about such things. It's fair to say that torrential rain, for example, is common enough seasonally in the world's Monsoon belts but infrequent in deserts, so 'rare' in that latter case is a justifiable word to use.

When those Monsoon-affected parts of the world experience torrential rain sufficient to submerge vast areas of a country beneath flood-waters, we can agree that's pretty extreme, too. Basic physics tells us that for every degree Celsius of extra warmth, air can carry 7% more moisture. So the potential for heavier rains in a warming world is obvious. The IPCC use strictly-defined categories of probability. In AR6, the probability of an increase in heavy precipitation events is given as "Likely on a global scale, over a majority of land regions". That probability is described in terms of their, "increased frequency, intensity, and/or amount of heavy precipitation". 'Likely' means they are 66-100% certain this will happen.

National weather agencies are able to compare weather events against a baseline for which they have good data-coverage. In most countries, such coverage has been in place since the mid 20th Century, but in some, such as the UK, the data go back for another 100 years. So if a record in terms of heat or daily rainfall amount does get broken, that's significant.

In July 2022, for example, the UK saw extraordinarily high temperatures with a daily maximum of 40.3°C recorded at Coningsby in Lincolnshire. This was the first time 40°C had ever been recorded in the UK. But more astonishingly, a total of 46 other weather stations exceeded the previous UK record of 38.7°C. In addition, overnight minimum temperatures widely exceeded anything recorded before. That scorching heat wave, coming on top of drought conditions, had tremendous impacts both in terms of lives lost and fire-related damage. Again, that's significant.

The problem is that in a warming world, 40°C days in the UK can be expected to become more frequent as the decades pass by. In a world where global warming continues unabated, yesterday's extreme becomes next century's normal. The trend of, "warmer and/or more frequent hot days and nights over most land areas", is described in AR6 as, "virtually certain". In the strictly-defined categories of probability adopted by the IPCC, 'virtually certain' can only be used where there is 99-100% probability.

So the take-home is that some, but not all weather-types are liable to be amplified in their severity and frequency by global warming. Heat, drought, fire-weather and long-duration heavy rains: surely that's enough to be dealing with.

Please use this form to provide feedback about this new "At a glance" section. Read a more technical version below or dig deeper via the tabs above!


Further details

Whenever there is an extreme weather event such as a flood or drought, the media will tend to feature it and the question that is often raised is whether that event was caused by global warming. Unfortunately, there is often no quick answer to this question. That is because weather is highly variable and extreme weather events have always happened. The attribution-studies required to determine whether a global warming signal is detectable are complex. They take a lot of time. Detecting trends also takes time, particularly in cases where observational records are rare or even missing in certain regions.

An increase in some categories of extreme weather is nevertheless expected with global warming, because rising temperatures affect weather phenomena in several ways. Appropriately and in a timely fashion, the working group one (WG1) section of the IPCC’s Sixth Assessment Report (AR6) includes a chapter specifically dedicated to discussing weather extremes. That's a first, assessing how such things have changed both regionally and globally, in recent decades. A key conclusion is that it is an “established fact" that human greenhouse gas emissions have “led to an increased frequency and/or intensity of some weather and climate extremes since pre-industrial times”.

How global warming affects weather

Rising temperatures can have several effects on the weather. For example:

  • They increase the rate of evapotranspiration, which is the total evaporation of water from soil, plants and water bodies. This can have a direct effect on the frequency and intensity of droughts.
  • A warmer atmosphere can hold more water vapour, potentially increasing the severity of intense or prolonged rainfall events. According to AR6, "combined satellite and reanalysis estimates and CMIP6 atmosphere-only simulations (1988–2014) show global mean precipitable water vapour increases of 6.7 ± 0.3 % °C–1, very close to the Clausius–Clapeyron rate (Allan et al. 2020)".
  • Changes in sea-surface temperatures (SSTs) also have an effect by bringing about associated changes in atmospheric circulation and precipitation. This has been implicated in some droughts, particularly in the tropics.

These changes don't automatically generate extreme weather events but they change the odds that such events will take place: it has often been said that, "climate trains the boxer but the weather throws the punches". It is equivalent to the loading of dice, leading to one side being heavier, so that a certain outcome becomes more likely. In the context of global warming, this means that rising temperatures increase the odds of certain kinds of extreme events occurring.

Changes in extreme weather events are already being observed

In the US, for example, the Global Changes Research Program published a report in 2018 entitled Fourth National Climate Assessment Volume II: Impacts, Risks, and Adaptation in the United States. It reports the following findings for recent decades:

  • Some climate-related impacts, such as increasing health risks from extreme heat, are now common to many regions of the United States.
  • Many places are subject to more than one climate-related impact, such as extreme rainfall combined with coastal flooding, or drought coupled with extreme heat, wildfire, and flooding.
  • Annual precipitation since the beginning of the last century has increased across most of the northern and eastern United States and decreased across much of the southern and western United States. Over the coming century, significant increases are projected in winter and spring over the Northern Great Plains, the Upper Midwest, and the Northeast.
  • The frequency of drought has increased in areas such as the Southeast and the West, and decreased in other areas. Rising temperatures make droughts more severe and/or widespread, and also lead to the earlier melting of snowpacks, which can exacerbate problems in vulnerable areas.
  • Atlantic hurricanes have increased both in power and frequency, coinciding with warming oceans that provide energy to these storms. In the Eastern Pacific, there have been fewer but stronger hurricanes recently. More research is needed to better understand the extent to which other factors, such as atmospheric stability and circulation, affect hurricane development.

Similarly, Australia has seen the odds of both heavy rainfalls and droughts (and consequent wildfires) increase, and similar patterns are being observed worldwide, coinciding with rising temperatures over the past 50 years. Heat waves are also occurring more frequently as temperatures shift upwards. The same goes for Europe and parts of Asia.

Carbon Brief has an interesting interactive extreme weather map. It lets you see whether attribution studies have been completed for any single event - well worth a look when you have some spare time.

Screenshot Carbon Brief Map of extreme events

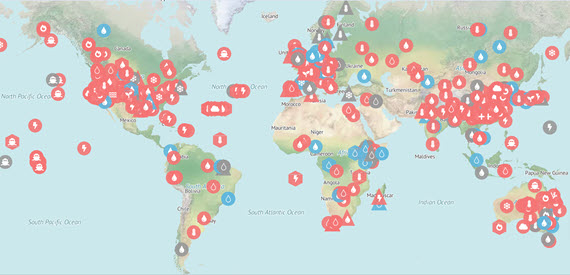
Figure 1: Screenshot of Carbon Brief's interactive map of extreme events. Red icons indicate that human influence was found, blue icons where that is not the case, grey icons where it's inconclusive. Full map with links to the studies available here.

In conclusion, although it isn't possible to state that global warming is causing a particular extreme event at the same time that event is wreaking havoc, it is wrong to say that global warming has no effect on the weather. From the record-breaking “heat dome” of 2021 in the Pacific north-west and the accompanying catastrophic wildfires to the devastating flooding in Europe of July 2021; from the record July 2022 UK heatwave to the disastrous series of atmospheric rivers that struck California from late 2022 to early 2023, extreme weather is occurring all around the planet and records are not just being broken, they are being smashed.

Last updated on 6 August 2023 by John Mason. View Archives

Printable Version  |  Offline PDF Version  |  Link to this page

Argument Feedback

Please use this form to let us know about suggested updates to this rebuttal.

Comments

1  2  3  4  Next

Comments 1 to 25 out of 97:

  1. "There is growing empirical evidence that warming temperatures cause more intense hurricanes, heavier rainfalls and flooding, increased conditions for wildfires and dangerous heat waves". Does the above statement mean that the studies which show that there is no apparent link between temperature rise and hurricanes, rainfall, flooding, fires and heatwaves, are somehow not scientific ?
  2. BUSH ADMINISTRATION LINKS EXTREME WEATHER TO GLOBAL WARMING Droughts, heavy rain, heat waves, wildfires and intense hurricanes are more likely to affect North America because of global warming's effect on extreme weather, the Bush Administration's Climate Change Science Program said Thursday. There's high confidence that the frequency and intensity of extreme weather events has already been influenced by global warming, and even greater confidence that more expensive, damaging and deadly weather is to come as temperatures continue to rise... Free Republic June 20, 2008 Always remember the extreme weather/global warming mantra: "No particular weather event...can be blamed on something so general."
  3. By mid-century, annual average river runoff and water availibility are projected to increase by 10-40% at high latitudes and in some wet tropical areas, and decrease by 10-30% over some dry regions at mid-latitudes and in the dry tropics; some of which are presently water stressed areas... Drought affected areas will likely increase in extent. Heavy precipitation events, which are very likely to increase in frequency, will augment flood risk. IPCC AR4 WGII Summary for Policymakers. In a warmer future climate...Models project increased summer dryness and winter wetness in most parts of the northern middle and high latitudes. Summer dryness indicates a greater risk of drought. Along with the risk of drying, there is an increased chance of intense precipitation and flooding due to the greater water-holding capacity of a warmer atmosphere. This has already been observed and is projected to continue because in a warmer world, precipitation tends to be concentrated into more intense events, with longer periods of little precipitation in between. Therefore, intense and heavy downpours would be interspersed with longer relatively dry periods... IPCC AR4 WGI FAQ 10.1 The warmer climate therefore increases the risks of both drought - where it is not raining - and floods - where it is - but at different times and or places. For instance, the summer of 2oo2 in Europe brought widespread floods but was followed a year later in 2003 by record-breaking heat waves and drought. The distribution and timing of floods and drought is most profoundly affected by the cycle of EL Nino events... ...overall trends in precipitation are indicated by the Palmer Drought Severity Index...which is a measure of soil moisture using precipitation and crude estimates of changes in evaporation. (The PDSI graph shown roughly increases below the "0" line until about 1977, after which its all above the line.) IPCC AR4 WGI FAQ 3.2 Drought is easier to measure (than heavy precipitation events) because of its long duration...The Palmer Drought Severity Index calculated from the middle of the 20th century shows a large drying trend over many Northern Hemisphere land areas since the mid-1950's, with widespread drying over much of southern Eurasia, northern Africa, Canada and Alaska...and an opposite trend in eastern North and South America...Decreases in precipitation over land since the 1950s are the likely main cause for the drying trends, although large surface warming during the last two to three decades has also likely contributed to the drying... IPCC AR4 WGI FAQ 3.3
  4. #2: Something the Bush admin said in 2008 seems to be correct? "As options dwindle for negotiating a global pact to fight climate change, the United Nations is pointing to today's "extreme conditions." "As global temperature records have been set for the early summer months, states and cities are also setting hundreds of temperature records. ... Unfortunately, climate models indicate that an average summer in 2050 will have even more days topping 90°F if global warming continues unabated."
  5. Here is a statement of what should be the new paradigm: Weather in a given region occurs in such a complex and unstable environment, driven by such a multitude of factors, that no single weather event can be pinned solely on climate change. In that sense, it's correct to say that the Moscow heat wave was not caused by climate change. However, if one frames the question slightly differently: "Would an event like the Moscow heat wave have occurred if carbon dioxide levels had remained at pre-industrial levels," the answer, Hansen asserts, is clear: "Almost certainly not." The frequency of extreme warm anomalies increases disproportionately as global temperature rises. "Were global temperature not increasing, the chance of an extreme heat wave such as the one Moscow experienced, though not impossible, would be small," Hansen says. The map on that page makes it clear exactly what is meant by extreme variability:
  6. This rebuttal lack links to actual studies which is unusual and I think should be fixed.
  7. Scaddenp, bearing in mind that I'm assuredly -not- being smart-aleck, in some ways this site is "open source" in the sense that people drag in all sorts of literature and deposit it for everybody's enjoyment. "Enjoyment" often takes the form of attacking offerings and dragging them back and forth like meat thrown to a pack of feral dogs, but that's just one possible outcome. If you should have a few minutes to spend beavering away at Google Scholar, looking for likely candidates, you can bet that what you find will be most appreciated.
  8. And now for something completely different: Coldest winter in 1000 years is on the way The change is reportedly connected with the speed of the Gulf Stream, which has shrunk in half in just the last couple of years. Experts dispute record weather forecast Although La Nina has a global influence on weather, its direct influence is limited only to the tropical Pacific region, and its influence on the weather in the mid-high latitude regions is indirect and complicated, according to the report.
  9. That first report doesn't make sense, muoncounter. Firstly, we have no direct evidence of temperatures going back that far, so how can it be judged the coldest in 1000 years ? Secondly, isn't the Little Ice Age meant to be the coldest period over the last 1000 years (according to proxies), i.e. 3-400 years ago ? Thirdly, wasn't there a Medieval Warm Period at various times and places, about 1000 years ago - again, according to proxies ? Overall, I bet the so-called skeptics are drooling at the possibility of this coming to pass, despite the fact that they will have to rely on the veracities of the instrumental temperature records and the proxy records, and ignore the LIA and MWP - just so they can scream : 'Ice-age is coming !' Perhaps this will be another good example of their incoherence.
  10. #9: "first report doesn't make sense" I don't expect headlines in newspapers to make sense. As you say, the headlines and blogposts that 'The Ice Age Cometh' will indeed be all over the place. Whatever happened to the old idea that Arctic melting flooded the North Atlantic with cold, fresh water, thereby shutting off the northwards-flowing Gulf Stream? Has that mechanism fallen out of favor these days?
  11. Welcome to the future... Strongest storm ever recorded in the Midwest smashes all-time pressure records Since winter storms form in response to the atmosphere's need to transport heat from the Equator to the poles, this reduced [due to global warming] temperature difference reduces the need for winter storms, and thus the models predict fewer storms will form. However, since a warmer world increases the amount of evaporation from the surface and puts more moisture in the air, these future storms drop more precipitation. During the process of creating that precipitation, the water vapor in the storm must condense into liquid or frozen water, liberating "latent heat"--the extra heat that was originally added to the water vapor to evaporate it in the first place. This latent heat intensifies the winter storm, lowering the central pressure and making the winds increase.
  12. Here's somewhere it might be worth keeping an eye on (NCAR) Attribution of Climate Events It appears to involve Peter Stott, Myles Allen, Martin Hoerling and Kevin Trenberth, so I'm guessing they know what they are talking about. So far they largely seem to be highlighting the need for more cohesive research "A clear conclusion of the meeting was that there are important research needs in developing an attribution service sufficiently reliable and timely to be applied routinely."
  13. #9: "Overall, I bet the so-called skeptics are drooling at the possibility of this coming to pass," JMurphy, you called it. Little did we know just how much drooling is going on. Here is RC reporting this story was a fraud: Coldest Winter in 1000 Years Cometh – not This claim circulates in the internet and in many mainstream media as well: Scientists have allegedly predicted the coldest winter in 1,000 years for Europe. What is behind it? Nothing – no scientist has predicted anything like it. A Polish tabloid made up the story. ... The “climate sceptics” website WUWT, noted for their false reports, takes up the RT piece, presents it together with The Voice of Russia and mentions „Mikhail Kovalevski“. Watts seems to be the bridge for the story´s crossing into the western media. And the stampede was led by the drooler-in-chief. Makes you wonder about just how the so-called 'Climategate' propagated so quickly, too.
  14. From 2010 - Global temperature and Europe's Frigid Air: 
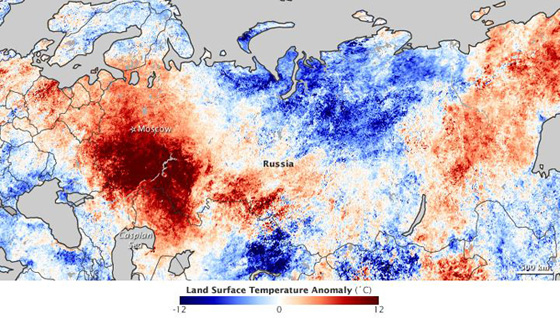
We live in a world of contrasts gone wild. In producing this map the radius of influence of a given station is limited to 250 km to allow extreme temperature anomalies to be apparent. Northern Europe had negative anomalies of more than 4°C, while the Hudson Bay region of Canada had monthly mean anomalies greater than +10°C.
  15. More news of the weird in Texas; 80+F yesterday and today (and its winter). Perry Issues Disaster Proclamation Over Wildfires The proclamation covers 244 of the state's 254 counties. Perry says lack of precipitation has dried grass and other vegetation across the state. He says the "significant fire danger" is expected to continue. And the reason 244/254 counties are in drought conditions is ... fill in the blank or see comment #5.
  16. From the disaster of US House of Representatives Climate Science/EPA hearings, some good arose: Francis Zwiers testimony Observational studies show that warm temperature extremes have become hotter since the mid 20th century, cold temperature extremes have moderated, and precipitation extremes have intensified ... ... human influence is now affecting the frequency and intensity of high impact events that put people and their livelihoods at risk. Moreover, studies of two specific events (the European 2003 heat wave, and flooding in the UK in the autumn of 2000) have shown that the odds of those events had been increased substantially relative to the world that would have been in the absence of human induced increases in atmospheric greenhouse gases. Zwiers was invited by the minority members of the committee, who issued their own memo summarizing the "background on the state of understanding of climate change science because the majority hearing memo failed to do so."
  17. Continued from here: But while the world has got hotter in the past 100 years, Nielsen-Gammon said, Texas rainfall has actually gone up by about 10 per cent. Much of it has come from more-frequent extreme rainfall events rather than a general increase in normal rain. This is the pattern that seems to be emerging: More frequent higher intensity events, rather than a monotonous increase. In the case of current droughts, long weeks and months of dry weather punctuated by heavy rain. Those 'gully washers' make the statistics even out, but mostly result in runoff rather than soaking rain.
  18. Again it would be prudent to compare what changes may be appearing now with those that confronted the Ancient Pueblo People that led to their displacement. This an excerpt from an article examining the Anasazi Collapse "Studying tree rings from 27 sites across the Southwest, Dr. Jeffrey Dean of the University of the Arizona tree-ring laboratory has found evidence of a major disruption in the area's typical rainfall. Suddenly, the customary pattern of heavy snows in the winter followed by summer monsoons had become unpredictable. Even if there was not a great drought, moisture may have been coming at the wrong times. The summer rains, so necessary to keep the spring crops from dying, were no longer reliable."
  19. johnd#18: "compare what changes may be appearing now with those that confronted the Ancient Pueblo People" An apples and oranges comparison. We have no idea how sensitive their civilization was to climate change; however, we may surmise that without air conditioning and turbo-diesel backup generators, they were more sensitive than we are. However, anthropology is hardly the topic of this thread; the pace and intensity of current climate change's impact on weather is.
  20. muoncounter at 11:28 AM, it will obviously seem an apples and oranges comparison if cause and effect are confused as you have done so. However the evidence found by Dr. Jeffrey Dean of a historical major disruption in the area's typical rainfall that I referenced, is a valid apple on apple comparison to your comments regarding present day emerging patterns, and thus also relevant to this thread.
  21. johnd#20: "cause and effect are confused ... evidence found by Dr. Jeffrey Dean of a historical major disruption in the area's typical rainfall " Confused? Hardly. No dispute that there was a disruption in typical rainfall. But from your link, Recent climatological studies by other scientists suggest that rainfall patterns were disrupted in a way that might have made the Anasazi disillusioned with their old religion. ... Suddenly, the customary pattern of heavy snows in the winter followed by summer monsoons had become unpredictable. Even if there was not a great drought, moisture may have been coming at the wrong times. The summer rains, so necessary to keep the spring crops from dying, were no longer reliable. The rain dances were not working anymore. Apples: the rain dances weren't working as they had. Oranges: heat waves, drought and wildfire; monsoons; cold winter with deep snow, meltwater floods. Tornadoes. Thundersnow. But maybe it was just like that back in Anasazi days. And so the rain dance of today, 'don't worry, nothing unusual is going on,' isn't working either.
  22. Johnd, The climate changes caused the Anasazi civilization to collapse. Is that what you want to happen to our civilization? Jahred Diamond used this as one of the examples in his book Collapse about how previous civilizations found changes in their environment too much to survive. Current changes are greater than the Anasazi had to deal with.
  23. This report provides further information to a discussion going on over on the A Convention for Persons Displaced by Climate Change thread : Interior Releases Report Highlighting Impacts of Climate Change to Western Water Resources. Specific projections include: •a temperature increase of 5-7 degrees Fahrenheit; •a precipitation increase over the northwestern and north-central portions of the western United States and a decrease over the southwestern and south-central areas; •a decrease for almost all of the April 1st snowpack, a standard benchmark measurement used to project river basin runoff; and •an 8 to 20 percent decrease in average annual stream flow in several river basins, including the Colorado, the Rio Grande, and the San Joaquin. Report available here : Reclamation : Managing water in the West
  24. michael sweet at 16:53 PM, by what measure have you ascertained that current changes are greater than those that occurred during the period being discussed? From 700 to about 1100 AD the region experienced population increases ascribed to to reliable and above average precipitation. This then changed over a very short period into what is described as the 300 year Great Drought. Given the other civilisations that apparently collapsed at about the same time, both in North and South America, also apparently due primarily to changes in precipitation patterns, perhaps the changes were more widespread. Whilst it seems a common feature of many of those earlier societies to believe their Gods were responsible for bringing the rains, hence the rituals and sacrifices, modern day understanding is of how it is the pattern of SST's that primarily determine precipitation patterns, with land use changes and deforestation further influencing regional climates. It is then not surprising that a number of different early civilisations subject to the changing conditions of the same ocean basins would have experienced similar climatic changes related to shifts in SST's and hence precipitation patterns. Interestingly, one of the more long lasting civilisations, the Mayans, developed and built complex systems of water management which perhaps are indicators of both their ongoing need to manage a vital but variable resource, and that success in doing so is necessary to ensure a society not only prospers, but survives.
  25. Responding to Eric the Red: In 1954 there were 550 tornadoes, and 36 tornado related fatalities. This compares with 1039 tornadoes to June 8th, 2011, with 525 fatalities. 1974 is a much better comparison year, but there have already been 94 more US tornadoes as of June 8th than in 1974, and 159 more fatalities. With just 75 EF3 plus tornadoes to June 8th, 2011 is unlikely, as you point out, to exceed the 121 (122?) F3 tornadoes in 1974, but the switch from the Fujita scale to the extended Fujita scale makes such comparisons tricky. None of that adresses the extraordinary quantity of tornadoes in April, with 675 confirmed tornadoes, significantly more than double the amount in April of 1974: It is also significantly more than the previous monthly record of 542 confirmed tornadoes in May, 2003: You will, of course, notice that there is a rising trend in April tornadoes, and a stronger trend in May. So, you guessed it, there is a strong rising trend in annual tornadoes as well:

1  2  3  4  Next

Post a Comment

Political, off-topic or ad hominem comments will be deleted. Comments Policy...

You need to be logged in to post a comment. Login via the left margin or if you're new, register here.

Link to this page


The Consensus Project Website

THE ESCALATOR

(free to republish)


© Copyright 2024 John Cook
Home | Translations | About Us | Privacy | Contact Us