


 Arguments


Missing Arctic warming does contribute to the hiatus, but it is only one piece in the puzzle.
Posted on 17 February 2015 by Kevin C
A new paper from scientists at the Danish Meteorological institute investigates the geographical distribution of warming over the period of the recent slowdown. Interestingly they fail to find any significant contribution from the omission of the rapidly warming Arctic from some temperature datasets. This is surprising, given that the DMI's own data, as well as the AVHRR satellite data, the major weather model reanalyses and land based weather stations all show rapid Arctic warming at a rate which should affect global trends.
We have reproduced their work and established the reasons for their result. Gleisner and colleagues fail to find the impact of Arctic warming for three reasons: where they are looking for it, how they are looking for it, and when they are looking for it. We will consider each of these questions in turn.
First: A sanity check
First let's do a very simple sanity check to see if missing out the Arctic should have a noticeable effect on Arctic temperature trends.
HadCRUT4 had on average 64% coverage for the region north of 60°N for our original study period of 1997-2012. This region corresponds to about 6.7% of the planet's surface. Therefore the missing region corresponds to about 2.5% of the planet. Eighty percent of the missing region is north of 70°N where coverage is very incomplete.
The rate of Arctic warming in the MERRA for region north of 70°N, where most of the missing coverage occurs, is 1.3°C/decade. The ERA-interim reanalysis shows a higher rate of 1.7°C/decade. (Check it yourself)
The trend for the rest of the world is much smaller. Therefore, the missing region in the Arctic alone should increase the global trend by roughly 0.03 to 0.04°C/decade. The trend in HadCRUT4 over that period is about 0.05°C/decade. So inclusion of the Arctic alone might be expected to increase the global trend by 60-80%, as illustrated in Figure 1. Gleisner et al provide no explanation for the apparent contradiction between their results and the weather models.
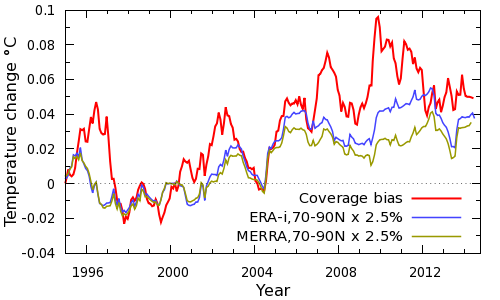
Figure 1: Global impact of Arctic warming estimated from reanalyses. The JRA-55 analysis (not shown) shows good agreement with ERA-interim.
As a check, the AVHRR satellite surface temperature dataset shows a trend of 1.1°C/decade over the larger region north of 64°N over the same period. This falls between the ERA-interim and MERRA values over the same region.
Further contributions to the difference arise from the fact that most of the missing coverage arises from land and sea ice, where warming has been faster than over the oceans. (Coverage in other parts of the planet also plays a role). This simple calculation suggests that our results are plausible. So why do Gleisner and colleagues not find any impact on global trends from Arctic warming?
The where?
Gleisner and colleagues fail to find the impact of rapid Arctic warming in three satellite datasets: two are the familiar microwave sounding data from UAH and RSS. The third is a new Radio Occultation (RO) dataset, which derives information from the delay in radio signals due to the refractive index of the Earth's atmosphere. They look for the impact of Arctic warming on global trends using this figure:
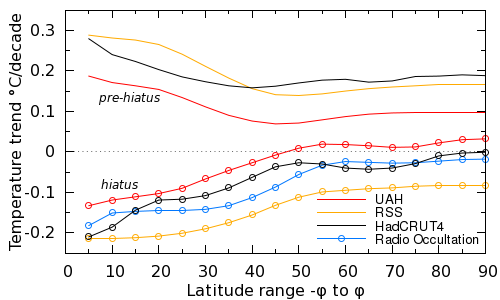
Figure 2: Temperature trend plotted against latitude range covered, with equatorial temperature trends on the left and global temperature trends on the right. The figure contrasts pre-hiatus trends (top lines) which hiatus trends (bottom lines). Replotted from Gleisner et al figure 4.
The figure shows the cumulative contribution to the warming trend from successively higher latitudes in the various temperature datasets. So on the left, we have temperature trends for a narrow band of the planet around the equator. On the right are temperature trends for the whole planet. They consider two periods - a pre-hiatus period showing high trends (lines) and a hiatus period showing low or negative trends (lines and points).
Let's concentrate on the satellite data for now (i.e. the colored lines). If Arctic warming makes a significant contribution to global trends, the lines should curve upwards at the right hand edge of the plot. But they don't. The high latitudes do not make a significant difference.
But this should not have been a surprise. Rapid arctic warming is known to be a near surface phenomena; warming above the surface is more moderate (Simmons and Poli, 2014). This is also an expected fingerprint of sea-ice related feedbacks of Arctic amplification (Screen and Simmons, 2010; Serreze and Barry, 2011; Cohen et al., 2014). (This may also explain why the CW14 UAH-hybrid reconstruction does not capture all of the Arctic warming demonstrated by some weather models.)
As a simple check we can look at the trends in the ERA interim weather model on the hiatus period for the region north of 70°N. As we noted before, the surface (2m) trend on 1997-2012 is 1.7°C/decade. However if we go up 3km into the atmosphere to the 700mb level, the trend drops to only 0.02°C/decade. (Check it yourself)
In other words, by looking at the satellite data they were looking in the wrong place.
The how?
When we calculate a temperature reconstruction we don't know what the right answer is. As a result we need a way of testing whether our methods are valid in order to determine whether we can trust the answers. The methods need to be validated. Validation tests made up the bulk of our original paper.
One of the tests we used was adopted from the HadCRUT4 analysis, and involved testing the how well our temperature reconstruction could reproduce a known global temperature map from incomplete data. The same test can be applied to the Gleisner temperature reconstruction.
As a starting point, we need a set of globally complete surface temperature maps. These don't have to correspond to reality (although it is helpful if they do). For this purpose we'll use temperature data from the MERRA weather model, a conservative choice because it shows the slowest Arctic warming.
The validation test works like this:
- We take the globally complete temperature map for a month, and calculate a global mean temperature. This is our 'right answer'.
- Next we throw away data until the coverage matches the actual observations. (For our calculation we also separate the data into land and ocean maps.)
- Now we calculate reconstruct a temperature estimate from the reduced data, using just the cells where there are observations (the HadCRUT4 approach), or averaging in latitude bands (the G15 approach), or by kriging the land and ocean data (the Cowtan and Way approach).
- Finally we compare all the reconstructed temperatures with the right answer from step 1. The difference between the estimate and the right answer is the error. We repeat the calculation for each month and take a root-mean-squared average of the errors.
For the purposes of validation, lower errors indicate a better reconstruction.
The Gleisner temperature reconstruction involves taking the average of all temperatures present in a given latitude band, and then averaging the temperatures of the bands as if they were complete.
The errors in the different reconstructions by month are shown in Figure 3. The impact of coverage bias is visible as a decline around 2001 in the HadCRUT4 method. This bias is somewhat mitigated in the Gleisner method but with only a small reduction in error. The errors are significantly reduced by kriging, consistent with the results of Dodd et al. (2014).
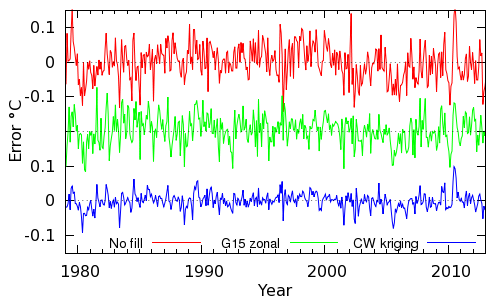
Figure 3: comparison of the errors in reconstructing the MERRA temperature field using no infilling, the Gleisner et al zonal method, and kriging.
The root means squared errors are given in the following table.
| Method | RMS error |
|---|---|
| HadCRUT4 (no coverage correction) | 0.051 |
| Gleisner et al (zonal) | 0.043 |
| Cowtan and Way v2 (kriging) | 0.024 |
The Gleisner method, despite its simplicity, does produce slightly better results than the HadCRUT4 approach of ignoring missing cells. Kriging significantly outperforms either approach, halving the error in the estimated temperatures in comparison to the HadCRUT4 method.
If we include all three temperature reconstructions in the latitudinal temperature plot, we obtain Figure 4.
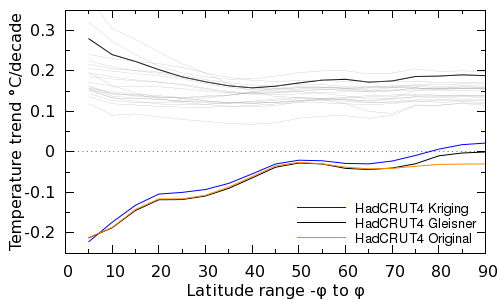
Figure 4: As Figure 2, but comparing three different reconstruction methods: The original HadCRUT4, the Gleisener et al. approach and kriging (bottom lines). Pre-hiatus trends (top lines) are shown for the Gleisner et al. hiatus start date (black line) and for start dates in the range 1968-1988 (thin grey lines).
When the temperature trends from the Gleisner analysis are compared with HadCRUT4, their reconstructed global trends are higher than for HadCRUT4, and the difference is at high latitudes. However the impact of coverage is certainly smaller than reported in our analysis. The increase in hiatus trends is rather more substantial using the kriging calculation. The increase covers the whole latitude range, however it is greatest at high latitudes.
One other feature is shown by the thin grey lines in Figure 4. The Gleisner pre-hiatus period is rather unusual in that the chosen start date produces both fast global warming, and very fast tropical warming, compared to other choices of start date. This seems to be due to their pre-hiatus period starting in a cool La Niña year and ending in warm El Niño year.
So Gleiser and colleagues do find an Arctic signal in the surface data, but it is smaller than we would expect. Some of the discrepancy is explained by the simplicity of their temperature reconstruction method, but not all of it.
The When?
The final reason that Gleisner et al do not find much impact of coverage bias concerns when they are looking for it. Let's take a look at the latitudinal trend plot once more, this time looking at the study period from our paper, i.e. from 1997 to 2012. This period is shown in Figure 5:
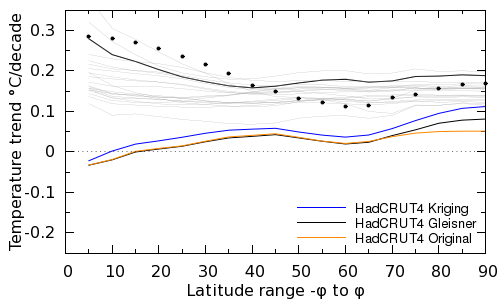
Figure 5: As Figure 4, but with the hiatus trends (bottom) covering the period since 1997-2012 (as CW14) rather than 2002-2013. The black points show the G15 method applied to the period 1999-2010 when the ENSO trend is inverted with respect to the period 1997-2012.
Over this period the impact of coverage bias is indeed rather greater. Our reconstruction accounts for at least half the difference between the hiatus and pre-hiatus trends for all but two choices of start year for the pre-hiatus period. The Gleisner et al approach also picks up most of the Arctic component of the coverage bias.
We already suspect that the shape of the curves for the pre-hiatus period depends on the El Niño trend over the study period. Does that apply to the hiatus period as well? We can test that by taking a period with a positive El Niño trend from within the hiatus period, for example 1999-2010. The results are shown by the black points in Figure 5 using the Gleisner et al temperature reconstruction. The trends over this period look much more like the pre-hiatus trends, apart from the uptick due to rapid Arctic warming. That's an interesting result for further study.
The final reason Gleisner et al don't find much role for coverage bias during their hiatus is their choice of study period. By 2005, coverage bias is largely established, and so while it biases the temperatures after that point, it has rather little impact on the trends.
Discussion
We agree with many of the points raised by Gleiner and coauthors. The authors state that:
"omission of successively larger polar regions from the global-mean temperature calculations, in both tropospheric and surface data sets, clearly indicates that data gaps poleward of 60° latitude can not explain the observed differences between the hiatus and the pre-hiatus period"
And we agree. In our original briefing document we stated:
"To interpret the 16 year trend, it is necessary to take into account all of these factors, including volcanoes, the solar cycle, particulate emissions from the far East and changes in ocean circulation. The bias addressed by this paper is just one piece in that puzzle, although a largish one."
On the last point our only disagreement with Gleisner and colleagues arises from the choice of research question. In seeking to explain temperature trends post-2002, coverage bias does play a more limited role in the temperature trends. However, we suggest that even over this period Gleisner and colleagues' conclusions arise from a combination of the use of tropospheric datasets which cannot observe Arctic surface warming, and upon a surface temperature reconstruction which shows only limited skill in validation.
However in seeking to explain trends back to the late 1990s coverage bias is more significant. Further, if we wish to explain model-observational divergence, ignoring the role of coverage bias leaves an unexplained offset between the models and observations which is already largely in place by the start of the Gleisner study period. In our view, analyses that take into consideration the full range of observed and physically-valid contributions to the rate of warming (e.g. Schmidt et al. 2014; Huber and Knutti 2014) represent our best understanding of the the evolution of modeled and observed trends.
Data and methods for our analysis are available here. Our full response, sent to Gleisner et al in January 2015, is available on our updates page.
For context, there have been other discussions of our work in the literature. In our view the most important is Simmons and Poli (2014), which provides a comprehensive investigation of recent Arctic warming.


Very interesting discussion, Kevin!
As was mentioned in the comments on the other thread, the fact that the months with powerful Arctic blasts into lower latitudes (for example February and November 2014) produced a dip in the global average should indicate a very real cool bias due to not properly measuring the changes in Arctic heat. In other words, cold Arctic air flows south where we properly measure its cooling impact, but due to poor Arctic coverage, the impact of the heat flowing north is not properly measured in the Arctic, causing a cool bias due to the shuffling of air masses in the NH.
We know that surrounding air temperature pretty much stays unchanged when ice is melting. Could the heat partly hide from the measurements by being used to melt sea ice rather than heat the surrounding air?
The ice melting question is slightly different, although it's worth clarifying.
Ice melting/freezing anchors arctic air temperatures at around 0C for most of the summer. So the rapid Arctic warming we've seen is purely a winter phenomena. If you plot the Arctic temperature trends for winter alone, the trends are even higher than when looking at the whole year.
Having said that, since 2012 temperatures have stabilised or retreated a little. I don't think we're seeing any kind of tipping point or runnaway event in the Arctic.
Thanks Kevin,
Just a question re-figure 2 and those related.
At first glance it seemed to be showing the decadal warming at different latitudes and was thus surprising that there is no polar tick as you say in both pre and hiatus periods, for both poles are warming reasonably rapidly, as you say, the Arctic up to ~1.7C/decade.
Then it dawned on me that each segment is actual the temperature trends for each degree of latitude North and South of the equator, so the 10 point represents the region between, 10N to 10S, 20 represents 20N to 20S and so on, and thus by the time you get 90N to 90S, you have the entire globe and therefore the post-hiatus period is showing little to no global warming overall.
However it seems there is a marked cooling trend in the post hiatus equatorial region (rising at 0.3C to falling at 0.2C figure 2), so quite a shift in trend of -0.5C in a decade or so, which I presume is mainly due to the La Nina predominance and increased oceanic heat uptake in the tropical regions.
And despite this marked tropical cooling trend the overall globe isn't cooling it is slightly warming figure 2. It does seem as if the regions from 20-50 N/S latitude make the majority of the contribution (~0.2C decade) and then there is a dipped line from 50- 70N/S suggestive of a cooling region (in keeping with cold NH winters recently) and then a further upturn to zero by 90N/S (~0.02decade) looking at the Hadcrut black line.
Which for me sort of implies that the Arctic contribution is there, and quite significant, and in keeping with you estimate of 0.03 to 0.05C (on the Kriging line it seems like definitely 0.05C per decade (figure 4)).
Therefore for me the graphs seem to imply that there has been a very strong cooling influence the tropics and from 50-70N/S (the dip on the graph) and warming influences between 20-50N/S and from greater than 70N/S.
Therefore if that is the case the Arctic tick is there and significant it is just lost in a graph whose horizontal scale is cumulative rather than representative of a specific regional areas (the maximum the Arctic can influence the global temperature is 0.05C per decade as you say and that is what it seems to do).
Is that right or have I missed something?
It would be interesting to see a plot of 10 degree slices, i.e. 10N to 10S followed by 10-20N and 10-20S and so on; wonder if that would allow the Arctic trend to be seen a lot more readily?? Or to plot it the other way round, from 90 to 0, where 0 N/S is the whole globe to see the tropical influence on the whole globe more?
If these trends of much faster warming in the Arctic than in equatorial regions continue, at what point do we reach an essentially equable climate for the Northern Hemisphere? What would happen between now and then wrt the Hadley cells? What will be the effects on the ground of these shifts?
Ranyl: Yes, I think you've got the gist of it. I guess you'd call it a cumulative zonal trend plot. The uptick in the last 30 degrees on the right is the Arctic contribution to the global trend. Given the tiny area concerned, you would expect it to be flat. But it isn't, even in the Gleisner reconstruction, showing that the Arctic is playing a role.
The difficulty with the non-cumulative version is that the affect of the different areas of the zones is lost, unless you choose equal area zones.
Wili: We've seen examples of rapid Arctic warming like this in models, but is is never longlived. That suggests we shouldn't expect the trend to continue. And indeed the last two winters support that expectation.
Kevin,
WRT your response above, the ARC for 2014 showed that 2013 was near the record high warming (fig 1.1) http://www.arctic.noaa.gov/reportcard/air_temperature.html
and the DMI has winter 2014 as near record high as well. Please explain?
In the article, the paragraph just prior to Fig. 3 starts "The errors in the different reconstructions by month are shown in figure 2", but should be "... in figure 3."
The paragraph just prior to Fig. 4 starts "If we include all three temperature reconstructions in the latitudinal temperature plot, we obtain figure 3", but s/b "... obtain figure 4."
The second paragraph after Fig. 4 starts "One other feature is shown by the thin grey lines in figure 3", but s/b "... in figure 4."
The paragraph just before Fig. 5 ends with "This period is shown in figure 4:", but s/b "... in figure 5:"
And in the second paragraaph after Fig. 5, the fourth sentence starts "The results are shown by the black points in figure 4 ...:, but s/b "... in figure 5 ..."
Thanks for the response, Kevin. "We've seen examples of rapid Arctic warming like this in models, but is is never longlived. That suggests we shouldn't expect the trend to continue"
So, do we have any idea what drives periods of greater rather less rapid Arctic warming? If we don't, how can we know that this is really something cyclical, especially with all the added forcings and feedbacks of our ever wierder global wierding?
By the way, I see that temperatures north of Norway now reach into the 40s F (5.5 C). earth.nullschool.
Ribwoods: Fixed, thanks. (Figure 1 was a late addition)
jja: The Arctic report card doesn't go into the methodology in detail, but an average to 60N will be dominated by the stations in the 60-70N band. ERA-i, JRA, Berkeley Earth and ourselves all show less extreme temperatures on the region N of 70N in 2013.
wili: That's something we're hoping to look into, but haven't had a chance to yet.
For those, like me, who clicked the "Check it yourself" links and came back with a well-scratched head, wondering why both links go to the same place, and what to do with this amazingly complicated looking, scrollfest of an interface anyway? ... the instructions are in a tooltip that shows if you hesitate over "Check it yourself" for long enough before clicking; a fortunate but accidental discovery in my case. ;-) Reading tooltips while clicking widgets on a different page is for magicians so here are the instructions ...
For the ERA-interim reanalysis rate of Arctic warming in the region north of 70°N : Select ERA or MERRA (show/hide) — click temperature/2m (radiobutton) — click "Select Field" (button) — fill in latitudes 70N-90N — optionally click "convert to Celsius" (radiobutton) — click "Make time series" (button).
If I did it correctly, this should be a direct link for ERA.
LINK
And for MERRA
LINK
For the trend "3km into the atmosphere to the 700mb level" it's almost identical to the above : Select ERA (show/hide) — click temperature/700mb (radiobutton) — click "Select Field" (button) — fill in latitudes 70N-90N — optionally click "convert to Celsius" (radiobutton) — click "Make time series" (button).
LINK
However, if the results are supposed to draw the trend or and give a value, I've no idea what I missed. :-/
[RH] Shortened links that were breaking page format.
If there's a way to get the trend in KNMI, I haven't found it either. Click 'raw data' above the third graph and copy it into a spreadsheet. The lack of 700mb trend you can see by eye though.
Thanks Kevin.
Kevin, thank you for your reply, sorry for the late response. The DMI data that I was referencing is the "north of 80N" series found here:
http://ocean.dmi.dk/arctic/meant80n.uk.php
Thanks to Firgoose for working out those links. I was also scratching my head after first clicking on the Check It Yourself links.
Another head-scratcher for me: does it seem like this article consistently misreports temperature trends by a factor of 10? For example, "The rate of Arctic warming in the MERRA for region north of 70°N, where most of the missing coverage occurs, is 1.3°C/decade. The ERA-interim reanalysis shows a higher rate of 1.7°C/decade." Global warming trends are about 0.17°C/decade, right? Maybe, I'm misunderstanding what's being reported here.
No, the trends N of 70N really are around ten times higher than the long term trends for the planet as a whole. That is how 2.5% of the planet can influence the global trend. That may seem incredible, but it is confirmed by us, Berkeley, all of the reanalyses and AVHRR. GISTEMP capture most of it, albeit with poorer coverage and some other problems.
And actually so does the Gleisner reconstruction, despite the fact that they say they can't find it - that was a bit strange.
gregcharles: the articles doesn' t misreports T trends. Look at the right end (right because the graph is cumulative) of fig.5: original data from HadCRUT4 (yellow line) shows for the period 1997-2012 a trend of 0.05 °C/decade (less than 0.017) as reported in the article before fig. 1 "The trend in HadCRUT4 over that period is about 0.05°C/decade". Now, there are two facts: the artic trend alone is much higher (approx. 1.5 °C/decade) and the surface of the artic region is roughly 1/10 of the global surface with only a partial coverage from HadCRUT4. Consequently including the "missing region" of the artic in the global trend this will increase, adding 0.03 or 0.04 to 0.05 to, up to 0.08/0.09 (see black line on the right end of fig.5). The "missing region" is (quote from the article) due to "HadCRUT4 had on average 64% coverage for the region north of 60°N ... This region corresponds to about 6.7% of the planet's surface. Therefore the missing region corresponds to about 2.5% of the planet"
0.36 x 6.7% = 2,41%% or roughly 2.5%
and 1.3 °C/decade x 2.5/100 = 0,03 °C/decade (for 1.7 the contribution is 0.4).
I hope (if I'm right, if not someone will correct) to have been clear.
Sorry I wrote 0.017 instead of 0.17
...and now I see teh short answer from Kevin C.
Regarding Gleisner in Fig. 5 they found the arctic influence to global T trend, because on fig. 5 the difference from original HadCRUT4 data (yellow line) and Gleisner (black lien) starts from latitude > 70 N.
Additionally Kriging (blue line) increase the global T from 0.08 up to apporx. 0.11 but (comparing to Gleisner trend) with a visible contribution (approx. 0.02) coming from latitude < 70
I am obviously not a scientist. I am just an average working person, but I do have a few questions. Please don't think that I am trying to be facetious in anyway, but I cannot help the fact that "Man Made" Climate Change Scientists come across (to me) as being quite intellectually arrogant (perhaps for good reason). So, based on the fact that we all are standing on thin, broken slabs of earth floating on a massive ball of molten rock, here are my questions:
Again, I am not trying to be rude or disrespectfull in any way, these are just questions an average person would like to have a scientist responde to. I see alot of data and numbers in the comments on here. Alot of talk about trends, averages, and percentages. But it all seems irrelavent in relation to this huge planet, with all its tremendous power, and with all the monumental changes over billions of years. Continents moving and colliding, ice ages, seas of boiling sulfer. I mean, it just comes across as almost unintelligent to think that man could possibly have any influence at all. I do believe in Climate Change because, well...., the climate changes and has been for longer than 200 years. And I didn't even need to be a scientist to know that.
Regards,
Daniel
[RH] Welcome to Skeptical Science! There is an immense amount of reference material discussed here and it can be a bit difficult at first to find an answer to your questions. That's why we recommend that Newcomers, Start Here and then learn The Big Picture.
I also recommend watching this video on why CO2 is the biggest climate control knob in Earth's history.
Further general questions can usually be be answered by first using the Search function in the upper left of every Skeptical Science page to see if there is already a post on it (odds are, there is). If you still have questions, use the Search function located in the upper left of every page here at Skeptical Science and post your question on the most pertinent thread.
Remember to frame your questions in compliance with the Comments Policy and lastly, to use the Preview function below the comment box to ensure that any html tags you're using work properly.
I just noticed that link to the biggest control knob video is old. You need to go here now to view that video.
drebich @19, your questions are nonsensical.
Taking the first question, sea levels change regionally due to changes in wind circulation and ocean heat content. On top of that, there are tides, waves, and storm surges, all of which contribute to a very variable local sea level. Finally, different shores are rising, or falling due to plate tectonics, and in some locations, due to an ongoing rebound from the melting of the massive ice sheets of the last glacial. Consequently, while taking an average of a globally distrubuted collection of tide gauge measurements can unequivocally show that sea levels have rising at a rate inconsistent with the planet not warming (see graph below), no mark on a beach can plausibly be a demarcation point, unless set high enough that it will not be passed for several decades.
Your second question makes even less sense in that you want a demarcation point between ice age and global warming from sea ice. That is a nonsense request as, first, the cause if ice ages is the spread of ice sheets on land, rather than the sea ice itself; and second because we have just come of 10,000 years of interglacial (colloquially, not an ice age) which was not a period of global warming, let alone anthropogenic global warming. While the history of sea ice in the NH unequivocally shows the current dearth of sea ice to be astonishing (absent global warming) and unprecedented in recent times (see graph below), there is no limit such as you illogically ask for.
Your third question, unfortunately shows that your post is an entirely rhetorical excercise. That is unfortunate because, allowing for a small middle range, it is the most easilly answered. The fact is that Global Mean Surface Temperature (GMST) has not recently varied greatly with time. Over the last 10, thousand years, the temperature range has been about 1 C, yet we in the last century have seen the temperature rise from near the lowest value in that period to probably the highest:
Again, this rate of temperature increase is unprecedented over the last 10,000 years and probably over the history of the Earth. Further, that temperature keeps on rising, with new records for GMST having been set in 1973, 1980, 1981, 1987, 1988, 1990, 1995, 1997, 1998, 2005, 2010, and now 2014 (GISS LOTI, other indices will vary slightly), ie, on average once every four years over the last forty odd years. (In contrast, the last cold record GMST was in 1909.) If that average rate of new records is maintained, then we have global warming. If temperatures fall below the 1970s average without major volcanism, a nuclear war or a massive asteroid bombardment, then global warming has stopped. The evidence currently certainly indicates continuing global warming.
drebich... No offense intended here, but each of your questions is about what "should" each of these aspects of the climate system be. That's an irrelevant question. The problem is related to the rate of change that is being caused by human CO2 emissions and how those change will impact natural and human systems.
But, please do take the time to read through the relevant materials to fully inform yourself before coming to a firm conclusion one way or another. The science is there, it's very well established, and scientists have a very high degree of certainty that continuing on the emissions path we're on through the 21st century would bring with it severe consequences.
Drebich,
When you start your post off with "Please don't think that I am trying to be facetious in anyway" and then say "any higher, Man Made Global Warming, any lower,.....well....Man Made Global Warming" you come across as facetious, rude and disrespectfull. Perhaps you need to check your posts before you post them. If you cannot abide by your own post why don't you just go away?
[PS] Would anyone else tempted to comment here please note the "no dogpiling" rule in the comments policy. I think Drebich has been given enough to think about already and will hopefully use the resources to become better informed.
Thank you Rob Honeycutt, your reply was very polite and not condescending in any way. I truly appreciate that.
As for Tom Curtis and Michael Sweet, not only were your replies rude, condescending, and insulting, they simply didn't answer any of my questions. The earth is approximately 4.5 Billion years old (and I would have to take an un-educated assumption that it may not be in it's final state), yet you post your charts and graphs and reference the last 10,000 years (or even the last 200 yrs).
As a Scientist, do you actually feel comfortable using such a miniscule segment of time for your conclusion, totally disregarding the immense changes that this planet continues to exibit? Are you telling me that you alone have decided that the planet earth is in it's final state. That the big blob of molten rock that we are floating on has absolutely no impact on climate change, or our CO2 emissions have more affect on the planet than the huge blob of molten rock?
And Michael, I used the term "Man Made Global Warming" in order to distinquish between "Global Warming" which many people do believe is happening.
Guys, I know this is beneath you, but these questions may be very important for you to be able to answer if your goal is to convince an uneducated majority to accept your findings and predictions. I'm not asking these questions to get under your skin, I'm asking them to see if you have answers, none of which either of you have been able to deliver on.
Best Regards,
Daniel
[PS] Daniel, please, please, please read the actual basics of the science you are questioning. Extremely uninformed questions that attack the science does not help and results in poor responses. Start with the "arguments" link top left and if you have issues with the explanations there, comment in the appropriate place. Simply repeating tired old arguments like "climate has changed before" or "it's geothermal heat" without evidence to support them is sloganeering and will be deleted.
drebich @24:
1) You accuse me of being "rude, condescending, and insulting" because I correctly noted that your questions were nonsensical. They are nonsensical because you make assumptions in the framing of the questions that are simply false. Thus, you assume that there is a value for sea ice extent such that if sea ice extent is greater than that, that implies we are heading for an ice age, while if lower we have strong anthropogenic. There is no such value. Pointing out that the question is nonsensical is no insult unless your value as a person lies entirely in your possessing, or not possessing, the relevant specialist knowledge. Put simply, you asked "bullshit questions" because you do not know enough on the topic. In that context, the only correct response to to point out that they are bullshit questions, and why (as I have done).
However, as you raise the topic of rudeness, just how polite do you consider these comments:
They strike me as being very rude, and hence your concern about your own percieved slights as more than a little hypocritical.
2) Even more hypocritical is your response to my explaining why your questions are nonsensical. You write:
Yet each of your three questions required a single value of a variable assessable now. So a single years data (or at most a decade) according to your questions is all the information you need. But when presented with far more than that - it is not enough because of the tremendously long history of the Earth. From this inconsistency, that only a years data is purportedly enough but much more than a years data is rejected as not enough, it looks very much like your questions are a con. That is, your intent is entirely rhetorical.
Well, I guess we knew that already, given the way you framed your third question.
That impression is further reinforced by your strawman fallacies ("the planet earth is in it's final state"), and your assumptions about what I base my views on (hint, it is not solely the data I considered relevant to your specific questions).
3) Finally, you seem to think the geothermal heat from "the big blob of molten rock that we are floating on" has more impact than CO2. In that you are wrong. That is one of the many factors of climate that climate scientists have analyzed but spend little time talking about because it is inconsequential. Of course, some aspects of the Earth have major consequences for climate. The presence of a land mass over the South Pole, entirely surrounded by water; the existence of extensive continuous land masses in the Northern Hemisphere from 30 - 66 degrees latitude; the lack of a channel between the tropical Pacific and tropical Atlantic, or tropical Atlantic and tropical Indian Oceans; even the rate at which the African continent is moving north - these all have very large effects on the current climate state. Climate scientists, however, spend little time talking about them publicly because in terms of change in climate over a few centuries, they are essentially fixed features and have no effect on that time scale (however large an effect they have over 100 of thousands to millions of years).
Finally, it is a waste of our time to try and answer the questions of a person too ignorant to ask sensible questions, and too arrogant to recognize that is the case. Certainly such a person will never be convinced no matter what our answer.
[PS] Tom, please stick to answering the science - you are very good at that. This comment is at limit of civility and only stands because I do agree with the sentiment and can only hope drebich will bother to learn enough to ask sensible questions in future.
Dear Daniel,
Let me try and explain the response to your question.
When my daughter was 3, she found an illustration of Isaac Newton sitting under and apple tree. "What's he doing?" she asked.
I replied "He's sitting under an apple tree. An apple has just fallen on his head. He says 'Why did that happen?'".
My daughter immediately answered "Because it was ready to eat!".
In a sense, she was right. The apple fell because it was ready to eat. But at the same time, she had completely missed the scientific point of the question. Why did the apple accelerate downwards at approximately 10m/s2?
When we try to talk about science in natural language, or worse, to think about science in social and ethical terms, we completely miss the point. And trying to do science in these terms leads to nonsense conclusions - a classic example would be the work of Gerald of Wales.
Similarly, when you ask 'what should the temperature be?', your language is a strange conflation of scientific and ethical concepts. Temperature is completely uninfluenced by moral imperatives. There is no 'should'. The fact that you can construct a grammatically valid question, does not mean that that question makes any sense.
So when you ask a scientist a question like this, they'll either look at you as though you have a fish in your ear, or assume you are trying to ask a different question, or assume you are playing dishonest word games. Unfortunately in this case there used to be a particularly annoying troll who used to ask the same kind question on every single climate discussion for several years, hence a more negative response than you were expecting.
So what question are you trying to ask? If I were to make a guess, then I'd put it something like this:
The first three of these are scientific questions. The fourth spans scientific, social and economic spheres. The final is a moral and political question. This website is concerned primarily with the scientific dimension.
Daniel,
I simply pointed out the inconsistancy in your questions. If you find that rude, condescending, and insulting perhaps you need to ask better questions. When your posts are rude, condescending, and insulting people tend to reply in the same way. If you are polite you get polite answers.
For complete information to everyone reading, Daniels original post was deleted by a moderator for sloganeering. He reposted it and the new moderator has let it stand. If your posts are deleted that means you are not polite enough for this venue.
[JH] I deleted Daniel's (posting as drebich) intital post because it was "off-topic sloganeering." If I had seen his repost of it before other commenters had responded to it, I would have deleted it again for the same reason. Concern trolls such as Daniel/drebich need to know that conformance with the SkS Comments Policy is not optional.
Daniel, just read one thing--one little piece: paleoclimatology. Understand that many of the same people who are supporting your claim of 4.5 billion years are also people working on climate. The information they produce is integrated into the overall understanding of Earth's climate. It seems ridiculous that you would assume 4.5 billion years and then claim that paleoclimatology has not informed study of the present day climate. It seems that way because to everyone posting here it is obvious that paleoclimatology is an integral part of the study of climate.
Also, if you want the science communicated to the general public more effectively (I assume you do, else why come here?), could you say a bit more about how you came to your current understanding of the study of climate, please?
Daniel... I have no way to determine your intent with these questions, but if you're going to come here with genuine questions about climate science, you can't take a stance of "scientist have to..."
There's a well understood aspect of science: It's true whether or not anyone likes the results.
Tom and Michael actually did a very good job of explaining the science, regardless of whether you appreciated their tone. They showed you very clearly what the research shows us. It's not required that you understand it, nor even that you read it, for it to be correct.
The reason I suggested that you go back and read some of the basic materials here on SkS is because you're asking very very elemental and antagonistic questions. You need to fully inform yourself first, before you have cause to state what scientists need to do.
Climate science is a very complex subject backed by 150 years of research consisting of well over 100,000 research papers, produced by over 30,000 scientists. When you come upon some aspect of the science you don't understand, look it up. Find out why scientists are saying what they're saying. And if you still don't understand, ask questions. SkS is a great place to find answers. But you don't even have to trust us. If you still don't understand something, see if you can find one of the actual climate researchers. Send them a polite email with your question. I've found they're usually eager to explain their field of research with those who are willing to listen.
Daniel... And really, do watch the Richard Alley video I posted earlier. You'll get a sense of both how complex the subject is and why scientists understand what they understand.
RH wrote: "Climate science is a very complex subject..." Very true if one is talking about the whole thing with all the details. But the essential elements are fairly straight forward (though I'd be more than happy to be corrected on any of them if I get something wrong):
1) CO2 is a greenhouse gas--it acts as a kind of blanket keeping heat from escaping into space; established some 150 years ago; very basic science.
2) We have dumped and we continue to dump lots of extra CO2 into the atmosphere, mostly from burning fossil fuels--coal, oil and methane. (Are we up to 38 billion tons CO2 a year now?)
3) Not surprisingly, given #2, concentrations of CO2 in the atmosphere have risen by about 40% since pre-industrial times: from about 280 parts per million to about 400 ppm now--we are making the
'blanket' much thicker.
4) Also not surprising, given #s 1,2 and 3, global temperatures have increased by over .8 degrees C (about 1.5 F).
Those are the basics. And every step is (or should be) completely un-controversial and well established. Everything else is complications that those who don't understand the science should trust that scientists actually do know something about them. And they have pretty much all come to the same conclusion.
I think the mods got it right that 'Daniel' was trolling here, so he is not likely to be persuaded by anything anyone says. I don't know how one persuades people who are not really interested in being persuaded. But I think it is useful to lay out the bare essentials of the situation (as others also tried to do), since those are fairly straight forward.
But getting back to the Arctic and the 'pause'--We've lost something over 10,000 cubic kilometers of Arctic sea ice, most of it in the last 20 years. Wouldn't that change of state suck a lot of energy out of the system?
wili @31, good comment.
On topic: yes but not relatively.
Specifically, the first factor is that the September loss is a seasonal loss. All the energy used in the ice melt is given back when the ice refreezes. Therefore the relevant factor is the loss in ice at the winter maximum. Based on the Piomas trend, that means we have lost around 9.72 thousand km^3 in the 36 years from 1979 (or 10,000 km^3 if you just take the difference between the end points). Further, this has been partly countered by the growth in sea ice in the Antarctic, although no direct comparison is possible as we lack reliable volume estimates for the Antarctic.
Secondly, taking just the Arctic values, the approx 10 trillion cubic meters of ice lost requires 334 x 10^15 Joules to melt, which is a lot. However, over 36 years, that represents only 3 x 10^8 Watts, and just 5.9*10^-7 Watts per meter squared averaged over the Earth's surface. Relative to other places the heat is going, that is inconsequential. The melting of glaciers and ice sheets has a far larger impact, but still small relative to the increase in Ocean Heat Content.
PS inline @25, I take it you objected to my quotation of a term from the video to which I linked. If you watch the video (unfortunately of poor quality), you will see that term in context is not offensive, and explains the problem also exhibited by drebich's three questions in very simple terms. I could, of course, have used the more conventional term for that type of question, calling it a "trick question". That, however, would imply that trickery was involved - something of which I am not yet convinced. As a side note, I highly recommend you take the opportunity to watch the movie from which the video came ("My cousin Vinny") should it present itself. Very entertaining.
On a side note, and related to to drebich's questions, I suggest he read David Brin's essay, "Defining Climate "Deniers" and "Skeptics"", available on his blog. I remain hopefull that he is an ill-informed skeptic. Reading Brin's essay will make it clear to him why he is so easilly taken for a denier instead.
To get back to the subject, I've now added a time series and map series for the Gleisner et al temperature reconstruction, as well as code for you to produce it for yourself. It's at the bottom of this page, accompanied by appropriate health warnings:
http://www-users.york.ac.uk/~kdc3/papers/coverage2013/series.html
The Gleisner reconstruction shows faster warming over the hiatus period than NASA, NOAA or Hadley, and the rate of Arctic warming agrees well with us, Berkeley and the reanalyses:
So it captures the Arctic warming quite well. The poor performance in validation arises because it is not doing a very good job of capturing the impact of coverage over the rest of the planet.
Kevin C,
Those are the annual averages, do you have the DJF extractions that you can post? Both 2013 and 2014 summers were below the average.
It is possible to have a graph with the same data as the last graph but covering latitude 0-70?
Because I see that Gleisner method is performing quite well on Arctic lat. (see fig. 4 and 5 looking > 70N) but the conclusion of their article curiously is that "the dominating causes of the global temperature hiatus are found at low latitude".