


 Arguments


How much did aerosols contribute to mid-20th century cooling?
Posted on 16 September 2010 by dana1981
There was a very slight cooling in the average global surface temperature from about 1940 to 1975. Although the global temperature only decreased by approximately 0.1°C, this period represents a divergence from the warming periods of 1915 to 1940 and 1975 to Present.
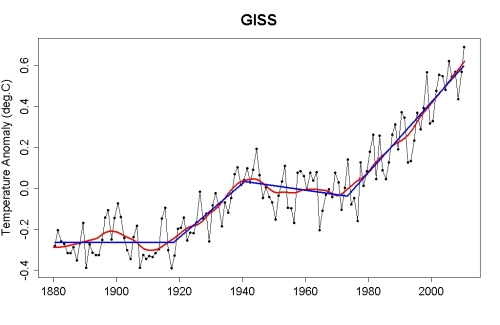
Figure 1: Global temperature anomaly and distinct linear trends over the 21st century (Open Mind)
Climate scientists believe that the primary cause of this mid-century cooling was an increase in atmospheric aerosols due to anthropogenic emissions (primarily from the burning of fossil fuels). Aerosols have a complex effect on the climate, because they have both direct and indirect impacts.
Direct Effect
The direct effect of aerosols on climate is the mechanism by which aerosols scatter and absorb shortwave and longwave radiation (a.k.a. "global dimming"), thereby altering the radiative balance of the Earth-atmosphere system. The key parameters for determining the direct aerosol radiative forcing are the aerosol optical properties and distribution in the atmosphere (IPCC 2007).
Indirect Effect
The indirect effect of aerosols on climate is the mechanism by which they modify the microphysical and, therefore, radiative properties, amount, and lifetime of clouds. A key parameter for determining the indirect effect of aerosols on the global surface temperature is the effectiveness of an aerosol particle to act as a cloud condensation nucleus - a function of the aerosol size, chemical composition, mixing state, and ambient environment (IPCC 2007).
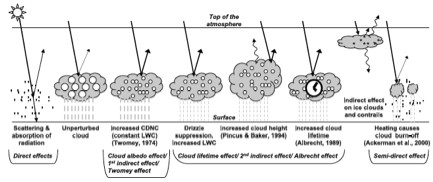
Figure 2: Diagram of direct and indirect aerosols' radiative mechanisms (IPCC 2007)
Radiative Forcing
We can attempt to quantify the impact of anthropogenic aerosol emissions on the average global temperature by first examining the associated radiative forcing. The radiative forcing is a measure of the influence that a factor has in altering the balance of incoming and outgoing energy in the Earth-atmosphere system.
According to the IPCC, the total (direct + indirect) radiative forcing due to anthropogenic aerosols could range anywhere from -0.4 to -2.7 Watts per square meter (W/m2), although the most likely value is -1.2 W/m2.

Figure 3: Radiative forcing from various sources in 2005 as compared to 1750 (IPCC 2007)
The aerosol radiative forcing, particularly the indirect cloud albedo effect, is the largest source of uncertainty among all anthropogenic radiative forcings. However, keeping the range of possible values in mind, we can still estimate the cooling effect caused by these forcings during the mid-20th century. The majority of the increase in atmospheric sulfates occurred during this period:

Figure 4: Atmospheric sulfate aerosol concentration in parts per billion (ppb) from the GISP2 ice core (black) vs. anthropogenic sulfate emissions (red) since 1800 (Open Mind)
The general natural baseline is around 30 ppb, with a rise to about 65 ppb in the early 20th century. Then from 1945 to 1970 (the mid-century period in question), atmospheric sulfate concentration increased from 65 to 120 ppb. This tells us that approximately 60% of the total sulfate increase since 1800 occurred during the mid-century cooling period.
Direct Aerosol Forcing
The change in reflected solar flux is proportional to the optical thickness of the aerosol layer (Charlson et al. 1991).
![]()
where FR is reflected solar flux, Qo is the solar constant (total solar irradiance), Ti is the atmospheric transmittance, Ac is the fractional coverage of clouds, ? is the fraction of upward scattered flux, and ? is the optical thickness.
Using Qo = 1366 W/m2, Ac = 0.61 for globally averaged cloud cover, Ti = 0.76, and Rs = 0.15 (see Charlson 1991 for references to the sources of these values), FR is approximately 32 times the optical thickness ?. Charlson et al. estimate the optical thickness as the product of the aerosol burden and mass scattering coefficient, and find for cloudless skies, the optical thickness is approximately 2.8x10⁻². Thus from the formula above, the reflected solar flux is approximately 0.9 W/m2, which is on the high end of the IPCC range of values for the direct aerosol forcing.
The indirect sulfate effect on cloud formation is more complex, but we'll proceed under the assumption that the total sulfate radiative forcing is approximately proportional to the atmospheric sulfate aerosol concentration, in order to come up with a ballpark estimate regarding its impact on mid-century cooling. In other words, we'll assume that a 60% increase in atmospheric sulfate concentration corresponds to a 60% increase in radiative forcing. Also note that sulfates are not the only anthropogenic aerosols, but do comprise the majority of the radiative forcing.
Approximation of sulfate aerosol cooling effect
With these assumptions in mind, approximately 60% of the -0.4 to -2.7 W/m2 net aerosol forcing occurred during mid-century, or -0.24 to -1.62 W/m2, with a most likely value of -0.72 W/m2. To convert this to a surface temperature change, we need to multiply by the climate sensitivity factor (?), which is 0.54 to 1.2°C/(W/m2) (IPCC 2007). The relationship between surface temperature change (dT) and radiative forcing (dF) is:
dT = ?*dF = (0.54 to 1.2)*(-0.24 to -1.62) = -0.13 to -1.9°C with a most likely value of -0.58°C
We can also compare this to the temperature change caused by anthropogenic CO2 during the period in question:
dT = ?*dF = (0.54 to 1.2)*5.35*ln(331/308) = 0.21 to 0.46°C with a most likely value of 0.31°C
In addition to CO2, other anthropogenic greenhouse gas emissions and solar output during this period caused an additional ~0.15°C of warming. Therefore, using the most likely values calculated above, we would expect to see an approximately 0.1°C cooling of global average surface temperatures from 1940 to 1975. And indeed that is what we observe:

Figure 5: Average global land and ocean surface temperature (NASA GISS)
Days cooled, but nights warmed
Another signature of aerosol cooling offsetting greenhouse gas warming is the continued increase in daily minimum, nighttime temperatures while the maximum, daytime temperatures drop. This is because aerosols cause global dimming by scattering sunlight; an effect which is much more influential during the day when solar radiation is bombarding the Earth's surface. At night, greenhouse gases continue to absorb and re-radiate thermal radiation from the Earth's surface, which causes the nighttime surface temperatures to continue warming despite the cooling daytime temperatures due to the aerosol dimming.
Wild et al. (2007) investigated these effects and found that from 1958 to 1985, daytime land surface temperatures cooled at a rate of -0.04°C per decade, but nighttime temperatures warmed at a rate of 0.11°C per decade. From 1982 to 2002, they found that daytime land surface temperatures warmed at a rate of 0.37°C per decade, while nighttime temperatures warmed by 0.40°C per decade.
The fact that nighttime temperatures continued to warm while daytime temperatures cooled mid-century is a strong indicator of the combined effects of anthropogenic aerosol and greenhouse gas emissions, while the increased rate of warming over the past 3 decades reflects the increasing atmospheric concentration and radiative forcing from greenhouse gases.
What happened since 1975?
Clearly since about 1975, global surface temperatures have trended rapidly upwards (at a rate of nearly 0.2°C per decade). So what caused the mid-century cooling to end?
The main cause of the sudden shift in global temperature trends was the passage of Clean Air Acts by various countries in response to air pollution and acid rain. The USA, for example, first passed its Clean Air Act in 1970, with amendments in 1977 and 1990. Coincidentally, the US Supreme Court (in Massachusetts v. EPA) and EPA (in an endangerment finding) also recently decided that greenhouse gases qualify as 'air pollutants' in the Clean Air Act and must be regulated accordingly.
Under the Clean Air Acts, sulfate emissions were regulated, and as a consequence their rapid atmospheric increase was stabilized right around 1975:
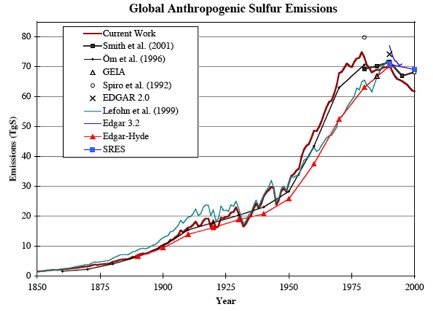
Figure 6: Global anthropogenic sulfur emissions (Pacific Northwest National Labs)
Meanwhile anthropogenic greenhouse gas emissions have continued to increase. Since 1975, the atmospheric CO2 concentration alone has increased from 331 to 392 parts per million by volume, which corresponds to a temperature increase of about 0.7°C, though we've only seen about 0.55°C warming over that period due to the thermal inertia of the oceans and 'warming in the pipeline'.
Mid-century cooling was primarily anthropogenic
To sum up, anthropogenic sulfur emissions appear to be the main cause of the mid-century cooling. These emissions decreased the mean global surface temperature by approximately 0.5°C during this period, while anthropogenic greenhouse gas emissions caused a warming of approximately 0.4°C. Therefore, even though greenhouse gas emissions continued to have a warming effect during this period, it was more than offset (hidden) by anthropogenic aerosol emissions, until those emissions were brought under control by government intervention while greenhouse gas emissions continued to increase unabated. In other words, the mid-century cooling is actually an expected result based on our current understanding of climate science, and is successfully hindcasted by climate models (Meehl 2004).
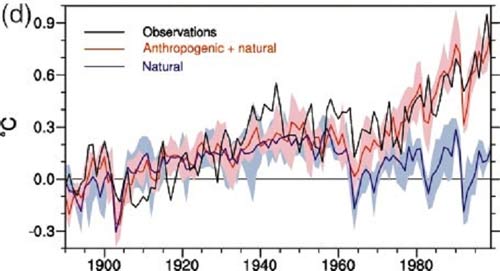
Figure 7: Anthropogenic plus natural vs. just natural radiative forcing temperature change vs. observed global surface temperature increase (Meehl 2004)
However, the overall impact of sulfate aerosols, particularly due to their indirect effects via cloud formation, remain a significant source of uncertainty. Despite this uncertainty, they remain the likely dominant cause of the slight mid-20th century cooling.
This post is the Advanced version (written by dana1981) of the skeptic argument "It cooled mid-century". If reading this caused your brain to overheat, you can always wind down with the Basic version by Anne-Marie Blackburn or the Intermediate Version by John Cook.


 0
0  0
0 From The PDO
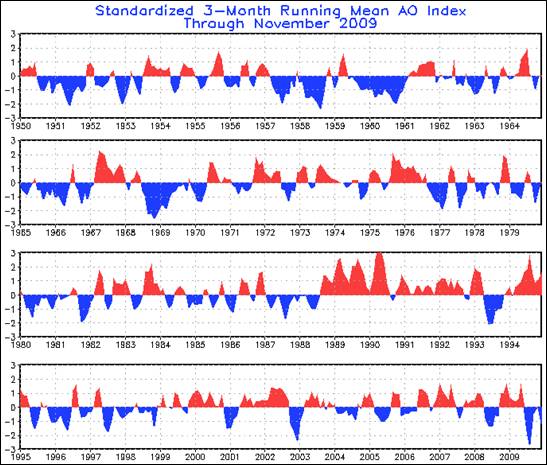 From The AO and the NAO
So I have to ask: How can cycles with no long term coherency be the causes for an effect (increasing global temperatures) that has a long term trend? Wouldn't those cycles more likely be the causes of the short-term low-amplitude variations?
From The AO and the NAO
So I have to ask: How can cycles with no long term coherency be the causes for an effect (increasing global temperatures) that has a long term trend? Wouldn't those cycles more likely be the causes of the short-term low-amplitude variations?
 PDO: Pink is summer 3 month average; light blue is winter. LOTI (dark blue) on the right-hand scale.
You can't have it both ways. Perhaps there is no real coupling between PDO and temp and the mid-century was mere correlation without you-know-what? Or perhaps any such coupling was faint and is now swamped by CO2?
In either case, its now PDO 0, aerosols 1.
PDO: Pink is summer 3 month average; light blue is winter. LOTI (dark blue) on the right-hand scale.
You can't have it both ways. Perhaps there is no real coupling between PDO and temp and the mid-century was mere correlation without you-know-what? Or perhaps any such coupling was faint and is now swamped by CO2?
In either case, its now PDO 0, aerosols 1.
 But the scale of the emissions during the more recent decades seems to overwhelm.
Note to John C.: Sorry, I was using width=480; I will downsize in the future.
But the scale of the emissions during the more recent decades seems to overwhelm.
Note to John C.: Sorry, I was using width=480; I will downsize in the future.


Comments