Monckton Myth #16: Bizarro World Sea Level
Posted on 14 April 2011 by dana1981
We have a new entry in the contest for most bizarre "skeptic" argument. The "Science" and Public Policy Institute ("S"PPI) Monthly CO2 Report for January 2011, edited by everyone's favorite "skeptic", Christopher Monckton, contains some astonishing claims pertaining to global sea level rise.
First, on page 12, the document claims "Sea level continues to rise more slowly than the UN predicts." This is of course the opposite of reality. Sea level is rising faster than the IPCC predicts (Figure 1).

Figure 1: Sea level change. Tide gauge data are indicated in red and satellite data in blue. The grey band shows the projections of the IPCC Third Assessment report (Allison et al 2009).
On page 29, the "S"PPI document contradicts its previous statement, claiming "Sea level is not rising." This is of course also false. In fact, as we recently discussed sea level is not only rising, but the rise is accelerating. Immediately below this false claim, the document contains the following figure:

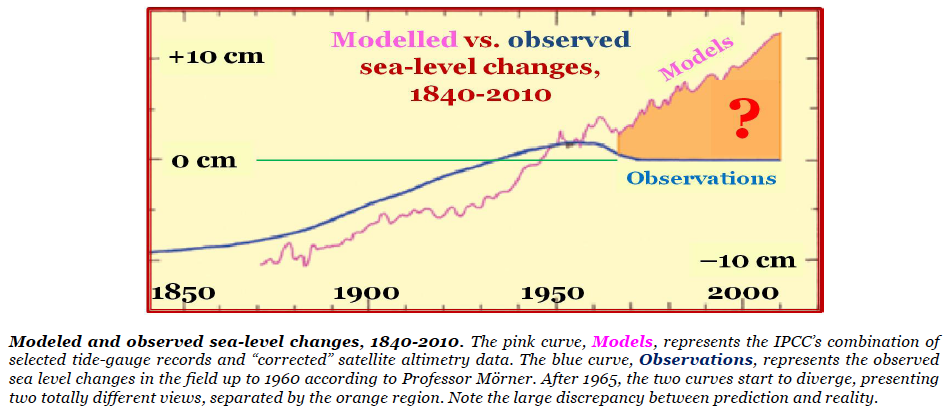
How quickly we went from 'rising slower than predicted' to 'not rising' to 'falling'! Notice that the caption claims the blue curve is observational sea level data "up to 1960 according to Professor Morner." Of course, after 1960 (when the "observations" are apparently just made up) is not only when the "observations" supposedly diverge from the models, but also when they diverge from reality! Ah, but it gets even worse from here. On page 33, the document presents what may be my favorite figure of all time:

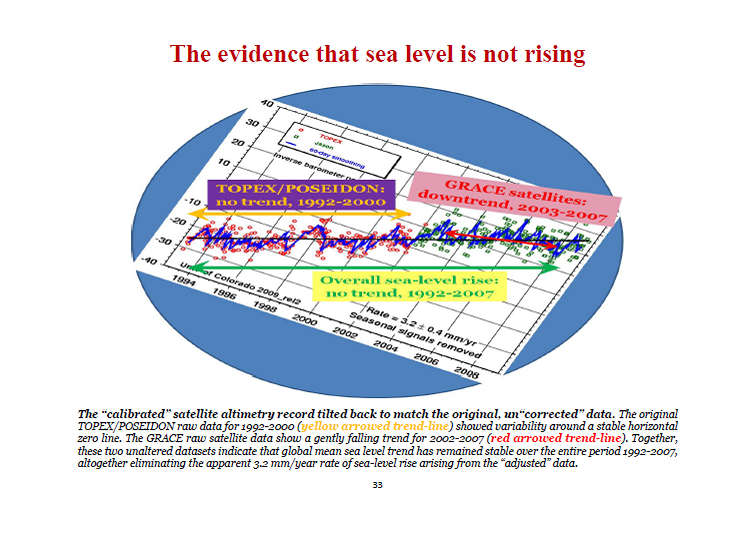
Monckton and "S"PPI have taken the sea level graph from the University of Colorado at Boulder which shows a 3.2 milimeter per year sea level rise trend (as is still visible in the bottom right of the graph), rotated it to make the trend look flat, and claimed that this is what the "unaltered" and "uncorrected" data looks like.
It boggles the mind that Monckton and the "S"PPI think they can convince people that sea level has dropped since 1950 based on nothing more than their own unsubstantiated claims and blatantly doctored graphs which are completely contradicted by the actual observational data. Monckton has really outdone himself here. How long will it be before these "skeptics" try to convince us that global warming is over because positive temperature trends signify cooling?

Arguments


'When asked to act as an "expert reviewer" on the IPCC's last two reports, he was "astonished to find that not one of their 22 contributing authors on sea levels was a sea level specialist: not one".'
The relevant chapter is available here, and the second name in the list of contributing authors is Anny Cazenave, who is very obviously a sea level specialist (judging by her CV). She is leading expert in sea level measurements by satellite altimetry, and obviously has a solid background in geophysics. The fact that the Telegraph article is brought up so often just goes to show that some are happy to accept wild claims that suit their position without bothering to check the facts first, even when they are easily verified by a couple of minutes Googling.
Morners claims about the IPCC fudging the satelite data are also without foundation, I'll return to them later.
Of course, "the past 10,000 years" includes a good bit of the post-glacial sea level rise--which was essentially finished by 7,000-odd years ago.
So, taking the average over the last 10,000 years very nicely obscures the fact that almost all of that rise occurred in the first ~3,000 years. It's certainly more to Lawd M's liking that this more accurate caption:
Few minutes of googling reveals that Jonathan M. Gregory, C. K. Shum are also experts in sea level.
If you haven't, you should! ;o)
I thought that Beck held the record with his graph that had a break in the x-axis so he could show a cycle where there was none. Compared to this, he could be called timid. Talk about a trick to hide the incline. Where are ths skeptics? Why are they not commenting about this?
No I hadn't; I just did. Amazing. I'm am still just beginning to grasp what we are up against.
The "blog science" expert beat me to my own joke (although I don't think he was kidding)
"Remember to apply your blog science skills and question everything. Question, for example, the conventional "wisdom" that says y-axes must go vertically and x-axes horizonally.Why should time go horizontally and extent go vertically? Remember that actual ice extent is a measure of the horizontal spread of sea ice, so in many respects by making the Y-axis more horizontal I have displayed the data in a more correct manner than so-called "phd scientists" do."
and you have got to love this:
"QUESTION: does the blue line show that median(?) ice extent has declined by 2 million sq km since 1978? ANSWER: Of course not, and it's quite easy to see if you follow the debate on this matter that only those with a socialist agenda to cap and tax carbon emissions say that it does. For an alternative view, check out Anthony Watts, a non-agenda-driven TV weatherman whose paycheck depends only on the free market. He has written extensively on Arctic ice extent and how the ice extent is increasing year over year and has not changed much at all anyway. Also, George Will of the Washington Post wrote an op-ed earlier this year noting that Arctic ice was not in decline, and if the defensive and shrill attacks he got from the warmist community are any indication, they don't have much to stand on here."
BTW, I didn't realise it was a parody when I first saw it as well, which says a lot about some of the genuine skeptic blogs!
Mörner, N.-A., "Estimating future sea level changes from past records", Global and Planetary Change, Volume 40, Issue 1-2, January 2004, Pages 49-54 (www)
Figure 2 of that paper gives the "raw" TOPEX/POSEIDON data for 1992-2000 "before any filtering or sliding mean average". Sadly he gives no source for the data giving in this figure in the paper. This was one of the things pointed out by a comment on Morner's paper published by Nerem et al. (Cazenave is one of the "et al.").
Nerem, R.S. et al., "Comment on 'Estimating future sea level change from past records' by Nils-Axel Mörner", Global and Planetary Change
Volume 55, Issue 4, February 2007, Pages 358-360 (www)
Nerem et al say that Morners paper "completely misrepresents the record of sea level change from the TOPEX/Poseidon (T/P) satelite altimetry mission" and explain why that is the case. The first major criticism of Morner's paper is that it doesn't include a single reference to any altimetry study, all of which apparently refute his claim that there is no change in global mean sea level. I checked this, and it is indeed true, there are no references to any paper on TOPEX/Poseidon. Of the 33 references there are, there are however no less than 17 references to his own work. This would have rung warning bells for me had I been a reviewer!
Back to Figure 2. Nerem et al. note that Morner gave no source for the data in his figure, but the speculate that it is the original raw release of data, with no corrections made for known problems with the instrument on the satelite. Note this is not about "filtering" or "sliding mean averaging" it is about calibration for known problems. These adjustments are well documented in the journals and Nerem et al give the references. So Morner has used raw data, which are known not to give an accurate indication of actual sea level changes due to calibration issues. Surely if he had researched the issue properly, he would at least have referenced the papers describiing these adjustments, and explained why they were incorrect. But that was obviously not the case. Nerem et al also briefly describe the nature of the adjustments for those who are interested.
The story doesn't end there, because Morner wrote a comment on the comment.
Mörner, N.-A., "Comment on comment by Nerem et al. (2007) on 'Estimating future sea level changes from past records' by Nils-Axel Mörner (2004)", Global and Planetary Change, Volume 62, Issue 3-4, June 2008, Pages 219-220 (www)
He starts of by criticising Nerem et al for not publishing their comment in a timely manner, which is ridiculous there is no "statute of limitations" that means you can get away with being wrong provided nobody notices for a year or two! He also complains that the first he knew of it was when it appeared in print. Surely for consistency, he should have sent his original paper to the TOPEX/Poseidon group for comment before publication - it is a pity that he didn't.
Morner does however say where he got the data from, it was from a MEDIAS newsletter, and he obtained his curve was a "redrawing of this graph". This newsletter article is available on-line here, and this is the graph from that article:
The caption is as follows "Mean rise in the sea level observed by TOPEX/POSEIDON between October 1992 and April 2000
(about 1 mm/year)"
So Morner has redrawn the plot from the newsletter, claiming that it shows no trend, when the caption of the figure in the article clearly states that there is a trend of 1 mm/year and a trendline is clearly depicted on the plot! Does Morner mention that? No, in fact in his comment on the comment, he reiterates that there is no trend in the data.
Morner then says the figure reappears later with a greater tilt, and asks why that is. He then answers his own question by saying that the data in his figure include the adjustments described in a paper by Mitchum, but not later adjustments described in several other papers describing later adjustments to the data. He rejects these as being "subjective interpretations", which is about the weakest rebuttal of a criticism I have seen in a journal!
So in otherwords, Morner redrew data from a newsletter (rather than actually getting the data and replotting it), ignored the fact that the original caption and diagram explicitly showed a non-zero trend, ignored even the existence of a set of adjustments made to the data due to known issues with the instruments, rejected them as "subjective interpretation" when this was pointed out. Says the "calibrations" (quotes his) are "very strongly debated" without giving a reference to a paper questioning the calibration. Does any of this inspire confidence? I'd say "no".
Monckton outght to have checked out his source on this one a bit more carefully.
Denial Depot is indeed excellent!
But as I said earlier, we shouldn't be too hard on Morner, I think he sincerely believes what he writes, even though it is objectively false.
With that, the number of self-citations and the Gilgamesh quote (pretentious - moi?), I am amazed the paper was published in a journal (other than E&E)
It's excluded because of the IPCC's role. To report on the science as published up to a point in time. At the time of collecting and evaluating available papers, there was too little explicit calculation and attribution of the amount or the rate of rise attributable to melt - let alone projections of expected rise due to melt.
That situation won't apply for the next round. Don't say you weren't warned if there are big differences between the next and the previous IPCC reports.
I suggest people take a look at this site:
http://wattsupwiththat.com/2009/03/19/despite-popular-opinion-and-calls-to-action-the-maldives-is-not-being-overrun-by-sea-level-rise/
You'll see some very interesting photos there which suggest that the alleged sea level rise in the Maldives is really pure fiction.
There is also some very relevant criticism of tide guage measurement. Interesting to see the rickety structures - there's only one way they are going and that is down!
We all should see it as a sign of what we might expect to see in certain publications. If graph-tilting or axis-fudging is not already out there, it will be one day.
Citing disinformation blogs does little for your credibility and explains much.
Be a true skeptic please--do not believe everything you read and see at WUWT, or take it at face value. There is much fiction touted as fact on that pseudo science blog. Are you now too denying that global sea levels have risen?
I ask because a common trait of deniers is to avoid explicitly acknowledging when one line of argument is refuted (so they can return to it later or elsewhere) and simply pick a new line of evidence? What you have just done looks very much like exactly that, so maybe you would like to dispel that impression.
Secondly, have you investigated the WUWT story to find out whether it checks out, or whether like the Telegraph article it is full of bogus claims?
Good article, Dana.
It puts me in mind of that famous quote popularised by Adam Savage from Mythbusters: "I reject your reality, and substitute my own."
And you're saying those tidal gauges can measure increases measured in millimetres?
C'm on!
Who are you addressing? And Watts has a sturdy reputation for misrepresenting facts and the sicence, anyone paying close attention and being truly critical would know that is a fact.
For the life of me I cannot believe how anyone having an iota of credibility and scruples (and who has been paying attention to the solid refutations of Monckton) could defend the shenanigans of Monckton and Morner.
Of course, in spite of such genius he, and the rest of you, are all wrong.
Sea level has always been, and always will be, 0 mm/ft above sea level.
You also haven't answered the question about whether you have checked the WUWT story out to find out if it is correct or not. Have you checked the photograph depicts what it is claimed to predict? Have you checked the veracity of the tide guages? You do realise that you can't measure global sea level change using a single location, don't you?
I wonder what Daniel Maris would make of his sort of chart?
(Speaking of Watts; should we await the Tidal Stations Project with bated breath?)
http://en.wikipedia.org/wiki/File:NOAA_sea_level_trend_1993_2010.png
That quote may explain some of his inventiveness.
John A. Church, Neil J. Whitea and John R. Hunter, "Sea-level rise at tropical Pacific and Indian Ocean islands", Global and Planetary Change, Volume 53, Issue 3, September 2006, Pages 155-168 www, pdf)
Philip L. Woodworth, "Have there been large recent sea level changes in the Maldive Islands?", Global and Planetary Change, Volume 49, Issues 1-2, November 2005, Pages 1-18 (www)
Colin D. Woodroffe, "Late Quaternary sea-level highstands in the central and eastern Indian Ocean: A review", Global and Planetary Change, Volume 49, Issues 1-2, November 2005, Pages 121-138 (www)
but start with
Paul S. Kench, Scott L. Nichol and Roger F. McLean, "Comment on 'New perspectives for the future of the Maldives' by Mörner, N.A., et al. [Global Planet. Change 40 (2004), 177–182], Global and Planetary Change, Volume 47, Issue 1, May 2005, Pages 67-69 (www)
as this is a peer-reviewed comment on Morners original work on the Maldives (the details of that paper are in the title). Morner's response is here:
Nils-Axel Mörner and Michael Tooley, "Reply to the comment of P.S. Kench et al. on 'New perspectives for the future of the Maldives' by N.A. Morner et al. [Global Planet. Change 40 (2004), 177–182]", Global and Planetary Change, Volume 47, Issue 1, May 2005, Pages 70-71 (www).
Does the WUWT article mention any of this? If not, why do you think that is? Now I have done enough of your homework for you, it is now up to you to locate those articles (Google Scholar is your friend), read them, and then come back here and either agree that Morner is wrong about the Maldives, or give a cogent scientific defence of his claims. I predict neither of those things will occur - go on, prove me wrong! ;o)
I am a little suspicious of your approach - it seems like reverse trolling. Presumably you have read these papers that you recommend I take the time to read, although I have never claimed to be trained in this area. Presumably you could sum things up pretty pithily. Presumably you could say some specific things like "That tree in Morner's photograph is no evidence because..."
But you choose not to. Instead you send me off to read hundreds of pages of scientific analysis.
My view of the subject is based on (1) Knowing that any effects of sea level rise in the south of the UK (which in any case is sinking) have been manageable (2) As far as I know, no one has been able to point to an island in a stable area (i.e. not an area where the land is sinking or in a delta) that has gone under water in the last 100 years. I'd be interested to hear if anyone claims there is one. (3) Dire consequences in the Maldives and elsewhere are always being predicted but never seem to happen. (4) There are clearly significant numbers of scientists who don't agree with the consensus. (5) The consensus is not the same as the extreme rises forecast by some people here - who are therefore just as guilty as denialists in ignoring scientific evidence.
I've never claimed to be able to take part in a peer review of papers in this subject area. But I do think we can see given such statements as the IPCC Chair's claim about glaciers melting that there is a good degree of misinformation floating about.
Bill -
What do I make of the chart? Well I said I am not competent to make sense of it, but if it's real sea level as opposed to sea level in relation to land level, then I am frankly puzzled by it, since large parts of the ocean appear to be experiencing a reduction in sea level (quite substantial - 4.5 MM Pa).
That makes me think there's something wrong with the measurements, or, alternatively, the measurements as a whole are not indicative of the volume of oceanic water. I presume it is the volume (or even better tonnage AND volume) of oceanic water that we are really interested in, rather than anything else.
If you think pointing out relevant papers and pointing out errors is "reverse trolling", then I have to tell you "reverse trolling" is an important part of science. Almost all papers have a sections called "references" which gives pointers to other relevant work, and where a paper argues with some existing theory or result, the errors in the previous work are pointed out in the introductory sections.
Sure I could just point out some errors in the Maldives issue for you but what good would that do. I gave a detailed analysis of the false claims in the Telegraph article, but what good did that do? Have you agreed that the claims in the Telegraph artcile are false? No. Have you defended them? No. Why should I expect you to respond any differently in this case?
The price of having an informed opinion on these matters is the willingness to go to the sources and sift through the facts for yourself. If you can't do that, then take on board what is said by those that do.
The fact you still are unwilling to talk about the Telegraph, howevrer suggests that you are a denialist and not actually interested in the truth. Until you comment on what I have written about the Telegraph article and whether you still accept the claims made by Morner in it, I am going to assume that any further posts are just trolling. Sorry if that sounds harsh, but it is your actions that have brought it on yourself.
This is how science works, Daniel. Those who choose to present scientific "findings" (such as the WUWT writers) and do not do that have no standing to criticise those who do. Those who do not have the skills or time (and I include myself in this group) to perform such analyses should respect the research of those who have.