Climate Science Glossary

Term Lookup

Enter a term in the search box to find its definition.

Settings

Use the controls in the far right panel to increase or decrease the number of terms automatically displayed (or to completely turn that feature off).

Term Lookup

Settings


All IPCC definitions taken from Climate Change 2007: The Physical Science Basis. Working Group I Contribution to the Fourth Assessment Report of the Intergovernmental Panel on Climate Change, Annex I, Glossary, pp. 941-954. Cambridge University Press.

Home Arguments Software Resources Comments The Consensus Project Translations About Support

Twitter Facebook YouTube Mastodon MeWe

RSS Posts RSS Comments Email Subscribe


Climate's changed before
It's the sun
It's not bad
There is no consensus
It's cooling
Models are unreliable
Temp record is unreliable
Animals and plants can adapt
It hasn't warmed since 1998
Antarctica is gaining ice
View All Arguments...


Username
Password
New? Register here
Forgot your password?

Latest Posts

Archives

Monckton Myth #7: Snowjob

Posted on 25 January 2011 by dana1981

As part of an ongoing series looking at Christopher Monckton’s response to Mike Steketee, this post examines Monckton’s arguments about global snow cover. In response to Steketee's claim that global snow cover is declining, Monckton claims in his point #10:

"a new record high for snow cover was set in the winter of 2008/2009, and there is some chance that a further record high will be set this year."

Cherries Don't Grow in Winter

The fundamental flaw in this argument is rather obvious, and one which Monckton seems to commit on a regular basis - cherrypicking of short-term data.  In this case he chose a 3-month period to support his claim that snow cover is not falling.  Quite obviously we cannot determine a long-term trend from 3 months' worth of data.

On top of that, Monckton has chosen a very peculiar 3-month period to evaluate.  Why is winter snow cover more indicative of the long-term trend than fall, spring, or summer?  In fact, Monckton has cherrypicked his seasons wisely, because the best way to support the false claim that global snow cover is not declining is to ignore the hotter months of the year.

Why Should Snow Cover Decline?

In the near future, global warming will not necessarily result in less winter snowfall globally.  Some regions will experience more winter precipitation, which in many regions will fall primarily as snow even if temperatures rise a few degrees, and some regions will receive less.  The top map in the figure below shows climate model projections of future winter precipitation changes from the 2007 IPCC report.


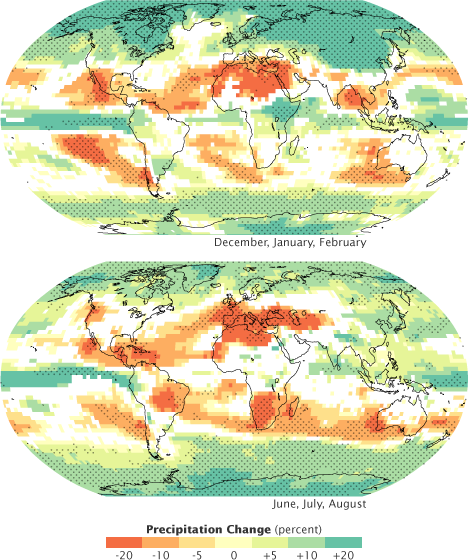
In short, we don't necessarily expect winter snow fall or snow cover to decline in the short-term in a warming world.  What we do expect is for this snow cover to melt earlier as spring arrives sooner, and at higher temperatures.

What Does the Data Show?

Monckton's statements are difficult to evaluate because he provides no supporting evidence or references.  However, the Rutgers University Global Snow Lab has perhaps the most commonly-used snow cover data, though only for the Northern Hemisphere (NH).  In fact, Rutgers does the work for us in plotting seasonal NH snow extents.  Here is their plot for the winter:

As you can see, the data appears not to support Monckton's claim.  The largest winter NH snow extent was in 1977-78.  2007-08 had the third-highest extent.  The winter of 2008-09 comes in about 23rd place out of 44 winters on record.  The winter of 2009-10 did come in second, however.

But more importantly, Rutgers also plots the spring NH snow extent:


This paints quite a different picture.  As expected in a warming world, the spring NH snow cover extent is declining quite significantly.  Rutgers also provides weekly and monthly data for their entire record in tabular format.  I plopped the data into a spreadsheet, took annual averages, plotted the data, and added a simple linear trend line.  Here is the result:


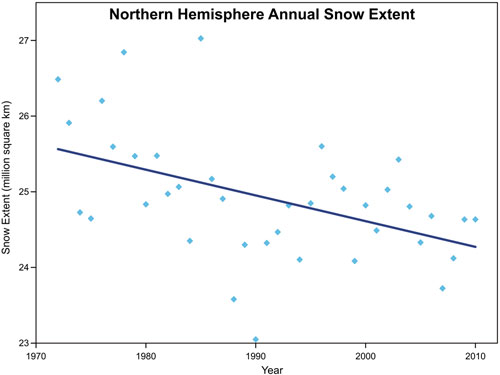
As expected, there is again a significant long-term drop in NH snow extent, this time looking at all the available data.  The trend demonstrates a decline of approximately 1.3 million square kilometers from 1972 to 2010.  This decline is confirmed by Déry and Brown (2007), which found a 1.28 million square kilometer decline in NH snow cover from 1972 to 2006.  In other words, NH snow extent is declining by approximately 34,000 square kilometers per year.

Why Does it Matter?

Snow is white and highly reflective.  When it melts, it reveals the much darker ground beneath.  Thus the larger the snow cover extent and the longer it lasts into the spring, the more solar energy the planet will reflect.  As snow cover declines, the planet absorbs more solar energy (this loss of reflectivity is known as decreasing albedo), accelerating global warming as a result.

In fact, a new study by Flanner et al. (2011) has found that so far, snow cover is declining more rapidly and causing more global warming than climate models expect.

"We find that cyrospheric cooling declined by 0.45?W?m?2 from 1979 to 2008, with nearly equal contributions from changes in land snow cover and sea ice. On the basis of these observations, we conclude that the albedo feedback from the Northern Hemisphere cryosphere falls between 0.3 and 1.1?W?m?2?K?1, substantially larger than comparable estimates obtained from 18 climate models."

Flanner et al. also show that the radiative forcing from snow cover in the winter months is relatively small, whereas the cooling effect is largest in the spring and summer months (March through July in the NH).  This is because in winter,  the days are shorter and the sunlight weaker, so albedo has less impact.  This again confirms that if we want to evaluate the impact of changing snow cover on the climate, we should be looking at the spring and summer months, not the winter, as Monckton does.  Flanner et al. find that the change in snow radiative forcing in the spring and summer months has been significantly positive (less cooling) from 1979 to 2008.

So not only is Monckton's suggestion that snow cover is not declining incorrect, but in fact it's declining faster than climate scientists anticipated, and contributing significantly to global warming as a result.  Monckton arrives at an incorrect conclusion not only by cherrypicking 3 months out of a 40 year record (0.6% of the available data), but also by looking at the least relevant months of the year (winter).

0 0

Printable Version  |  Link to this page

Comments

Comments 1 to 31:

  1. Dana, Nicely done--Monckton and WUWT (curtosy Anthony Watts) sure are quite the prolific producers of misinformation and distortion. It seems that one could spend all day, every day refuting the spin and misinformation being highlighted at WUWT. Why then does Watts (and others) insist on claiming that WUWT is "...the world's most viewed climate website", when he knowingly allows Monckton to disseminate this nonsense? The Monckton/WUWT myths refuted here at SkS are the very antithesis of climate science. Having had my little rant, I did see something odd in your post though: "Prior to this winter, 2007-08 had the second-highest extent." Should that not read "third-highest"-- that is what the bar graph seems to be suggesting?
    0 0
  2. Regarding the winter numbers, I don't have the reference, but I read a study that expected winter snow cover extent to trend downward over the course of the 21st century (I think contrarians disingenously pointed to this study as "disproving" predictions). While that hasn't happened in the first 10 years, it's way too short of a time period for any meaningful evaluation, especially with the AO trending downward since the 1990's. If global warming is leading to more weather configurations involving cold air being pushed far south and a mild Arctic, that would generally lead to greater snow cover extent in winter, and such would probably lead to revisions of earlier predictions. If in constrast, the recent trend is just a result of natural AO fluctations, it seems when AO trends positive, combined with the long-term global warming trend, winter snow cover extent will plummet. We'd see more values like 2007 and less.
    0 0
  3. Once again the Viscount fails the truth test. His comment “…and there is some chance that a further record high will be set this year." should get some points on the “wishful thinking but so what?” test though. We should expect to see many short term snowfall records broken in the next half century. Unfortunately these kinds of cherries do grow in winter and they are and will continue to be a mainstay of the deniers’ diet. Thank you dana1981 for your continued effort.
    0 0
  4. Albatross - you're correct, I confused this winter (which is only 33% complete, so Monckton's claim that there is "some chance" of a new record is rather silly) with last winter. I've corrected the text accordingly, thanks.
    0 0
  5. Following up on this article with a few google searches, I think I may have found the source of Lord Monckton's error. In particular I found an article at Watt's Up With That called "Northern Hemisphere Snow Extent Second Highest on Record". (Google it if you want to see it. I don't link to trash sites.) In this article, Steve Goddard produces a graph of NH winter snow extents with a clear upward trend. Looking closer, it becomes obvious the trend in introduced by carefully selecting a start year of 1989. (Sceptics to often produce odd trend lines in graphs by because of the start date for it to be other than carefull selection.) Had the potty Lord seen an earlier version of the graph, it would explain his belief that the winter of 2008 had the highest snow extent.
    0 0
  6. I posted too soon. I have just discovered that the NSIDC records on snow coverage start in November of 1978, whereas it was Dec 1977 - Feb 1978 that set the record on the Rutgers data. Monckton may not have been dishonest in this case (beyond cherry picking winter).
    0 0
  7. Tom #6 - nice sleuthing. Here is the Goddard plot in question: Since Goddard omits the data prior to 1989, had he been using this WUWT post as a reference, Monckton would not be aware that 1978-79 had the record NH snow extent. I'm still not sure how Monckton would have confused the "record" of 2009-10 with 2008-09, perhaps just being careless.
    0 0
  8. Dana @8, "perhaps just being careless." You are being far too generous. Monckton is fully capable of talking about paleo climate, historical temperature record etc.. He knows these data, he makes a livelihood going around the world speaking to them. So I think it highly, highly unlikely, that Monckton happened to simply "forget" about some inconvenient data points. Besides, even if Monckton did err by chance, then Anthony Watts should have caught it and had him change it ;) What would clarify this is to determine what time window for snow cover Monckton has shown in his slides. I'll get back to you should I find anything.
    0 0
  9. #6: "Skeptics too often produce...". Skeptics don't, _denialists_ do. Skepticism is essential for science, and I don't think we should let the meaning of that word become corrupted. That would really be a lasting victory for the denialists. And, a skeptic who is not skeptical also towards his own ideas is no real skeptic, rather some kind of polemic. BTW, for a prolonged time, winter NH snow cover may increase under global warming, the increase in air moisture content thus generating a (local) negative feedback, in part via albedo. But I don't think this will be very significant for the overall warming process, because the "lost" radiation is relatively weak - few insolation hours and low angle. (These days, I use the solar collector, Norway, mostly for feeding the heat pump, rather than direct heating - that's the best use of it. But in March, the situation will have changed dramatically.)
    0 0
  10. Monckton has been promoting this canard about winter N. Hemisphere snow cover trends refuting AGW for some time: "There has been no decline whatsoever in the total global extent of sea ice since satellite records began. New records for the extent of northern-hemisphere snow cover were observed by the satellites in the winter of 2001 and again in 2007. This year, many ski resorts are opening early as Arctic weather strikes. Many temperature stations in the northern hemisphere recorded record low temperatures in October/November 2008." [Here on Tuesday, 09 December 2008 19:51] What is more, he could have not made that claim about the 2001 and 2007 extents being records without having looked at all the data. So he cannot plead ignorance. Furthermore, as the Rutgers data show, Monckton's claim that the N. Hemisphere snow cover in the winters of 2001 and 2007 were record highs is demonstrably false. Unless, he was referring to a specific month-- either way he has deceived the reader. According to the Rutgers data, 2001 and 2007 were not spectacular years for N. Hemisphere snow cover, not even close. According to Rutgers the record high N. Hemisphere snow cover extents for the individual Boreal winter months since 1979 are: December 1985@ 45.99 million km^2 (followed by 2009 and 2010) January 1985 @ 49.87 (followed by 2008 and 1979) February 2010 @ 48.39 (followed by 1980 and 1985) The Rutgers data go back to late 1966, in which case the records are: December: 1985 (followed by 1970 and 2009) January: Unchanged February:1978 (followed by 1972 and 2010)
    0 0
  11. It will be fantastic to the records if the NASA guys can recover the NIMBUS satellite data. It could add data as far back as 1964!
    0 0
  12. @5 Bily Joe: "Also I think "myths" should be "lies" because, when you keep repeating stories over and over again without ever addressing the valid objections that have been raised, then I think we should call a spade a spade. But I have probably risked having my first post here censored." John C is nicer than that Billy. I believe that "lies" will be too strong but only if you're including it in an article for SkS. "Falsehoods" would be my choice but then, I'm thought of as being a little too emotive. How about "repeated gross errors"?
    0 0
    Response: Nope, Billy Joe called it correct, I moderated his comment which violates the ad hominem comments policy. Here at SkS, we attack the methods not the motives.
  13. UNEP has a site entitled "Global Outlook for Ice and Snow" here. It gives a bit broader perspective.
    0 0
  14. Billy Joe #5 Carefull man. The Not Lord is quite litigious you know. At least he claims to be. Perhaps instead of 'spade' you could use: Personal Ingenious Search Selection Tool Applied to Kleptomaniac us of Evidence
    0 0
  15. Albatross @10, thankyou for that. The refference to satellites makes it clear that Monckton is reffering to the NCIDC data, which commences in November of 1978, thus missing the Rutgers University data. Therefore his error may be an honest, if very careless mistake. The next question is has anyone drawn his attention to the Rutgers data.
    0 0
  16. Glenn Tamblyn @14, Christopher Monckton is the third viscount of brenchley. As such, the polite form of adress to him according to English rules of ettiquette is My Lord, or, Your Lordship, or Lord Brenchley. Thus he is a Lord. He is not, however, a member of the House of Lords, despite his false claims to the contrary to amongst others, the US Senate. So, "potty lord" certainly. Proof that hereditary peerage serves primarilly to thrust fools into prominence. Definitely. But not "Not Lord".
    0 0
  17. TC I can live with Potty Lord. My approach is: 1. Respect is Earned. Politeness is a right. 2. Unless of course you aren't polite then the rules change. As for the rules of etiquette, well they are simply an archaic mix of politeness and feudalism. Keep the politeness, ditch the feudalism. And the Title. Titles conveying rank or responsibility have merit. Like Constable, Doctor, Pilot. Anyway, we have wandered far enough OT
    0 0
  18. "But I have probably risked having my first post here censored." At least I made an accurate prediction. Except that it is still there in post #12 (But I suppose not for long)
    0 0
  19. Maybe you should put in your "most used sceptic arguments" " Lord Christopher Moncton says agw is a scam" and a short clear summarry of his main nonsense arguments.
    0 0
  20. A bit more on albedo. The role of albedo and accumulation in the 2010 melting record in Greenland
    0 0
    Moderator Response: [muoncounter] See the Flanner in the works thread.
  21. Great series of posts. 10 monckton claims down and only 14 to go. love the team's stamina, I am looking forward to future installments.
    0 0
  22. Thanks citizenschallenge. I think John is going to take down about 10 of them in one fell swoop (a bunch were about extreme weather). We're probably looking at 11 installments, for now.
    0 0
  23. I'm putting this here because it relates to snowfall. Just to show some contrast between the way the media reports scientific findings. In the Telegraph the headline reads "Himalayan glaciers not melting because of climate change, report finds, but yet in other media where there is a greater sense of responsibility to report the news accurately the headline would read like this one from IRIN, CLIMATE CHANGE: Not all Himalayan glaciers are melting. What is striking is the way the Telegraph (which supports the skeptic view) cherry-pick the data that suits their purpose and ignore reporting the rest. So a word to the wise, choose your sources of information carefully.
    0 0
  24. Hello, First time i have posted here. This stuck out a little because it looked a little like the graphs rebutting Monckton were guilty of the same 'cherry-picking' you were accusing him of - if you are pointing to spring extent declining, were he was pointing to winter extent increasing (or staying the same). It might be argued that year-round extent is highly variable but averages out in the long run. I was curious, so i downloaded the data you linked to and did my own graph. The first thing I noticed was that the data was incomplete: http://climate.rutgers.edu/snowcover/files/moncov.nhland.txt In 1968, July is missing. In 1969 June to October is missing. In 1971 July to August is missing. Since these were the warmer months, creating averages without accounting for these would create a declining bias. What i did was substitute figures from preceding years and where July was missing in the preceding year I substituted it with July from the following year. Not exactly exacting but maybe enough to see if a trend would show. My graph is here: The graph is from 1967-2010 whole years only - no partial years with substituted data where data was missing. There doesn't seem to be a very strong trend, but it does look to be downwards. That said, at around 1989 the averages jump to a lower level and then remain very consistent, with possibly a tiny trend upwards. Would it be not reasonable to suspect that there was some kind of change in data collection? Especially since the averages in the preceding 20 or so years jump around a lot and then ones that follow are much more consistent?
    0 0
  25. I should add (forgot to mention this in the first post) that if winter melt is happening earlier because the world is warming, it should show up on yearly averages. Longer snow-free periods is really what John is driving at at surely? While the melt might be coming sooner, it could be balanced out by snows arriving sooner meaning no net (or very little) change, so it perhaps not enough just to concentrate on just spring compared to winter. If this is not the case, then I would be interested to know how scientists have come to the conclusion that "a new study by Flanner et al. (2011) has found that so far, snow cover is declining more rapidly and causing more global warming than climate models expect." given that the annual extent from the figures John posted don't appear to have changed much. And by "much" I must qualify that with not knowing whether the 2-3% difference is a lot or little, within natural variance or cause for concern because of man-made effects. For example, by how much did climate models 'expect' snow extent to decline? How much of the decline do they expect natural variance to account for? How much from anthropogenic forcing? Or are the figures from Rutgers wrong? What are the margins for error?
    0 0
  26. Agnostic @24 and 25, "While the melt might be coming sooner, it could be balanced out by snows arriving sooner meaning no net (or very little) change, so it perhaps not enough just to concentrate on just spring compared to winter." and "There doesn't seem to be a very strong trend, but it does look to be downwards." I think that you are missing the point of the post. It is Monckton who is cherry-picking. Dana81 has placed the tendencies in context, not to mention exposing the flaws with Monckton's assertions. Please read this page from the IPCC AR4. Inparticulare look at Table 4.2-- it shows N. Hemisphere snow extent showing statistically significant decreases between March and August (excluding May), with negative trends between January and October. They also state for Eurasia and Europe that: "Lowland areas of central Europe are characterised by recent reductions in annual snow cover duration by about 1 day yr–1 (e.g., Falarz, 2002). Trends towards greater maximum snow depth but shorter snow season have been noted in Finland (Hyvärinen, 2003), the former Soviet Union from 1936 to 1995 (Ye and Ellison, 2003), and in the Tibetan Plateau (Zhang et al., 2004) since the late 1970s. Qin et al. (2006) reported no trends in snow depth or snow cover in western China since 1957." Monckton is focusing on Winter (well at least November and December are) because those data are showing a small, statistically insignificant increase)and ignoring the other data which do not support his ideology. "Would it be not reasonable to suspect that there was some kind of change in data collection?" I do not think so, Brown and others do mention it. If there was going to be a step change then is should have been in the late 60s when the first satellite data became available. Other observations platforms have come online since then, but non of them seem to coincide with the step change in 1989. You must also remember that so much snow has has been lost in summer in recent decades that there really is not much more to melt anymore. So that contribution to the overall trend in recent years has dwindled. Yet, Dana's figure shows a marked downward trend in annual N.Hemisphere snow cover. Research has also shown that the the length of the melt season in the Arctic (and Greenland)is increasing. If you fit a quadratic to the annual N. Hemisphere snow cover data data between 1989 and 2010 (which provides a much better fit than an linear model), you get an inflection point around 1996, with a negative slope thereafter. All this presents a consistent and coherent picture. Your questions about uncertainty in the data are answered in Brown and Robinson (2010). The Rutger's data are not wrong. The model's have underestimated the loss of Arctic sea ice. Regarding "by how much did climate models 'expect' snow extent to decline?" Read this. You might also find this paper by Brown and Mote (2009) interesting, it speaks to the anticipated complex response of snow cover to warming and increased precipitation. And last, bit not least, this paper by Dery and Brown (2007), which concludes: "To summarize, strong negative trends in weekly SCE over the period 1972–2006 are observed in the NH, North America and Eurasia. The largest declines occur during spring over North America and, to a lesser extent, over Eurasia. Persistence both on weekly and annual times scales influences trends in North American and Eurasian SCE. The similar response of the North American and Eurasian snow covers, including their co-variability, persistence, and amplified trends during spring, provide evidence of the snow albedo feedback as a possible mechanism contributing to recent changes in observed SCE."
    0 0
  27. "I think that you are missing the point of the post. It is Monckton who is cherry-picking. " No i have not missed the point. I can see that John makes an excellent general point that we would not necessarily expect to see a reduction in winter snow extent, especially initially, but that spring would arrive sooner. He then goes onto to create a graph depicting how springs have had trending smaller extent. Well that is also cheery-picking. Springs may be coming earlier, but if autumn is too then there would be no net difference. If autumn comes at the same time, and spring earlier then there would be longer periods of the year with reduced ice extent. That would show in the Annual average as a decline. But if autumn starts earlier then it means the seasons are not respecting our notions of when they should start. That might possibly indicate some change to the climate, just not necessarily warming. (NB I am not disputing that there has been warming!) So I took the data he posted and made my own graph - taking care to ensure that the missing data was patched. ""Would it be not reasonable to suspect that there was some kind of change in data collection?" I do not think so, Brown and others do mention it." Hmm. My plot points bounce around, then suddenly drop a bit and remain pretty consistent thereafter. Never-the-less I scanned the article you linked regarding uncertainty and they seem to think it is not unprecedented - something like it occurred in the 20's. I suppose it's possible but you have to admit it really looks suspicious. "Inparticulare look at Table 4.2-- it shows N. Hemisphere snow extent showing statistically significant decreases between March and August (excluding May), with negative trends between January and October" Why just between March and August? In my experience mother nature does not always rock up on cue - surely the safest way to be sure that you account for different starts to the seasons is to take an annual average? If there is a trend it should still show up. I will look at the links you posted carefully, some I have already scanned before, but nothing there leaps out at me in answer to the questions I posed. If the Rutger data is as reliable as you suggest (and I have no reason to suppose otherwise), then simply comparing percentage differences of annual averages seems more striking in their consistency than as a clear trend - apart from that big jump at 1989. "All this presents a consistent and coherent picture. " Well to you may be, but I can't see one yet. I'd really love to know why the ANNUAL average is not being shown...
    0 0
  28. Agnostic, "I'd really love to know why the ANNUAL average is not being shown..." I fail to see how you keep missing this graph from the above post: Do you not see the title of that Figure? "Northern Hemisphere Annual Snow Extent" And if future when submitting graphs, please use the appropriate scale for the axes, in you case the y-axis. Thanks.
    0 0
  29. "Springs may be coming earlier, but if autumn is too then there would be no net difference." The data and literature I provided do not support your (unsubstantiated) assertion. Please demonstrate for us here, using the literature and appropriate data, that the snow in the fall (September-November) has been arriving sooner. You made the assertion, it is up to you to substantiate it instead of musing hypotheticals. Agnostic, you may not realise it, but you are presenting as a concern troll...and this discussion is getting tiresome, especially when I hunt down numerous papers to back up my point and your retort is essentially full of "what ifs". Monckton misled, that much is unequivocal. He chose that part of the picture which fit his agenda. Dana (and I) provided seasonal and annual data.
    0 0
  30. And if future when submitting graphs, please use the appropriate scale for the axes, in you case the y-axis. For an excellent article on the appropriate scale for axes and other important graphing techniques, please see How to cook graph skepticalscience.com style (Cat and coffee warning. His latest is very funny too).
    0 0
  31. Scaddenp @30, That is funny. Thanks for that. Lindzen should read that post too.
    0 0

You need to be logged in to post a comment. Login via the left margin or if you're new, register here.


The Consensus Project Website

THE ESCALATOR

(free to republish)


© Copyright 2024 John Cook
Home | Translations | About Us | Privacy | Contact Us