Climate Science Glossary

Term Lookup

Enter a term in the search box to find its definition.

Settings

Use the controls in the far right panel to increase or decrease the number of terms automatically displayed (or to completely turn that feature off).

Term Lookup

Settings


All IPCC definitions taken from Climate Change 2007: The Physical Science Basis. Working Group I Contribution to the Fourth Assessment Report of the Intergovernmental Panel on Climate Change, Annex I, Glossary, pp. 941-954. Cambridge University Press.

Home Arguments Software Resources Comments The Consensus Project Translations About Support

Twitter Facebook YouTube Mastodon MeWe

RSS Posts RSS Comments Email Subscribe


Climate's changed before
It's the sun
It's not bad
There is no consensus
It's cooling
Models are unreliable
Temp record is unreliable
Animals and plants can adapt
It hasn't warmed since 1998
Antarctica is gaining ice
View All Arguments...


Username
Password
New? Register here
Forgot your password?

Latest Posts

Archives

The human fingerprint in global warming

Posted on 29 March 2010 by John Cook

In science, there's only one thing better than empirical measurements made in the real world - and that is multiple independent measurements all pointing to the same result. There are many lines of empirical evidence that all detect the human fingerprint in global warming:

The human fingerprint in atmospheric carbon dioxide

That rising carbon dioxide is caused by human CO2 emissions should be obvious when comparing CO2 levels to CO2 emissions:
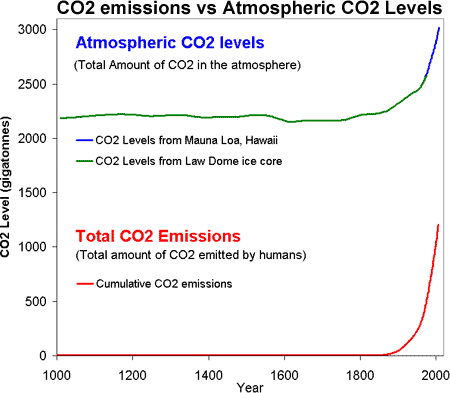

Figure 1: CO2 levels (Green Line - Law Dome, East Antarctica and Blue line - Mauna Loa, Hawaii) and Cumulative CO2 emissions in gigatonnes of CO2 (Red Line - CDIAC).

Confirmation that rising carbon dioxide levels are due to human activity comes from analysing the types of carbon found in the air. The carbon atom has several different isotopes (eg - different number of neutrons). Carbon 12 has 6 neutrons, carbon 13 has 7 neutrons. Plants have a lower C13/C12 ratio than in the atmosphere. If rising atmospheric CO2 comes fossil fuels, the C13/C12 should be falling. Indeed this is what is occuring (Ghosh 2003) and the trend correlates with the trend in global emissions.
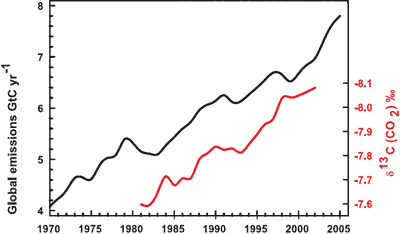

Figure 2: Annual global CO2 emissions from fossil fuel burning and cement manufacture in GtC yr?1 (black), annual averages of the 13C/12C ratio measured in atmospheric CO2 at Mauna Loa from 1981 to 2002 (red). ). The isotope data are expressed as d13C(CO2) ‰ (per mil) deviation from a calibration standard. Note that this scale is inverted to improve clarity. (IPCC AR4).

Further confirmation comes by measuring oxygen levels in the atmosphere. When fossil fuels are burned, the carbon in the fossil fuels are joined to oxygen, creating carbon dioxide. As CO2 increases in the atmosphere, oxygen decreases. Observations show oxygen levels are falling at a rate consistent with the burning of fossil fuels.
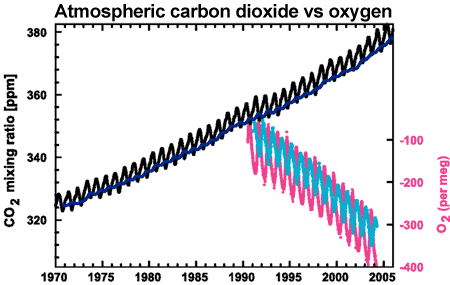
Atmospheric CO2 versus oxygen
Figure 3: CO2 concentrations from Mauna Loa, Hawaii (black) and and Baring Head, New Zealand (blue). In bottom right corner is atmospheric oxygen (O2) measurements from Alert, Canada (pink) and Cape Grim, Australia (cyan) (IPCC AR4 2.3.1 adapted from Manning 2006).

The human fingerprint in the increased greenhouse effect

Satellites measure infrared radiation as it escapes out to space. A comparison between satellite data from 1970 to 1996 found that less energy is escaping to space at the wavelengths that greenhouse gases absorb energy (Harries 2001). Thus the paper found "direct experimental evidence for a significant increase in the Earth's greenhouse effect". This result has been confirmed by more recent data from several different satellites (Griggs 2004, Chen 2007).
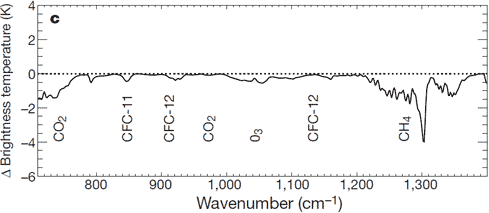

Figure 4: Change in spectrum from 1970 to 1996 due to trace gases. 'Brightness temperature' indicates the equivalent blackbody temperature (Harries 2001).

That less heat is escaping out to space is confirmed by surface measurements that find more infrared radiation returning to earth. Several studies have found this is due to an increased greenhouse effect (Philipona 2004, Wang 2009). An analysis of high resolution spectral data allows scientists to quantitatively attribute the increase in downward radiation to each of several greenhouse gases (Evans 2006). The results lead the authors to conclude that "this experimental data should effectively end the argument by skeptics that no experimental evidence exists for the connection between greenhouse gas increases in the atmosphere and global warming."
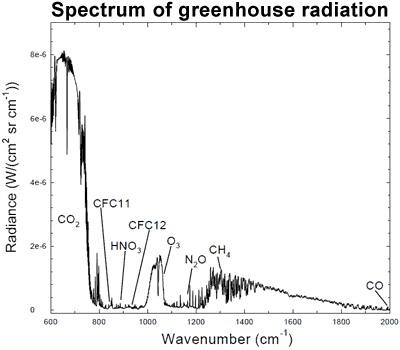

Figure 5: Spectrum of the greenhouse radiation measured at the surface. Greenhouse effect from water vapor is filtered out, showing the contributions of other greenhouse gases (Evans 2006).

The human fingerprint in temperature trends

Another human fingerprint can be found by looking at temperature trends in the different layers of the atmosphere. Climate models predict that more carbon dioxide should cause warming in the troposphere but cooling in the stratosphere. This is because the increased "blanketing" effect in the troposphere holds in more heat, allowing less to reach the stratosphere. This is in contrast to the expected effect if global warming was caused by the sun which would cause warming both in the troposphere and stratosphere. What we observe from both satellites and weather balloons is a cooling stratosphere and warming troposphere, consistent with carbon dioxide warming:
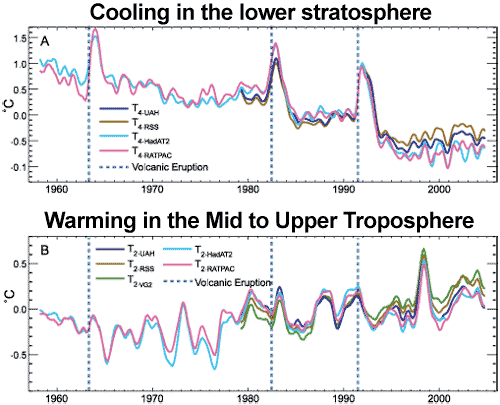
Cooling stratosphere and warming troposphere
Figure 6: (A) Change in lower stratospheric temperature, observed by satellites (UAH, RSS) and weather balloons (HadAT2 and RATPAC), relative to period 1979 to 1997, smoothed with seven month running mean. Major volcanic eruptions indicated by dashed blue lines (Karl 2006).

If an increased greenhouse effect was causing warming, we would expect nights to warm faster than days. This is because the greenhouse effect operates day and night. Conversely, if global warming was caused by the sun, we would expect the warming trend to be greatest in daytime temperatures. What we observe is a decrease in cold nights greater than the decrease in cold days, and an increase in warm nights greater than the increase in warm days (Alexander 2006). This is consistent with greenhouse warming.
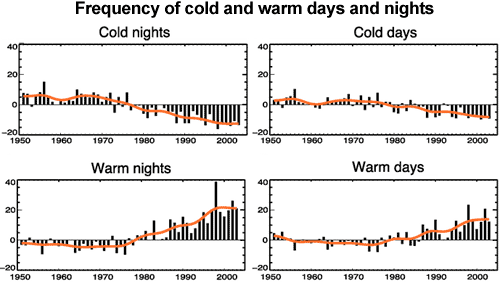
Frequency of cold and warm days and nights
Figure 7: Observed trends (days per decade) for 1951 to 2003 in the number of extreme cold and warm days and nights per year. Cold is defined as the bottom 10%. Warm is defined as the top 10%. Orange lines show decadal trend (IPCC AR4 FAQ 3.3 adapted from Alexander 2006).

0 0

Printable Version  |  Link to this page

Comments

1  2  Next

Comments 1 to 50 out of 85:

  1. Brilliant post, John. One question from a non-scientist. I always used to worry that burning of all this fossil fuel would reduce the concentration of oxygen in the atmosphere. When I mentioned it to those more knowledgeable than me, they'd give me a metaphorical pat on the head and say, "there, there, don't worry". I'm sure they're right and we shouldn't be concerned -- about this, anyway -- but can you put those falling oxygen levels into context for us, in terms of relative concentrations in the atmosphere? It's the first time I've seen a scientist mention this particular anthropogenic effect.
    0 0
  2. Agreeing with John Russell, the right axis on Fig 3 could use some explanation. Additionally, Fig 6a has a caption but Fig 6b doesn't (maybe self-explanatory). Your "eg" should be "ie" when explaining isotopes, no? Okay, enough nit-picking. Question: for anticipated solar effects on daytime and nighttime temperatures, are these model-based? I wonder if greater solar heating wouldn't generate more water vapour (greenhouse gas) that might then have the same apparent effect as expected for CO2. Could a similar comparison be done for winter versus summar, and would that also provide a useful fingerprint? Finally, I wonder if solar and CO2 forcings are simply predicted to have different effects spatially rather than temporally. Hmm, I notice that I'm asking questions about what models would predict under various scenarios. I always thought I agreed with your first statements about empirical results!
    0 0
  3. John R., It's pretty much straight up math for a decent estimate on the O2. We've increased CO2 by ~105ppm. But roughly an equal amount has been taken up by sinks, mostly the ocean. So we've used enough O2 to make ~210ppm CO2. So, one would figure we've decreased the concentration of O2 by ~210 ppm. John's chart shows a decrease of between 300 and 400, so I'm in the ballpark. Maybe John can explain the difference. It could be some other usage of O2, or a difference between ppm (by volume) and ppm (by count). As for how that affects the total amount of O2 available, not much. Air is 21% oxygen, so that's 210,000 ppm (again, not completely sure if that's by volume or count). So decrease relative to original value is 0.1 to 0.2 percent.
    0 0
  4. Actually, the production of CO2 and consequent reduction of atmospheric oxygen has been balanced a bit by loss of O2 from the oceans into the atmosphere. I typed "per meg" into google and found this website by Michael Bender at Princeton, and here's part of the explanation (scroll down past the nice figures to the bottom): "1 per meg = 0.001‰ using the standard stable isotope terminology. For reference, the amplitude of the annual cycle ranges up to about 80 per meg, and the annual decrease is about 20 per meg /yr. An error of 2.5 per meg in the rate of O2/N2 change translates to an uncertainty of ~ 1 Gt C/yr in the partitioning of CO2 sequestration."
    0 0
  5. Good article, but a question: Why was the water vapor filtered out in the "Spectrum of greenhouse radiation" figure 5 when it dwarfs all other gases (95% for H2O versus 5% for all other gases combined)? Also, wouldn't increased water vapor cause the same effects as warming the troposphere and cooling the stratosphere? I always like to look for the obvious reasons for large effects before pursuing minor ones. Am I missing something?
    0 0
  6. Great post. I'd like to add (Or are they to indirect?): 1. Ocean acidification. 2. Is there a fingerprint of the C13/C12 in biomass? /Martin
    0 0
  7. GFW beat me to the punch on explaining that the vast excess of oxygen relative to CO2 means that we haven't reduced our oxygen levels dangerously. One of your best posts yet John. The measured carbon isotope ratio graph alone is worth it in debates, and it's a result that makes perfect sense once one thinks of the theory.
    0 0
  8. nerndt asked "Wouldn't increased water vapor cause the same effects as warming the troposphere and cooling the stratosphere?" CO2 is well mixed through the atmosphere, so additional CO2 will end up in the stratosphere as well as lower. The extra below the stratosphere prevents infrared radiation from reaching the stratosphere, thereby keeping the stratosphere cooler. You're right that water vapor below the stratosphere has that same insulating effect. But the extra CO2 in the stratosphere radiates more IR out toward space (as well as in all other directions), thereby cooling the stratosphere more. Water vapor, in contrast, is not well mixed in the atmosphere. It is sparse in the stratosphere, so water vapor's increase in the atmosphere as a whole does not cause a proportionately large increase in the stratosphere. So increasing water vapor in the atmosphere as a whole does not increase that stratospheric radiative cooling of the stratosphere that does come from CO2 increase. That's to the best of my knowledge, but somebody please correct me if I'm wrong.
    0 0
  9. Atmospheric CO2 increase since the 19th century is likely to be at least partly a result of increased human CO2 emissions, as this article concludes. However, the correlation between atmospheric CO2 and “global temperature” is not so robust. The observed multi-decadal warming and cooling cycles cannot be explained by the gradually and smoothly increasing CO2 levels; the current global cooling despite record increase in CO2 is also hard to explain. A robust statistical analysis of the CO2 / temperature correlation, as proposed by pro-AGW scientists, Bart Verheggen, may shed more light on this apparent dilemma. http://www.examiner.com/x-9111-Environmental-Policy-Examiner~y2010m3d24-Global-warming-Bigger-than-Climategate-more-important-than-Copenhagenits-statistical-analysis Max
    0 0
  10. manacker @9 said, "The observed multi-decadal warming and cooling cycles cannot be explained by the gradually and smoothly increasing CO2 levels" That is true of atmospheric temperatures. However, the heat content of the oceans is much great than the atmosphere. We can see the effect in El Nino/La Nina years, but much of the ocean still cannot be measured directly. For that reason, the satellite measurements are much more reliable than atmospheric temperatures.
    0 0
  11. John, isn't the greater warming at the poles than the equator also a fingerprint of the greenhouse effect?
    0 0
  12. Anyone reading the blog post that manacker linked to should be careful not take it at face value. It is merely a story on the San FranciscoExaminer.com blog by writer Tom Fuller, about scientist Bart Verheggen's suggestions about the statistics. The scientist Verheggen himself vigorously objected to Fuller's interpretation of his work, in a comment on Fuller's comments thread:
    Tom, Thanks for highlighting the discussion at my blog. However, I think you’re overstating the significance. I replied to the quote you cited from whbabcock: “No, that’s not what this thread is about. It’s about a few things: Whether the temperature data contain a unit root, and what the consequences would be for how to analyze the time series. You would be correct with your inference if AGW was only based on (perhaps spurious?) correlation, but it’s not. It’s based on physics and a myriad of observations.” VS’ argument does not contradict “the theory” (of radiative transfer; or of AGW for that matter). It may mean that statistical significance in one (!) part of the observations is not as easily established as I’ve thought in my (admitted) statistical naievity. It has no bearing on physics based GCM studies about expected future climate changes. See also ourchangingclimate.wordpress.com/2010/03/18/the-relevance-of-rooting-for-a-unit-root/
    That last link is to a page where the scientist Verheggen further debunks the overinterpretation and incorrect interpretation by commenter VS and by the San Francisco Examiner's Tom Fuller. Commenter VS's incorrect interpretation has been further debunked in extreme detail by the professional time-series statistician specialist Tamino in his post Not a Random Walk.
    0 0
  13. manacker (max) notes that temperature does not always increase as CO2 increases. He concludes therefore that the relationship between CO2 and temperature "is not so robust". Well, CO2 is not the only thing affecting planetary radiative balance and hence air temperature. Worth mentioning is for example other greenhouse gases, the albedo and that energy is absorbed by oceans as well as ice and land (not only the air gets warmer). You also have to include feedbacks and complexity. Neither this nor variations in temperature diminishes the impact CO2 has upon the greenhouse effect, radiative balance and temperature. The link he refers to analyses part of the climate with statistics, not physics. The author asks for more investigations, but he does not bother to read/understand even part of all the information at hand. No scientist of today claims that CO2 is the only thing affecting temperature, yet a lot of people believe scientist think so. Why? /Martin
    0 0
  14. If anyone wants more details on Martin Hedberg's comment that the relationship between CO2 and temperature is indeed robust, see the Skeptical Science argument There’s no correlation between CO2 and temperature.
    0 0
  15. The frequency of cold and warm days and nights will be a function of cloud cover as much as anything, especially cold or warm nights.
    0 0
  16. shargash said "isn't the greater warming at the poles than the equator also a fingerprint of the greenhouse effect?" Polar amplification can result from any positive forcing, although there is less known about past Arctic Oscillation. See Moritz, R.E., C.M. Bitz, and E.J. Steig, 2002: "Paleo-data show that Arctic SAT in the 20th century was exceptionally high compared with the previous 300 years and that this was likely caused by GHG forcing, although there is no consensus on the cause of the Arctic cooling during 1940 – 60. In the past 30 years, the AO has played a key role in Arctic climate change. It is not clear whether the AO has been as important before this period or how it will contribute to the future. Most GCMs underestimate the magnitude of the trend in the AO when forced with 20th-century radiative forcing and continue to simulate weak trends under future forcing scenarios. In addition, these models tend to produce a tremendous spread in their predicted future warming in the Arctic. Clearly, the spread in warming cannot be attributed to their simulation of the AO. It is more likely that the disagreement stems from the parameterizations of surface albedo, cloud processes, and other feedback mechanisms in the high latitudes."
    0 0
  17. Well, Fuller article is just another example of people jumping to (wrong) conclusions after reading something the do not understand. We're getting used to this. The statistical debate is interesting and worth reading but it's a highly specialized field and not so easy to fully understand. In the meanwhile, better stick to good old (and rock solid) physics that tells us that surface temperature cannot be a random walk.
    0 0
  18. johnd, do you have any reference to data showing a trend in cloud cover coherent with your claim? Or you are just throwing a hypothesis?
    0 0
  19. Max, As others have mentioned there are other forcings besides CO2. Aersol forcings can account for much of the departure from CO2 increasing. John has another thread that discusses this. Where do you get your data for your claim of golbal cooling? What time period do you claim for this cooling? GISS shows continued increase, as does the NCDC data. Michael Sweet
    0 0
  20. Tom - thanks for your previous response to my question. Another question relavant to this debate: Does cloud cover change from daytime to nighttime? If so, by what amount? If for example cloud cover decreases 10% (SWAG - truly random numbers to give an example) when the sun hits the earth and increases 10% (SWAG 2) on the shaded side of the earth, wouldn't troposphere and stratosphere readings vary heavily based on cloud conditions? Clouds form the largest thermal blanket of the troposhere, followed by water moisture and then other gases. On a separate issue, I once heard (I'm afraid it was a while ago and I do not remember the source or time period for the events) that large solar wind bursts can send up to 10% of earth's cloud cover out into space. This could cause quick fluctuations in earth's temperature swings that would take years to recover. I once thought if we drastically expanded the Ozone hole we could quickly cool down the earth. Is this so? It would not be safe, allowing dangerous rays to hit the earth where the hole was made, but sure could cool things down quickly.
    0 0
  21. I found a link to effects on solar bursts to cloud cover Precipitation, cloud cover and Forbush decreases in galactic cosmic rays References and further reading may be available for this article. To view references and further reading you must purchase this article. D. R. Kniveton School of Chemistry, Physics and Environmental Science, University of Sussex, Falmer, Brighton, BN1 9QJ, UK Available online 6 August 2004. Abstract The results of a study to explore variations in cloud cover, over regions that are minimally affected by rainfall and heavy rainfall, and that are coincident with variations in the galactic cosmic ray flux, are presented. Using an extensive record of global satellite derived cloud and rainfall products from the International Satellite Cloud Climatology Project D1 data series and Xie and Arkin (J. Climate 9 (1996) 840), epoch superposition analysis of a sample of events of short term decreases in the galactic cosmic ray flux, is conducted. Analysis of data that is largely free from the influence of rainfall and heavy rainfall, averaged over 10-degree geomagnetic latitude () bands reveals that cloud cover is reduced at high latitudes, and at middle and lower (including equatorial) latitudes over regions of relatively higher cloud cover, over both land and ocean surfaces, while increasing over ocean surfaces at middle and lower latitudes in regions of thinner cloud. Author Keywords: Cosmic rays; Clouds; Precipitation; Climate; ISCCP; Forbush decrease; Solar variability Article Outline 1. Introduction 2. Method 3. Results 4. Discussion and conclusion Acknowledgements References
    0 0
  22. manacker Your observation reflects a common fallacy in how people are looking at Climate Change. We live on the surface of the Earth and to us 'climate' is effectively air temperature. All the different climate models are making predictions about future air temperatures (among other factors) so we are interested in whether they are correct. However, the air isn't the climate. It is one part of it, albeit the part we are interested in. The climate is actually the air, oceans, land surface, ice and some would argue, the biosphere. And the key thing we need to be looking at if we are seeking confirmation of AGW is energy not temperature. Ultimately the theory is that multiple different factors - GH gases, H2O feedback, Aerosols, Clouds, Albedo change, Solar output variations an then the complex interactions of all these in the 3 Dimensional real world will lead to an energy imbalance for the planet - Energy Out being less than Energy In or the so called Radiative ImBalance. So there is a net accumulation of heat within the environment. So the key correlation is between Radiative Balance and Total Heat Content for the planet. And as John has shown well here, this connection is very clear cut. The ext important correlation is Radiative Balance vs the various factors causing it. Again John has higlighted these well here. The largest area of uncertainty is Aerosol/Cloud effects. Next is the break up of where the heat is accumulating. 90% or more is in the oceans with the atmosphere making up around 3%. The atmosphere is small in enegy terms compared to the oceans and various heat transfer mechanisms that operate between air and oceans mean that air temps can be volatile. Small, percentage wise, changes in the oceans can flow through to much larger changes in the air. Also, this combination of a large, slowly accumulating, heat reservoir and a smaller, volatile one also means that there can be significant time lags between an initial heat injection and the consequent temperature change in the air. So attempting to do a statistical correlation of one forcing factor vs one small, time lag dependent and volatile consequence is a rather meaningless exercise. I haven't read the article although I have heard of others like this done by econmists. Either they don't understand enough of the physics to know which correlations to look for, in which case their mistakes are honest ones. Alternatively the act of focusing on a narrow aspect of the science so it can be attacked is a classic strawman argument and a common technique of AGW denialists, in which case my view of them is less charitable. Look at the range of views put forward by denialists. How many of them are loudly trumpeting how radiative balance and Total Heat Content are the smoking gun that AGW is all a fraud. Rather cherry pick and keep the focus on small details. You can always pick the strawman when the real, live, 3 dimensional real man enters the room. Thats why the denialists don't touch this question.
    0 0
  23. Glen @ 22. VS has just done an analyses of temp rise, comparing up to 1936 (supposedly natarul) to 1936 to 2008 (supposedly more AGW). His result just simply states that the recent temp rise does not fall out of the boundaries of natural causes. He clearly states that this in no way disparages the CO2 hypothesis. He has not looked into that aspect yet. Who knows if he will. Tom - VS has not been debunked by Tamino. Tamino helped to show VS that temp is not a random walk, which he has admitted. What I see coming out of this post @ Bart's, is like here and @ Lucia's, we are starting to see more and more the possibility of "both sides" (Gawd how I hate that term!) starting to work together, putting strengths together to really nail this issue down. Eduardo has said that he would welcome working with a statistician of high calibre. Could the halls of hell be freezing over? Do you think that one day we may see a paper by M & M - Mann and McIntyre??? :)
    0 0
  24. Excellent Post, very well written. Perhaps your best one yet. I have some questions that I will post later, but I wanted to first give you kudos.
    0 0
  25. re: Leo G at 09:03 AM on 29 March, 2010 Leo, statistical analyses are meaningless outside of the context of the physics of the system of interest. One can set up false premises, and come up with any conclusions from a bit of statistical numerology. Your example is a case in point: the temperature rise to 1936 certainly wasn't natural (false premise). Atmospheric CO2 levels rose from 286 ppm to 308 ppm in the period from the mid-19th century up to 1936 (high resolution [CO2] record), and inspection of the long term CO2 record, together with understanding of human greenhouse gas emissions, indicates that this rise was not natural. That change in [CO2] should give a global surface temperature rise of ~0.3 oC at equilibrium under the mid range of Earth climate sensitivity to enhanced greenhouse forcing (3 oC rise per doubling of [CO2]). The global surface temperature rise in the period from the mid 19th century to 1936 was around 0.3 oC (e.g. Hadcrut reconstruction ). So it’s very likely that a substantial amount of the warming to 1936 was due to very large anthropogenic enhancement of greenhouse gas concentrations that had accrued already through the first third of the 20th century. Of course if you really want to understand the temperature evolution (over the last 150-ish years say), one needs also to factor in the rest of the known physics – i.e. the known aerosol emissions and their forcings; the known volcanic emissions, and the amplitudes of their negative forcings (these account for the suppressed late 19th-early 20th century temperatures); the solar contributions; the contributions from black carbon and from land use changes etc.; the response times of various elements of the climate system etc. etc…..i.e. the sort of attribution studies done here and here . To throw away all knowledge of the physics of a system, and then attempt to draw conclusions from a statistical analysis of a single parameter is hopeless for scientific understanding. Statistics is an adjunct to physical/empirical analysis. It has no meaning in isolation.
    0 0
  26. Leo, I second Chris's reply.
    0 0
  27. nerndt, the effects of cosmic rays on cloud cover are discussed in It’s cosmic rays. Be sure to also click on the links in the "Related Links" box at the bottom of that post. Those other threads are the appropriate places if you want to continue discussing that topic. It is off-topic for this thread we are on now. By the way, you can easily find the appropriate threads by using the Search field at the top left of every Skeptical Science page. For example, you can search for "cosmic rays" or "clouds."
    0 0
  28. Tom Dayton writes: It is merely a story on the San FranciscoExaminer.com blog by writer Tom Fuller, about scientist Bart Verheggen's suggestions about the statistics. Just to clarify -- As far as I can tell, there's no actual connection between the San Francisco Examiner newspaper and the "Examiner" web portal. Tom Fuller just seems to be a random individual who provides commentary at the latter site. He doesn't seem to be connected with the newspaper, though lots of web postings seem to identify him as "a columnist for the San Francisco Examiner".
    0 0
  29. OK, as an Earth scientist and skeptic with no climate science background but an understanding of long term natural changes to the planet and solar system, you have established to my satisfaction that there is CO2 related AGW. However, this does not explain multi-decadal warming and cooling cycles evident in the historical data that appear on lack of other convincing evidence to be solar related. Also on the basis of (Evans 2006) GHG data percentages, water vapour is having a 25x proportionally massive effect compared to CO2 which is directly contributing less than 5% of the total effect. How then is CO2 the main driver of GW? Various authors have argued that the dominant WV effect is a direct result of the expanded evaporation cycle of warmer seawater caused by the CO2 effect, therefore CO2 is the main driver! Where is the verified experimental or actual measurements to support this strange assumption, or its corollary that ongoing atmospheric increases in CO2 above 400-500ppm will automatically create a tip over effect into runaway spiraling catastrophic warming? This critical data is now urgently required because without it one can only conclude that it is wishful thinking or worse to blame fossil fuel generated CO2 for most of the current global warming and its supposed undesirable effects. Lets get the science more exact and in perspective. Until we can clearly see that current climate changes are way outside the normal range over the last millennia, we should only conclude that mankind has (should)or can have a marginal effect on global climate. A possible exception being if we have a massive nuclear exchange creating a radioactive dust blanket thus cooling the planet for a while. This does not mean we should be complacent about the matter and not try to ameliorate our polluting way and thus protect the planet, as we clearly are massively affecting our environment by our burgeoning population increase and industrialization driven by our depleting fossil fuel resources.
    0 0
  30. Chris, whole heartedly agree. And it would be interesting to see VS continue on and start inputting all of the factors you state. There has already been corraboration from the likes of Tamino, Bart, Eduardo, etc. Not that they have sat around with a few beers and politely discussed it, there has been some hammering, but all have looked at the issue through the others eyes. What I find interesting about the VS thing, is that there is finally a dialogue happening. Over 700 posts, which 6 months ago, would more then likely have been shut down quite quickly. On Lucia's blog, Zeke, Carrott Eater, Nick Stokes not only post their views and results, but again, a dialogue. Here at John's, since I've been visiting, there has always been this courteous back and forth between disparate views. I just sense that there has been a "step change" in relationships between the pro and cons. Of course, like everything in this world, there will be a lag, before it manifests at the very top! Call me an optimist. It really does bother me to see all of the intelligence wasted by tribalism. I guess you could say that I am finding myself firmly planted in Judith Currie's camp. As Picard would say, "Engage!"
    0 0
  31. John, I took a whack at explaining stratospheric cooling and I have to say it is difficult to get a handle on and to explain. The link below is my effort: Stratospheric Cooling The key points I took from this: 1) Ozone loss has contirubuted to about 50% of the cooling, CO2 the other 50%. 2) Ozone has begun to increase since 1993 which will offset some of the GHG-caused cooling, especially in the lower stratosphere. 3) The greatest cooling appears in the upper stratosphere near 40–50 km. Ozone concentration above 35 km is minimal so ozone depletion is much less a factor at these levels than cooling due to CO2.
    0 0
    Response: "I took a whack at explaining stratospheric cooling and I have to say it is difficult to get a handle on and to explain."

    Why do you think I spent one sentence on it then hurried on?

    That's a great resource you've got there on stratospheric cooling. I've added a new Further Reading section to the "It's Not Us" page linking to your resource. I've also added it as a resource in the Global Warming Links page on "It's Not Us". Thanks for the link!
  32. Bob Close wrote "However, this does not explain multi-decadal warming and cooling cycles evident in the historical data that appear on lack of other convincing evidence to be solar related." So what, Bob? Obviously a cross-decadal upward trend in CO2 or anything else cannot explain variations counter to that trend. Who is claiming it should? (Certainly not Trenberth!) CO2 would have to explain (track/predict/correlate with) all variations in temperature only if CO2 were the only cause of temperature. But a fundamental basis of climatology is that CO2 is not the only driver of climate. Therefore the correlation between CO2 and temperature will not (cannot, must not) be anywhere close to perfect unless the time span is long enough for other forcing and feedbacks both positive and negative to wash each other out. Even then, the correlation with CO2 will be much less than perfect, because other, non-washed-out forcings and feedbacks will interfere. But those effects can be subtracted from the correlation, leaving us with a much closer to pure correlation with CO2--which is much greater than zero. For example, the effects of the Sun's 11-year up and down cycles can be removed most simply by plotting the 11-year running average of temperature. More sophisticated analyses yield estimates of the proportion of temperature increase that is explained by (correlated with, predicted/postdicted by) various aspects of the Sun's activity. For example, solar radiance accounts for a substantial portion of warming for the first half of the 20th century, but not since then (see It’s the sun). A purer measure of the CO2 correlation also can be gotten by looking at total energy rather than only at air temperature, as Glenn Tamblyn explained well. Finally, as chris explained, the causal attribution of CO2 to temperature most certainly is not based only on correlation! The theory was started in the early 1800s and continued to be developed based on formal experiments on fundamental physics, for many decades before measures of the Earth's temperature were sufficient to even begin to look for observational correlations as empirical support for the theory's predictions. I suggest you get an overview by reading the free online book The Global Warming Debate.
    0 0
  33. Bob Close, you asked how CO2 can be the main driver of global warming, when its direct effect is smaller than the effect of water vapor. Here is the thread where that is explained: Water vapor is the most powerful greenhouse gas. CO2 is the driver of other mechanisms that also increase temperature. Water vapor increase is one of those. Those same positive feedbacks would be driven by an increase in the Sun's radiance, if that were happening now. (But it's not; if anything, radiance has been decreasing since at least the 1970s and maybe as far back as the 1950s.) See climatologist Richard Alley's talk at the 2009 American Geophysical Union conference, "The Biggest Control Knob: Carbon Dioxide in Earth's Climate History."
    0 0
  34. Interestingly enough Richard Alley by his own admission is not a climatologist but rather an Earth Scientist/Geologist like Bob
    0 0
  35. GFW (and others who may have a more concrete answer): I'm guessing the value on the right is the fall in O2 concentration relative to the O2 concentration, rather than relative to the full atmosphere. Just eyeballing it, O2 falls by about 200 "per meg" and CO2 rises by about 20 ppm in the same period. Oxygen is about 20% of the atmosphere, so if my interpretation is correct, that's a fall of 40 ppm of the oxygen concentration for a rise of 20 ppm CO2. One oxygen molecule becomes one CO2 molecule during combustion and about half the CO2 ends up in the ocean, not the atmosphere... so the figures are looking remarkably consistent at this point. To anyone familiar with the numbers or papers, is this looking correct? I'm at a loss to explain how people still don't accept that about a third (and rising) of the CO2 in the atmosphere is there because of humans.
    0 0
  36. On the other hand, I don't see the need to refer to the oxygen concentration at all. We know how much fossil fuel we're burning, we know how much oxygen it takes to burn it. Is the argument that the oxygen is not being replenished by photosynthesis? I guess I have heard some skeptics make that argument.
    0 0
  37. John (or somebody),can you explain a bit more about the units in figure 3, and can we draw any conclusions from the implied stoichiometry ? If I postulate that a lot of carbon has come from methane (oil/gas field "flaring" or release from biogenic stores such as deep-sea clathrates or arctic perma-frost regions), rather than coal, then would or should (or might?) this show up in both ? By which I mean specifically: a) the carbon isotope ratio, and b) the amount of oxygen consumed: that is one atom of carbon will consume one molecule of O2, but one molecule of methane will consume twice as much O2. Does methane in deep-sea clathrates or "permafrost peats" show the same isotope distribution as "fossil-fuels" ? Also, when I look at figure 4, the stand-out effect is the large change in the methane absorption-band. For me, this is consistent with either release from "recent" biogenic stores (permafrost, peat etc) or possibly flaring-off from oil drilling. OK, I don't access to the numbers, but I presume that this issue has been addressed? Figure 1. The up-tick in atmospheric CO2 levels appears to predate the up-tick in CO2 levels attributed to humanity. Why so? I'm intrigued by the addition of data about cement manufacture, something I hadn't thought much about before. I would love to see the estimated numbers on that.
    0 0
  38. Oh, yes... I forgot about the role of burning hydrogen in my quick calculation. For long carbon chains, you get more oxygen going into carbon dioxide than water, so my calculations are in the ball park, but I'd be interested in seeing a slightly more detailed sum.
    0 0
  39. Bob Close writes: Where is the verified experimental or actual measurements to support this strange assumption, or its corollary that ongoing atmospheric increases in CO2 above 400-500ppm will automatically create a tip over effect into runaway spiraling catastrophic warming? "runaway spiraling catastrophic warming" seems a bit over the top, don't you think? Nobody is suggesting "runaway" warming a la Venus. Doubling CO2 will probably lead to around 3C of warming on average. The actual impacts of this will be negative enough, particularly due to amplification of the hydrologic cycle.
    0 0
  40. This evidence (John C.) is very logical and precise. But not quite. Skeptics still have a lot of work yet. Two examples: ice cores and temperature of the lower stratosphere. 1st Data from ice cores. - even if we reject all 19 charges Jaworowski (http://www.someareboojums.org/blog/?p=7) it will last us - being for decades - "diffusion in firn" - smoothing results from ice cores. - results from the ice core (to 1958) do not have any data to confirm the land. Only data from the cores from the seabed (foraminiferal, Spongia - low resolution in time and are often subjected to high pressure - the slow dissolution of carbonate), confirm the data from the cores. - Data on the land of ancient CO2 concentrations in the atmosphere: delta 13C, ratio of C3/C4 plants, stomata index - they are fundamentally different from data from ice cores. Yes, we can say that these proxies affect temperature, humidity, precipitation. However, - these vectors function; for example, the stomatal index - in a different direction than for the C3/C4 and delta 13C. However, if we compare Graph: "Speleothem evidence for changes in Indian summer monsoon precipitation over the last 2300 years" on those page: http://people.ku.edu/~lgonzlez/ (Kansas University); whit this graph: http://www.ncbi.nlm.nih.gov/pmc/articles/PMC129389/figure/f2/, we see the same pattern of all 3 proxy changes over time. [...] E.g. this paper: "Climate and CO2 modulate the C3-C4 balance and _13C signal in simulated vegetation" Flores et al. 2009, Clim. Past Discuss., 5, 1187–1213; proves that the role of humidity is negligible here, as well as (probably) the temperature. The delta 13C, C3/C4 (density of stomata?) determines only the concentration of CO2. 2nd After each eruption "into the stratosphere," the lower stratospheric temperature increases (http://omsriram.com/GlobalWarming_files/Global19.jpg.). Despite an increase in CO2 concentrations in the atmosphere. Since the explosion of Mount Pinatubo, over 15 years throughout the stratosphere the temperature continues to rise (http://www.acd.ucar.edu/Research/Highlight/strat-cooling.jpg) ...
    0 0
  41. P.S. Thank you John for the Polish version ...
    0 0
    Response: Don't thank me, thank Irek Zawadzki who did the translation :-)
  42. I'm having trouble reconciling a couple of things and I'm hoping someone here can help me with it. The fraction of CO2 that humans emit annually that also stays in the atmosphere is around 40-50%. (Some studies indicate a possible change in the fraction, and some do not, but that is not the point I'm having trouble with.) The CO2 that we put in the atmosphere takes hundreds of years to be absorbed by natural processes. So, my problem is that, if around half of human emissions is absorbed quickly, and that has been the case for most of the time that we've been adding to the CO2 content significantly; why does it take so long to absorb the rest? Is it the case that surface layers on land and sea quickly reach an equilibrium with the atmosphere, but that turning over the land takes, umm, a very long time, and turning over the ocean layers takes hundreds of years?
    0 0
  43. Chris G, there are multiple sinks and sources of CO2, and they operate on different time scales. Click on the links and look at the pages I point to in my comment on another thread. I'm not sure those will answer your question, but if not, say so.
    0 0
  44. Thanks Tom, my take-away point from the links is mainly that the sinks that absorb CO2 quickly, in aggregate, also tend to release it quickly, and that the sinks which result in a long period of sequestration are also slower acting on the absorption side. That's pretty much where I was going, but the links helped me get there. Now I'm thinking about ocean cycles and speculating that there may well be 'echos' of CO2 content in the atmosphere as water that went to depth during a period of high atmospheric CO2 content resurfaces. I wonder what that would look like on a graph.
    0 0
  45. Stuart @35, go to the link I posted @ comment 4. I think you'll find that per meg means change relative to Nitrogen. Ah, now I realize that my link doesn't work (why?), so here I'm going to risk raising our host's ire by posting a url: http://scrippso2.ucsd.edu/how-does-one-relate-ppm-and-meg-units%3F Here is the url I tried to link previously: http://geoweb.princeton.edu/people/bender/lab/research_o2n2.html Sorry John. So, if 4.8 per meg oxygen = 1 ppm, and eyeballing indicates about -200 per meg oxygen (so 42 ppm) and about +25 ppm CO2, it looks like oxygen has dropped quite a bit more than CO2 has increased. As others have indicated, though, we know quite a bit of CO2 has gone into the ocean and soils. If 50% of CO2 or less remains in the atmosphere, then we would expect a decline of at least 50 ppm oxygen. However, because of ocean warming, oxygen is being released to the atmosphere, and therefore we see a decline of only 42 ppm. I hope that's correct.
    0 0
  46. Riccardo at 07:46 AM on 29 March, 2010, as far as I know there is no data regarding cloud cover, and certainly no historical data which is most unfortunate. The relationship of cloud cover and hotter days and warmer nights is as well understood as is the relationship of standing in the rain without an umbrella and getting wet, but whether or not anyone has been able to measure the effects of either and translate that into some objective measurement does not alter the reality of either.
    0 0
  47. johnd, it's not the (known) effect that matters but its claimed global trend which should drive the frequency.
    0 0
  48. I question the assertion that the relationship c13/c12 may indicate that the increase of CO2 in atmosphere is the result of burning fossil energy. As the CO2 from the combustion, it is logical that he, for his temperature, to go position in the upper layers of the atmosphere. The absorption of CO2 by oceans and plants tend to dominate the CO2 released by decomposition of organic matter (CO2 cold).
    0 0
  49. To Chris G #42. I may not be an answer to your question, but worth mentioning: It is no law that it should be about half of our emissions, its more of a coincidence that we have increased the emission to be about twice the amount being absorbed by oceans and biomass. If we reduced our emissions by 50% tomorrow, about the same amount would be absorbed and hence the amount of CO2 in the atmosphere would stay the same. If we doubled our emissions tomorrow, only 25% would be absorbed. Natures capacity to absorb our emissions should rather be measured in tons (mass) than in percentage. Preindustrial carbon-cycle was smaller than the carbon-cycle is today. The absorption in water and biomass has increased as our emission has increased. /Martin
    0 0
  50. @35 Stuart. Thanks! per meg relative to original is likely the correct interpretation. I made two errors that canceled to about a factor of two. @49 Martin. I don't think you're right about that. I believe the short term ocean sink is closer to a simple diffusion equilibrium between the atmosphere and the upper (well mixed layer) of the ocean. That would explain why it's been a roughly constant fraction (even when human emissions were half what they are now, contradicting one of your predictions). Then the remaining fraction has to remain in the air until slower processes remove it (organic "rain" to the bottom of the ocean, geologic burial, etc.) @42 Chris. What I just said to @49 Martin may be a useful way to think about it, but it's a considerable simplification. The IPCC AR4 says
    About 50% of a CO2 increase will be removed from the atmosphere within 30 years, and a further 30% will be removed within a few centuries. The remaining 20% may stay in the atmosphere for many thousands of years.
    which is a more nuanced statement based on a more complete understanding.
    0 0

1  2  Next

You need to be logged in to post a comment. Login via the left margin or if you're new, register here.


The Consensus Project Website

THE ESCALATOR

(free to republish)


© Copyright 2024 John Cook
Home | Translations | About Us | Privacy | Contact Us