Climate Science Glossary

Term Lookup

Enter a term in the search box to find its definition.

Settings

Use the controls in the far right panel to increase or decrease the number of terms automatically displayed (or to completely turn that feature off).

Term Lookup

Settings


All IPCC definitions taken from Climate Change 2007: The Physical Science Basis. Working Group I Contribution to the Fourth Assessment Report of the Intergovernmental Panel on Climate Change, Annex I, Glossary, pp. 941-954. Cambridge University Press.

Home Arguments Software Resources Comments The Consensus Project Translations About Support

Twitter Facebook YouTube Mastodon MeWe

RSS Posts RSS Comments Email Subscribe


Climate's changed before
It's the sun
It's not bad
There is no consensus
It's cooling
Models are unreliable
Temp record is unreliable
Animals and plants can adapt
It hasn't warmed since 1998
Antarctica is gaining ice
View All Arguments...


Username
Password
New? Register here
Forgot your password?

Latest Posts

Archives

Greenland ice loss continues to accelerate

Posted on 11 October 2011 by John Cook

The latest measurements continue to measure accelerating mass loss from the Greenland ice sheet. The latest data from the GRACE satellites (noting that it doesn’t include the full 2011 summer season, ending in July 2011) shows that Greenland mass loss has been steadily increasing since satellites began measurements in 2002. The mass loss started spreading up the northwest margin a few years ago.

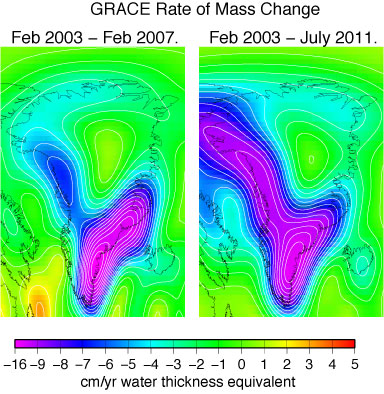
Figure 1: rate of mass change from Greenland over 2003-2007 and 2003-2011 periods. 

The average mass loss from Greenland over 2002 to 2011 is 225 billion tonnes per year. This rate of mass loss has been increasing over the last decade. There was also an unusually large amount of mass loss during the 2010 summer due to extensive melting of snow and ice.

Figure 2: Greenland ice mass anomaly - deviation from the average ice mass over the 2002 to 2011 period. NOTE: this doesn't mean the ice sheet was gaining ice before 2006 but that ice mass was above the 2002 to 2010 average.

Many thanks to John Wahr for sharing the images and Tenney Naumer from Climate Change: The Next Generation for passing it onto SkS.

0 0

Printable Version  |  Link to this page

Comments

Comments 1 to 40:

  1. Every time SkS runs an update of this graph I have a hard time wrapping my brain around exactly what it says. So, I'm going to assume I'm not the only one staring at his or her monitor with a deeply furrowed brow, and ask if it means what I think it means... The data point for July 2011 looks to be almost exactly -1,100 GT. This means that it's 1,100 GT below the average of the July observations for 2002 through 2011, inclusive. Or does it mean that the July 2011 observation was -1,100 GT below the average of all 115 monthly observations (Jan 2002 through July 2011, inclusive)? Or is it something else entirely? Given the cyclic nature of the data, I think it's the second version, comparing each month to the average for the whole data set. In any case it means Greenland is losing a terrifying amount of ice.
    0 0
  2. @Lou: the graph's caption clearly states that it is based off of the average ice mass over the period 2002-2011. And yes I think you are correct regarding the expectation of cyclical patterns. It would also be incorrect to linearly connect the dots if they were not all based off of the same baseline.
    0 0
  3. And the question is, if this iceloss is genuine, why's it happening? Not due to warming. http://www.real-science.com/wp-content/uploads/2011/10/ScreenHunter_39-Oct.-10-22.03.jpg Temps at Nuuk have been steadily declining over the past 80 years.
    0 0
    Response:

    [DB] See Tom's response to you below.

  4. Adam Gallon I'd suggest to widen your view to a larger portion instead of a single location, the picture may be completely different. As an example, take a look at Tamino's take.
    0 0
  5. You're right Arkadiusz Semczyszak, always stick to the science, as is done in this post. I'll never give up repeating this mantra.
    0 0
  6. Adam Gallon @3 links us to this carefully selected graph: Carefully selected, of course because he has carefully dropped of 60 years of data: Carefully selected also, because it wouldn't do for us to look at the wrong station data. And it certainly wouldn't pay to look at the Greenland ice sheet temperatures rather than one carefully selected location:
    0 0
    Response:

    [DB] Fixed image.

  7. Well, maybe I’ll add a little "interesting background" for the information above (ie post J.C.) - by Sundal et al. 2011: “Simulations of the Greenland ice-sheet flow under climate warming scenarios should account for the dynamic evolution of subglacial drainage; a simple model of basal lubrication alone misses key aspects of the ice sheet’s response to climate warming.” “The Greenland ice sheet is safer than we thought," said Professor Andrew Shepherd of the University of Leeds, coauthors.
    0 0
    Response:

    [DB] I would suggest reading the full paper, not just the abstract.  Sundal et al 2011 is fully consistent with other work in the area (as the authors note), including Schoof et al 2010, for example.  This is essentially stating that an enhanced Zwally Effect will not be the primary driver for the expected mass loss of the 21st Century (which Sundal et al note is still expected).

    It is through an enhanced Jakobshavn Effect (calving at the marine-terminating glacial fronts) that the mass-loss is expected to occur. 

    See Greenland Ice Sheet outlet glaciers ice loss: an overview and

    Zebras? In Greenland? Really? for more background.

  8. Arkadiusz Semczyszak yes, there's a lot of discussion on the physical mechanism behiand glacier sliding. Also, different glaciers behave differently depending on several factors. Whatever, 200+ GTon/year get lost.
    0 0
  9. It is interesting to note that even the small mass accumulation in the central highlands has disappeared. This would seem to indicate that we've reached the point where the entire island is now impacted by increased temperatures to a sufficient degree that it is more than offsetting increased precipitation. Antarctica, being much larger, still maintains temperatures well below zero in the deep interior and thus continues to show some mass accumulation there (though less than the mass loss around the edges).
    0 0
  10. This volume loss from Greenland Ice Sheet from GRACE is corroborated by the negative mass balances from Mittivakkat Glacier, thinning and retreat from outlet glaciers and appearance of new islands on the periphery such as at Kong Oscar or Upernavik Glacier. The evidence is clear regardless of the measurement technique.
    0 0
  11. Yes, that's interesting. I think the highlands are still significantly subzero even in summer (sorry, don't have a source)? Top is over 4000m/13000ft, so ~25C cooler than sea level? So presumably if the interior is now losing ice, it is due to increased glacial flow. Contributary factors then presumably include both increased pressure from above from the last decade of extra ice, and reduced back pressure from below as the periphery melts out?
    0 0
  12. It would be interesting to know the sea level rise represented by that lost ice.
    0 0
  13. Surface area of the earth's oceans = 360x1012 m2 1000Gt = 1012 m3 Therefore sea level rise = (1/360) m ~ 3mm.
    0 0
  14. (Since 2007 that is. Since 2002 we're looking at roughly twice that.)
    0 0
  15. Kevin(14): And coincidentally, 6mm is about the amount of the drop in sea level over the last 12 to 18 months due to increased rains over land and subsequent flooding. So we've effectively seen that huge amount of water move from ice in Greenland to water on land in various other places in roughly a decade. (Just to be clear, I am NOT drawing any other conclusions or implying anything by pointing this out. I think it's merely an interesting coincidence that helps highlight the complexity and interconnectedness of the environment.)
    0 0
  16. 7 Arkadiusz, that's a good point and it's great news. It seems the likelihood of getting multi-metre sea level rise from subglacial lubrication is pretty low, although Professor Shepherd has always made it very clear that these results need to be included in a complete model before you can constrain what this really means in terms of melt amounts. If you read the paper or look up one of his presentations you'll see that the effect was only noted in glaciers with big catchments. Smaller outlets (and glaciers in currently cooler areas) have not experienced the initial speed up yet, but if warming continues then there's a chance that there would be enough meltwater to trigger a speedup but perhaps not the efficient drainage. This effect might be tiny, but I get the impression it needs more work to quantify. Also, the work by Rahmstorf et al on the link between sea level rise and temperature suggests that the IPCC projections are probably on the low side. Maybe the relationship no longer holds, but if it does then current models are missing something to do with ice loss. That would also explain why sea levels are rising on the high end of IPCC projections.
    0 0
  17. This is an interesting contradictory topic. The ice loss of the ice cap is accelerating, we are being told every year. Nevertheless the sea level rise does not accelerate, but slows down. I think that we should realise that Grace does not measure ice mass, but only gravitation. If there are other changes in the earth crust that change the gravitation significantly (such as the ever more continuing rise of the land after the melting of the ice caps at the end of the last ice age), the Grace data are not reliable to monitor the volume of the present ice cap. See Wu et al, Nature Geoscience 3, 642 - 646 (2010).
    0 0
    Response:

    [DB] "The ice loss of the ice cap is accelerating, we are being told every year."

    You refer to the ongoing loss of the Arctic Sea Ice cap, which is indeed ongoing, but floating (and thus adds nothing to the sea level budget).

    The GIS is indeed losing mass, in a greater-than-linear fashion.  The ongoing SLR is indeed ongoing, when measured at periods long enough to be considered staitically significant.  See one of the many threads here on that subject.

  18. fydijkstra I guess you didn't notice mspelto's comment, to which I add that sea level depends on many factors other than Greenland loosing mass. I'm sure you realize this.
    0 0
  19. A separate data set is the laser altimetry data set, that revealed mass losses of 191 to 240 gigatons/year (Soresnon et al ,2011) for the 2003-2008 period.
    0 0
  20. Mspelto - Mauri, is it likely that we may see a slowdown in Greenland icemelt in the future, once all the glaciers with their "feet in the water" disappear?
    0 0
  21. fydijkstra @ 17 - "The ice loss of the ice cap is accelerating, we are being told every year. Nevertheless the sea level rise does not accelerate, but slows down." The loss of land-based ice has indeed increased and is contributing more to sea level rise than it was in previous decades. See: Revisiting the Earth's sea-level and energy budgets from 1961 to 2008 - Church (2011) From the abstract: "The cryospheric contributions increase through the period (particularly in the 1990s) but the thermosteric contribution increases less rapidly" I think you are confused about the large water mass exchanges between the land and the ocean that occur on year-to-year time frames - which temporarily lowers sea level. See argument 171 - Why did Sea level fall in 2010?
    0 0
  22. Interesting observation, the pattern of where the mass loss is occuring along the south & west of Greenland. Compare that to this graphic from Steve Brown's recent post on the Last Interglacial. The loss matches the pattern from the Eemian which is also a small indpendent support for the valifity of the data
    0 0
  23. #20 The reduction in the number of calving glaciers only occurs with significant thinning, which means more of the ice sheet is at a lower elevation so actual melting will increase, while iceberg calving would decline. Many of the calving glacier would tap well into ice sheet before not having their feet in the water. Take a look at the Petermann and Humboldt for example.
    0 0
  24. It seems to me that acceleration in the rate of ice loss from the GIS is doing no more than what Hansen and Sato 2011 predicted - doubling per decade. Trouble is, if it continues doing so, by 2050 the rate of loss will be in the order of 48,000 gigtonnes per annum. Then we shall have something to worry about!
    0 0
  25. Agnostic @24, exactly! At current rates of melt the Greenland ice melt is merely interesting, and mildly beneficial to inhabitants of Greenland (who gain more arable land). If the acceleration continues it will become a major cause for concern, though not, I think, catastrophic at any realizable level of ice melt.
    0 0
  26. Thanks Mauri.
    0 0
  27. In my rush to comment, I made a mistake at 24. Hansen and Sato predict doubling of GIS ice loss per decade which, by 2050 would result in cumulative loss of 48,000 gigatonnes with annual loss increasing to 3,200 gigatonnes per annum. Tom Curtis - I think that is right, mildly beneficial until the last 20 years of this century when RSL as much as ice loss seems likely to cause problems. Though I hear from Greenlanders in the far north west that they are already being caused problems by lack of sea ice inhibiting travel and hunting.
    0 0
  28. I have few questions: 1) What is the error associated with the GRACE measurements of Greenland? 2) How much will the central region of the ice cap be affected by accelerating glaciers around the fringes of Greenland? 3) How stable are the ice shelves in northern and eastern Greenland and how soon can we expect to see acceleration of glaciers in these regions? 4) What will happen once the glaciers retreat from the coast and the process of ocean carving ceases? Apologies for all the questions.
    0 0
  29. Tom Curtis: Have you seen this new exposed land, it is not arable and will not be for centuries. #28 Good questions and I only have to time to briefly address #3. The key glaciers with large floating tongues, not really considered ice shelves, are Petermann, Zacharaiae and Nioghalvfjerdsbræ (79) and Storstrommen. As Petermann the thinnest has shown these large floating sections are not that stable. All of these are still outlet glaciers feeding into a fjord and the loss of the floating ice results from thinning and will in turn lead to some acceleration. Ryder Glacier is another example but this glacier is small with respect to the others. Zacharaieis the most important because it taps into the heart of the ice sheet. Note figure 7 in that link.
    0 0
  30. @fydijkstra #17 Another thing to look at when it comes to sea levels: http://thinkprogress.org/romm/2011/10/02/332364/nasa-rained-so-hard-oceans-fell/ http://www.skepticalscience.com/Extreme-Flooding-In-2010-2011-Lowers-Global-Sea-Level.html
    0 0
  31. Hasn't anyone looked at sea level rise for the last 3 years? It is not happening. Ergo either the ice is not melting or the ocean is not warming make your pick but right now.If we go back 60 or 70 years there is very little warming maybe 2 or 3 tenths of a degree in the unadjusted record. This is not cherry picking folks it's the period of time over the last 150 years when we have spewed over 90% of the man made carbon dioxide produced over that period.
    0 0
    Response:

    [DB] "Hasn't anyone looked at sea level rise for the last 3 years? It is not happening."

    Adrian, 3 years is far, far too short of a period in time to be meaningful.  On such a short scale of time the noise in the data series drowns out the underlying signal.  Typically about 17 years of data is the minimum needed to deduce even a linear trend.

    SLR

    [Source]

    For further reading, I suggest Tamino's excellent piece on sea level trends, So What?

    "This is not cherry picking folks"

    Yes, I'm afraid it is.  Unless you're looking at a long enough record, say the whole record, your short period has no meaning:

    C&W 2011 SLR

    [Church & White, 2011]

    Yup, still happening...

  32. adriansmits#31: Not cherry picking? You've picked 3 years of sea level data and concluded 'go back 60 or 70 years there is very little warming'? If I look in the dictionary under 'cherry picking,' I'd see this type of analysis. Wake up and look at some real data. And find the right thread for sea level rise or 'its not happening.'
    0 0
  33. mspelto @29, I had in mind specifically the reduction of permafrost in the inhabited areas of Greenland in terms of increase of arable land. However, I bow to your much greater knowledge in this area.
    0 0
  34. Adrain Smits @31 - "Hasn't anyone looked at sea level rise for the last 3 years?" See comments 21 & 30. Links are provided there. And note the large short-term exchange of water mass in the pic below, which affects sea level. Adrian Smits -"......or the ocean is not warming" I think you've been here long enough to navigate your way around this site. Further attempts to derail this thread will be deleted.
    0 0
  35. Slightly off topic but I though it might be of interest Contribution of global groundwater depletion since 1900 to sea‐level rise Estimated global groundwater depletion during 1900–2008 totals ∼4,500 km3, equivalent to a sea‐level rise of 12.6 mm (>6% of the total). Furthermore, the rate of groundwater depletion has increased markedly since about 1950, with maximum rates occurring during the most recent period (2000–2008), when it averaged ∼145 km3/yr (equivalent to 0.40 mm/yr of sea‐level rise, or 13% of the reported rate of 3.1 mm/yr during this recent period). Considering groundwater comprises 30% of the total freshwater on the planet, increases in abstraction may have a significant contribution to future sea level rise.
    0 0
  36. Hyper, Yes, groundwater depletion has been an important factor in SLR, but often ignored in the conversation. Considering that Greenland has contributed 0.28 mm/yr averaged over the past half century (16% of the total), the estimated groundwater depletion over the same time frame (~0.23 mm/yr) is similar. The only larger contributors are mountain glaciers and thermal expansion.
    0 0
  37. Hyperactive Hydrologist I reached the same conclusion when I first read about Konikow's paper. However, as someone pointed out to me, Konikow doesn't take into account the construction of dams in his calculations. Dams offset most of the sea-level increase you would expect following groundwater extraction. This paper by Church probably gives a more comprehensive analysis of the situation.
    0 0
  38. Anne-Marie, Thanks for the link.
    0 0
  39. Been looking at the artic ice volume as reported by the Polar Science Center. Extrapolating their data suggests that the artic may be ice free in summer time around 2020. If that happens, what will be the estimated effect on Greenland ice loss?
    0 0
  40. Could anyone indicate where exactly I can find the data as presented in figure 2 above? That woulod be very helpful!
    0 0

You need to be logged in to post a comment. Login via the left margin or if you're new, register here.


The Consensus Project Website

THE ESCALATOR

(free to republish)


© Copyright 2024 John Cook
Home | Translations | About Us | Privacy | Contact Us