


 Arguments


Comparing Global Temperature Predictions
Posted on 18 October 2011 by dana1981
 At this point in the Lessons from Past Climate Predictions series, we're running out of global temperature predictions to evaluate, so now may be a good time to summarize what we've seen thus far. So let's just get right to the good stuff:
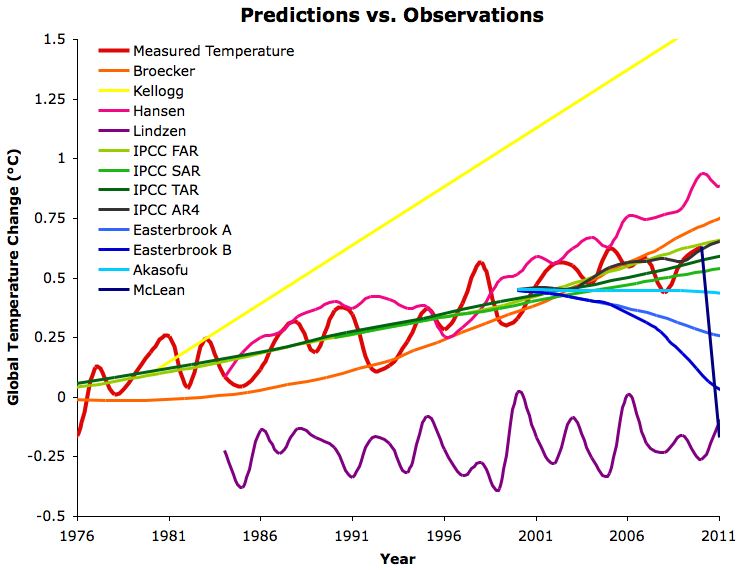
Figure 1: Various best estimate global temperature predictions evaluated in the 'Lessons from Past Climate Predictions' series vs. GISTEMP (red). The warmer colors are generally mainstream climate science predictions, while the cooler colors are generally "skeptic" predictions.
As you can see in Figure 1, the more mainstream climate science predictions (generally the warmer colors) have mostly done well (Kellogg in 1979 being the main exception), and the "skeptics" (generally cooler colors) have generally done rather poorly, universally predicting less warming than has been observed.
Note that for simplicity and clarity, the figures in this post only include the best estimate predictions/projections of each paper we examined, although some included uncertainty ranges, and others didn't. For details regarding each prediction, see the individual posts in the 'Lessons' series.
Figure 1 is a bit cluttered, but we can parse the predictions out by isolating the "skeptic" and mainstream predictions.
"Skeptic" Predictions
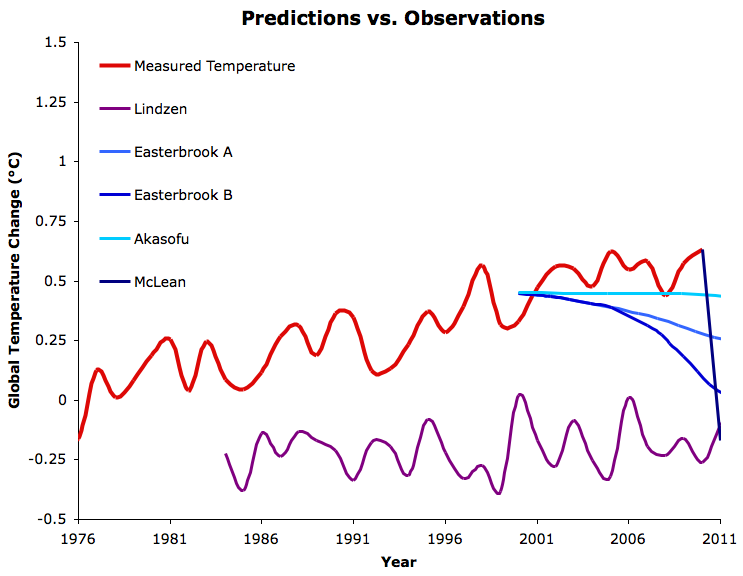
Figure 2: As in Figure 1, but just the "skeptic" predictions.
There are a few interesting things to note from these figures. For example, we were unable to identify any "skeptic" or global cooling predictions prior to 2000 (note that the few so-called "1970s global cooling predictions" were based on aerosol emissions scenarios which did not occur, and thus are not worth evaluating). The lone exception in Figure 2 is Lindzen's, which we reconstructed from comments he made in a 1989 MIT Tech Talk, but which is not a prediction he made himself.
Those few "skeptics" who have made predictions have not fared well thus far. McLean's prediction that 2011 would return to 1956-level temperatures sticks out in particular - we will do a post updating the status of his prediction in the near future. Akasofu, who predicted 0.5°C global surface temperature warming between 2000 and 2100, has thus far been the closest amongst the "skeptics". However, his prediction completely ignores the warming due to the increased greenhouse effect, and in general fails to examine the causes of the temperature changes that he models and predicts.
Mainstream Predictions
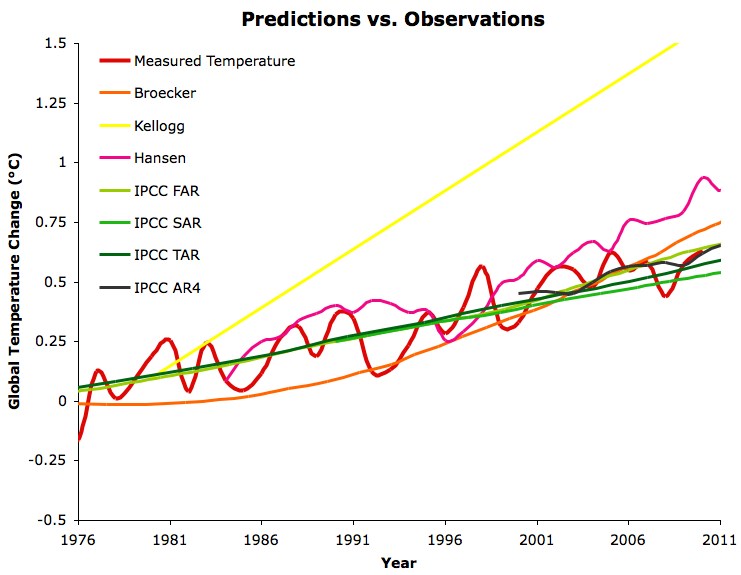
Figure 3: As in Figure 1, but just the mainstream climate science predictions.
The global warming predictions made by mainstream climate scientists have all fared reasonably well, with the exception of Kellogg's in 1979, whose linear nature we found puzzling. Hansen's 1988 prediction (we show his Scenario B with the observed greenhouse gas changes taken into account, as described in the Hansen Lessons post) has been somewhat high, mainly because the equilibrium climate sensitivity in the model he used was 4.2°C for doubled CO2, which is higher than today's best estimate of 3°C. Overall, the IPCC projections have thus far been the most accurate.
It's also interesting to specifically examine the projections which applied their models to most or all of the instrumental temperature record (Figure 4).
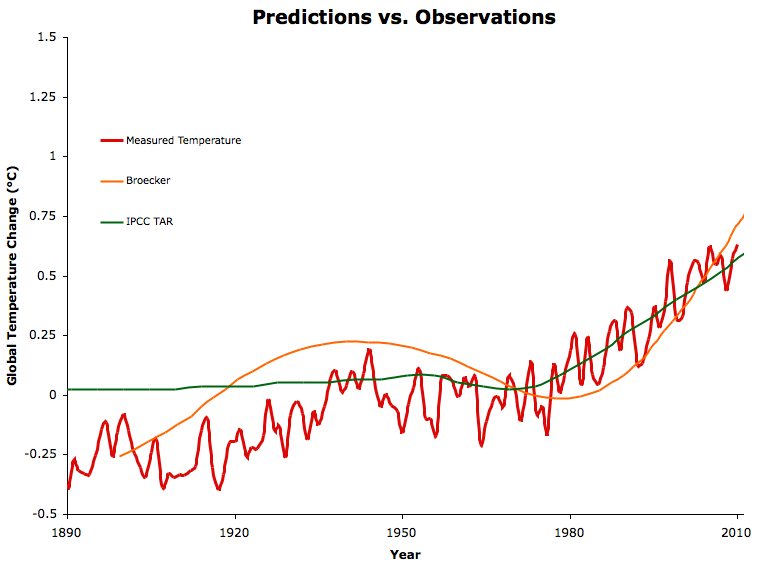
Figure 4: Broecker and IPCC TAR long-term model runs vs. GISTEMP (red).
The difference between the two models in Figure 4 is that Broecker attempted to incorporate 'natural cycles' (which he called 'Camp Century cycles', based on Greenland ice core records), whereas the IPCC TAR model only includes anthropogenic effects. The IPCC TAR model-data comparison clearly shows that human effects had relatively little influence over the early-20th Century warming, but dominated the temperature change since the mid-20th Century.
What's in Store?
Since the IPCC projections have thus far been the most accurate, it's worthwhile to see what we have in store if their accuracy continues. Currently we're on track with the SRES A2 emissions path, so we can consider this the 'business-as-usual' scenario.
Skeptical Science contributor jg has done a great job putting each of the predictions and the combinations above into an animated GIF, finishing off with the AR4 future projections for Scenarios A2 and B1 (Figure 5). Scenario B1 involves taking serious action to reduce greenhouse gas emissions.
Figure 5 final frame: IPCC AR4 Scenario A2 multi-model average global temperature projection to 2100 (blue) and Scenario B1 (green) compared to the 'danger limit' of 2°C warming above pre-industrial levels (red).
If we continue on a business-as-usual path, the IPCC AR4 projects that we are most likely on track for 4°C warming above pre-industrial levels by 2100. We will surpass the 'danger limit' of 2°C warming above pre-industrial levels by the mid-21st Century. Even in Scenario B1 we pass the danger limit, but by a much smaller margin. This is pretty strong evidence that we need to take action very soon to steer away from our current business-as-usual emissions path.


[DB] Please note that posting comments here at SkS is a privilege, not a right. This privilege can and will be rescinded if the posting individual continues to treat adherence to the Comments Policy as optional, rather than the mandatory condition of participating in this online forum.
Moderating this site is a tiresome chore, particularly when commentators repeatedly submit offensive or off-topic posts. We really appreciate people's cooperation in abiding by the Comments Policy, which is largely responsible for the quality of this site.
Finally, please understand that moderation policies are not open for discussion. If you find yourself incapable of abiding by these common set of rules that everyone else observes, then a change of venues is in the offing.
Please take the time to review the policy and ensure future comments are in full compliance with it. Thanks for your understanding and compliance in this matter.
[dana1981] I answered the question in comment #9. It would be off by 0.38°C in 2010.
Can you guys provide an update post 2016? How close is Hansen's prediction?