


 Arguments


16 ^ more years of global warming
Posted on 10 January 2013 by Kevin C
Update 21/02/2013: Troy Masters is doing some interesting analysis on the methods employed here and by Foster and Rahmstorf. On the basis of his results and my latest analysis I now think that the uncertainties presented here are significantly underestimated, and that the attribution of short term temperature trends is far from settled. There remains a lot of interesting work to be done on this subject.
Human greenhouse gas emissions have continued to warm the planet over the past 16 years. However, a persistent myth has emerged in the mainstream media challenging this. Denial of this fact may have been the favorite climate contrarian myth of 2012, first invented by David Rose at The Mail on Sunday with an assist from Georgia Tech's Judith Curry, both of whom later doubled-down on the myth after we debunked it. Despite these repeated debunkings, the myth spread throughout the media in various opinion editorials and stunts throughout 2012. The latest incarnations include this article at the Daily Mail, and a misleadingly headlined piece at the Telegraph.
As a simple illustration of where the myth goes wrong, the following video clarifies how the interplay of natural and human factors have affected the short-term temperature trends, and demonstrates that underneath the short-term noise, the long-term human-caused global warming trend remains as strong as ever.
In particular, once the short-term warming and cooling influences of volcanic eruptions, solar activity, and El Niño and La Niña events are statistically removed from the temperature record, there is no evidence of a change in the rate of greenhouse warming. This replicates the result of a study by Foster and Rahmstorf (2011) under slightly different assumptions.
The human contribution to global warming over the last 16 years is essentially the same as during the prior 16 years¹. Human-caused greenhouse warming, while partially hidden by natural variations, has continued in line with model projections². Unless greenhouse gas emissions are brought under control, we will see faster warming in the future³.
Implications:
- The 16-year temperature trend provides no evidence to suggest that human-caused greenhouse warming has slowed.
- The 16-year temperature trend provides no evidence to suggest that the consensus understanding of human-caused climate change is incorrect.
- The temperature record over the past 35 years is consistent with climate change being driven by human greenhouse gas emissions.
- Given that human greenhouse gas emissions are increasing, and that the natural influences do not show a trend on longer timescales, we must expect increasing global warming in the future.
Further Reading:
For details of the method, see the Advanced rebuttal to the myth 'no warming in 16 years'.
The results of this analysis are consistent with a statement by WMO Secretary-General Michel Jarraud:
"Naturally occurring climate variability due to phenomena such as El Niño and La Niña impact on temperatures and precipitation on a seasonal to annual scale. But they do not alter the underlying long-term trend of rising temperatures due to climate change as a result of human activities"
Credits: Video: Kevin C. Voiceover: Daniel Bailey. Advice: The SkS team.
Teaser graphics: What happened next? Does this look like global warming?
Footnotes:
We have attempted to keep the language in this video at the same non-technical level as the media stories it refutes. As a result, it has been necessary to simplify much of the terminology. The following notes are for technically literate readers.
¹ i.e. If a change in gradient is allowed at 1997 then the change in gradient is not statistically significant (even at the 1σ level).
² i.e. Within the envelope of AR4 trend projections.
³ On the basis of both AR4 projections and that global GHG emissions are increasing.
Update 21/02/2013: Troy Masters is doing some interesting analysis on the methods employed here and by Foster and Rahmstorf. On the basis of his results and my latest analysis I now think that the uncertainties presented here are significantly underestimated, and that the attribution of short term temperature trends is far from settled. There remains a lot of interesting work to be done on this subject.


 0
0  0
0
 The forcings of course include the volcanic and solar effects, and the El Nino term has been added in as well. The explanatory power for the 130 year record is very good indeed, and the El Nino term, which is critical for the impact on the short term trend, takes on an almost identical value. The model also shows the slowdown in recent warming, for the same reason - the El Nino trend is masking recent warming.
Unfortunately the forcing data is annual and only runs to 2010, so I couldn't use this approach for the video, but it certainly looks as though the longer term data supports a similar conclusion to that of the video. Integrating the two calculations is one of my longer term aims, and will I believe produce a more robust result.
But we can draw some conclusions. The fact that the forcings + El Nino explain the temperature record so well means that the temperature record does not provide an intrinsic reason for introducing other factors.
Could such factors exist? Let's invent such a factor - we'll call it 'climate elves' - and introduce it into the model. In order to be plausible the climate elves would have to operate in such a way that the model still reproduces 20th century temperatures. That eliminates a lot of potential elves (e.g. solar), but not all of them. For example, once the model is online you will be able to see that you can obtain a similar fit with lower sensitivity by reducing the aerosol term. We also can't rule out a long term ocean oscillation.
However, this calculation does not exist in isolation. For example the physical models, the glacial cycles, and climate on deep time all have things to say on this question. Suppose we introduce aerosol elves to reduce the aerosol effect and so climate sensivity, then we have to first reconcile this with the physical models. More seriously it becomes harder to explain the glacial cycle or indeed other paleoclimate features. If we reduce sensitivity too much then we can't even explain the observed volcanic cooling events.
Therefore while I expect climate elves exist (most likely in the form of an error in the aerosol term which could go in either direction, and maybe a long term ocean oscillation), the impact is unlikely to be very large. (And even a climate sensitivity of 2C(x2 CO2) rather than the consensus 3C doesn't buy us very long.)
Thus, given that the consensus estimates of climate sensitivity are based on a wide range of different sources of information, and both the simple and physical models explain the 130 year record with similar sensitivities, there is significant evidence basis to support current estimates of anthropogenic forcing. The scale of the natural and anthropogenic forcings are linked through the temperature record and the response function, and thus I think the statement in the video that 'what is left is the human contribution' is a fair assessment of the current state of knowledge.
The forcings of course include the volcanic and solar effects, and the El Nino term has been added in as well. The explanatory power for the 130 year record is very good indeed, and the El Nino term, which is critical for the impact on the short term trend, takes on an almost identical value. The model also shows the slowdown in recent warming, for the same reason - the El Nino trend is masking recent warming.
Unfortunately the forcing data is annual and only runs to 2010, so I couldn't use this approach for the video, but it certainly looks as though the longer term data supports a similar conclusion to that of the video. Integrating the two calculations is one of my longer term aims, and will I believe produce a more robust result.
But we can draw some conclusions. The fact that the forcings + El Nino explain the temperature record so well means that the temperature record does not provide an intrinsic reason for introducing other factors.
Could such factors exist? Let's invent such a factor - we'll call it 'climate elves' - and introduce it into the model. In order to be plausible the climate elves would have to operate in such a way that the model still reproduces 20th century temperatures. That eliminates a lot of potential elves (e.g. solar), but not all of them. For example, once the model is online you will be able to see that you can obtain a similar fit with lower sensitivity by reducing the aerosol term. We also can't rule out a long term ocean oscillation.
However, this calculation does not exist in isolation. For example the physical models, the glacial cycles, and climate on deep time all have things to say on this question. Suppose we introduce aerosol elves to reduce the aerosol effect and so climate sensivity, then we have to first reconcile this with the physical models. More seriously it becomes harder to explain the glacial cycle or indeed other paleoclimate features. If we reduce sensitivity too much then we can't even explain the observed volcanic cooling events.
Therefore while I expect climate elves exist (most likely in the form of an error in the aerosol term which could go in either direction, and maybe a long term ocean oscillation), the impact is unlikely to be very large. (And even a climate sensitivity of 2C(x2 CO2) rather than the consensus 3C doesn't buy us very long.)
Thus, given that the consensus estimates of climate sensitivity are based on a wide range of different sources of information, and both the simple and physical models explain the 130 year record with similar sensitivities, there is significant evidence basis to support current estimates of anthropogenic forcing. The scale of the natural and anthropogenic forcings are linked through the temperature record and the response function, and thus I think the statement in the video that 'what is left is the human contribution' is a fair assessment of the current state of knowledge.
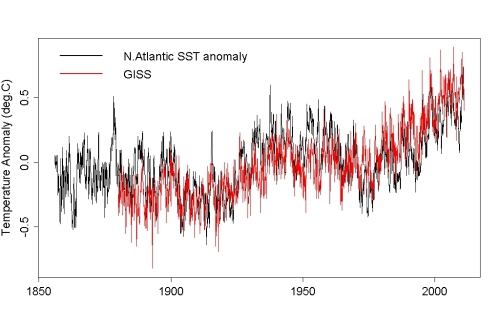 Even though the AMO index is constructed by detrending the north atlantic SST, it is very likely that the nonlinear component of global warming signal is still embedded in the index. The issue is that when you use the AMO index as a regressor, you are potentially trying to use part of global temperature to explain global temperature, which exaggerates the role of the AMO.
 For what it is worth, this crude model shows a strong correlation to global temperature rise over that period, with an r^2 of 0.754. The slope of the scatter plot of observed vs predicted temperatures is 0.72, indicating temperatures have risen faster than is predicted by this model:

 Global temperatures are really the cause, not the effect, of most of the AMO. Further evidence to this end comes from looking at lead-lag relationships (here's another Tamino post on this), where analysis shows a somewhat stronger correlation with AMO lagging temperatures by a month or two - and a negative delay is a very strong argument against causality. ENSO, by comparison, best correlates with an ENSO leading by 4-5 months, the correct causal direction.
If you attempt to relate AMO to global temperatures, there is a tendency to actually be subtracting the signal from itself, which leads to some very unrealistic estimates of climate sensitivity.
---
The PDO may have some influence on global temperatures, but quite frankly we (a) don't have a huge amount of data, and (b) the duration and strength of observed PDO changes don't scale to the rapid and large temperature changes of the last 150 years. I suspect (IMO) that the PDO is at most a minor influence.
Global temperatures are really the cause, not the effect, of most of the AMO. Further evidence to this end comes from looking at lead-lag relationships (here's another Tamino post on this), where analysis shows a somewhat stronger correlation with AMO lagging temperatures by a month or two - and a negative delay is a very strong argument against causality. ENSO, by comparison, best correlates with an ENSO leading by 4-5 months, the correct causal direction.
If you attempt to relate AMO to global temperatures, there is a tendency to actually be subtracting the signal from itself, which leads to some very unrealistic estimates of climate sensitivity.
---
The PDO may have some influence on global temperatures, but quite frankly we (a) don't have a huge amount of data, and (b) the duration and strength of observed PDO changes don't scale to the rapid and large temperature changes of the last 150 years. I suspect (IMO) that the PDO is at most a minor influence.


Comments