


 Arguments


Climate Sensitivity Single Study Syndrome
Posted on 28 January 2013 by dana1981
A press release from a Norwegian project attempting to estimate the Earth's climate sensitivity (generally measured as how much the planet's surface will warm in response to the energy imbalance caused by the increased greenhouse effect from a doubling of atmospheric CO2) has drawn quite a bit of attention in the media as suggesting that global warming may be "less extreme than feared." Carbon Brief has confirmed that the press release discusses several projects from a Norwegian group, including focusing on a not-yet-published (and not yet accepted by a scientific journal) follow-up paper to Aldrin et al. (2012). Andrew Revkin has further details.
Regardless, there is a large body of scientific research investigating the question of the Earth's climate sensitivity. Perhaps the most comprehensive review of this research is Knutti and Hegerl (2008), which found that the various methodologies used to estimate climate sensitivity are generally consistent with the range of 2–4.5°C (Figure 1).

Figure 1: Distributions and ranges for climate sensitivity from different lines of evidence. The circle indicates the most likely value. The thin colored bars indicate very likely value (more than 90% probability). The thicker colored bars indicate likely values (more than 66% probability). Dashed lines indicate no robust constraint on an upper bound. The IPCC likely range (2 to 4.5°C) is indicated by the vertical light blue bar. Adapted from Knutti and Hegerl (2008).
Note the wide range of timeframes, data, and methods used in the climate sensitivity studies included in the Knutti and Hegerl review, all of which are broadly consistent with the 2–4.5°C IPCC likely equilibrium sensitivity range. No single study is going to overturn this consensus of evidence, nor are the Norwegian project's results necessarily inconsistent with the IPCC range. There is also a question as to exactly what is being estimated – equilibrium sensitivity once the planet reaches a new energy balance (over several decades to centuries), or a more immediate 'transient' climate response. Regardless, our global warming concerns should not be assuaged by any single study.
Equilibrium Climate Sensitivity vs. Transient Climate Response
A brief presentation of the Norwegian project is available online, and shows that the researchers attempt to calculate the equilibrium climate sensitivity (the total amount of warming when the planet reaches a new energy equilibrium), via the effective climate sensitivity. This is because the global climate is currently far out of equilibrium due to the energy imbalance caused by the increased greenhouse effect, so it is not possible to calculate the equilibrium sensitivity based on current data. The IPCC describes effective climate sensitivity as follows.
"The effective climate sensitivity is a measure of the strength of the feedbacks at a particular time and it may vary with forcing history and climate state."
and
"with units and magnitudes directly comparable to the equilibrium sensitivity. The effective sensitivity becomes the equilibrium sensitivity under equilibrium conditions with 2xCO2 forcing."
The effective climate senstivity is measured using snapshots of the climate. As the Norwegian presentation notes, once the planet reaches energy equilibrium, the effective sensitivity becomes the same as the equilibrium sensitivity. The two are also the same if climate feedbacks do not change over time – the question remains whether that is true in the real world. This type of approach may be more strongly related to the "transient climate response" (TCR).
The TCR is basically how much the planet will immediately warm once we reach the level of doubled CO2. The IPCC puts the TCR very likely above 1°C and below 3°C, with a most likely immediate warming of about 2°C in response to doubled CO2. Thus we expect roughly two-thirds of equilibrium warming to occur immediately, but the rest of the eventual warming will occur over several decades to centuries (Figure 2).
Figure 2: Global mean temperature change for 1%/yr CO2 increase with subsequent stabilisation at 2xCO2 and 4xCO2. The red curves are from a coupled AOGCM simulation (GFDL_R15_a) while the green curves are from a simple illustrative model with no exchange of energy with the deep ocean. The transient climate response, TCR, is the temperature change at the time of CO2 doubling and the equilibrium climate sensitivity, T2x, is the temperature change after the system has reached a new equilibrium for doubled CO2, i.e., after the additional warming commitment has been realised. From the 2001 IPCC report.
The effective climate sensitivity calculation is an attempt to bridge the gap between the transient and equilibrium climate responses — in an ideal world equilibrium and effective climate sensitivity are the same. However, the bigger the global energy imbalance, the more difficult it is to bridge that gap, because the immediate transient response becomes less representative of the ultimate equilbrium response. With a larger change, short-term feedbacks can become less representative of long-term climate feedbacks.
Another problem can arise if the models overfit short-term noise (natural variability), and there are also significant uncertainties in the overall global energy imbalance and measurements of changes in global heat content, both of which are components of these sensitivity calculations. Knutti and Hegerl (2008) briefly addresses some of these issues.
"Because few coupled models have been run to equilibrium and the validity of these concepts for high forcings is not well established, care should be taken in extrapolating observationally constrained effective sensitivities or slab model sensitivities to long-term projections for CO2 levels beyond doubling, because feedbacks should be quite different in a substantially warmer climate."
These are a challenges for any study trying to evaluate the equilibrium climate sensitivity based on recent climate data, like this Norwegian study.
The Norwegian Study
There is also a significant red flag in the press release for this study:
"When the researchers at CICERO and the Norwegian Computing Center applied their model and statistics to analyse temperature readings from the air and ocean for the period ending in 2000, they found that climate sensitivity to a doubling of atmospheric CO2 concentration will most likely be 3.7°C, which is somewhat higher than the IPCC prognosis.
But the researchers were surprised when they entered temperatures and other data from the decade 2000-2010 into the model; climate sensitivity was greatly reduced to a “mere” 1.9°C."
Including an extra decade's worth of data into the model should not halve their equilibrium climate sensitivity value, because the equilibrium sensitivity of the climate system is a relatively constant number, and in reality has not changed radically over the past decade. This suggests that their model may be overfitting the short-term natural variability.
What changed over the past decade? Probably the largest single effect is that the 1990s were dominated by El Niño events (which cause short-term surface warming) while the 2000s have been domated by La Niña events (which cause short-term surface cooling). Thus ending their analysis around the year 2000 may have biased their result high, whereas ending the analysis in 2010 could have biased it low.
Another issue is that the study only includes ocean heat content (OHC) data down to a depth of 700 meters. Over the past few years, heat accumulation in the upper 700 meters has slowed slightly, but it has been offset by faster heat accumulation between 700 and 2000 meters (according to NOAA data, illustrated in Nuccitelli et al. 2012). But the heat in that slightly deeper layer will not remain there forever; failing to include it may underestimate the equilibrium warming.
This depends on what timescale the heat exchange between the moderate ocean depths and the surface interact, as illustrated in this graphic showing what's included in measurements of climate sensitivity over different timescales.
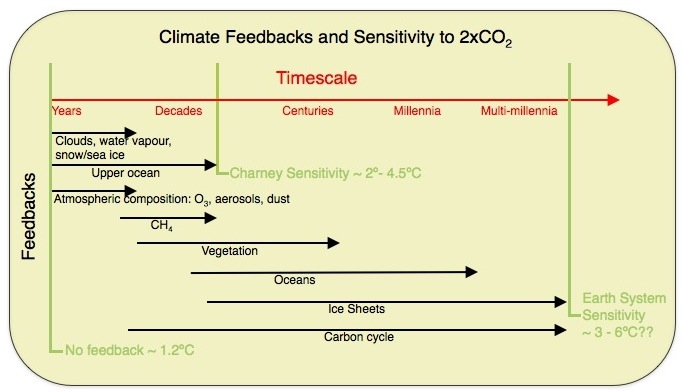
Figure 3: Climate feedbacks and timescales included in various sensitivity estimates, via Gavin Schmidt at RealClimate
The difficulty is that OHC data extending to 2000 meters are fairly sparse — the NOAA measurements are basically the only game in town, and only provide pendatal (five-year running average) data. Nevertheless, neglecting the heat accumulation at these moderate ocean depths could very well lead to a climate sensitivity underestimate.
Reto Knutti has also discussed some of the caveats he sees in general studies of this type in an interview with Andrew Revkin, as well as providing very helpful insight for this blog post.
An Important Aldrin Caveat
One important point regarding the results of Aldrin et al. (2012) is that their main, highly-touted result (climate sensitivity around 2°C) does not include indirect aerosol or cloud effects in their global energy imbalance estimate,
"Therefore, the estimate of [climate sensitivity] presented here is likely to be underestimated because the net forcing of the other indirect effects are likely to be negative."
Aerosols and clouds are two of the least well-constrained contributors to the global energy imbalance, and thus two of the largest sources of uncertainty in climate sensitivity estimates. When excluding indirect aerosol effects, Aldrin et al. find a sensitivity of 1.2–3.5°C (mean 2.0°C), which increases to 1.2–4.8°C (mean 2.5°C) when including a small indirect aerosol effect. The number goes even higher when including an estimate for cloud effects.
"Including cloud lifetime effect increases the posterior mean of the climate sensitivity...to a value of about 3.3°C and the uncertainty increases as well"
The Big Sensitivity Picture
Note that the climate sensitivity estimates in Figure 1 based on the instrumental temperature record (the past 100–150 years; in red) tend to fall toward the lower end of the IPCC range, which may be a result of effective sensitivity estimates not fully bridging the gap between transient and equilibrium climate responses, perhaps for some of the reasons discussed here (difficulty accounting for short-term natural variability, moderate-depth ocean heat accumulation, short-term feedbacks not necessarily representative of long-term feedbacks, etc.).
However, no climate sensitivity estimate is perfect. For example, future conditions (a hot world) will be quite different from conditions during the Last Glacial Maximum (a cold world), and thus different feedbacks may apply in the future than in some of the past analogues used for comparison.
It's also important to always consider the full body of climate sensitivity research. Anybody can cherrypick a few studies to suggest climate sensitivity is on the low end or on the high end by failing to consider the full body of evidence. To that end, Gavin Schmidt has also provided a helpful summary of some more recent sensitivity research at RealClimate.
We need to be careful not to fall into the trap of thinking that any single study will overturn a vast body of scientific evidence, derived from many different sources of data (or as Revkin calls this, single-study syndrome). Regardless, the Norwegian study does not appear to conflict with the IPCC climate sensitivity range.
Ultimately all we can say with confidence is still that equilibrium climate sensitivity likely falls somewhere within the IPCC 2 to 4.5°C sensitivity range.


(OffTopic) David B Benson got it correct here. :-)