


 Arguments


Past and Future CO2
Posted on 1 May 2014 by Guest Author
This is a guest post by Gavin Foster, Dana Royer and Dan Lunt.
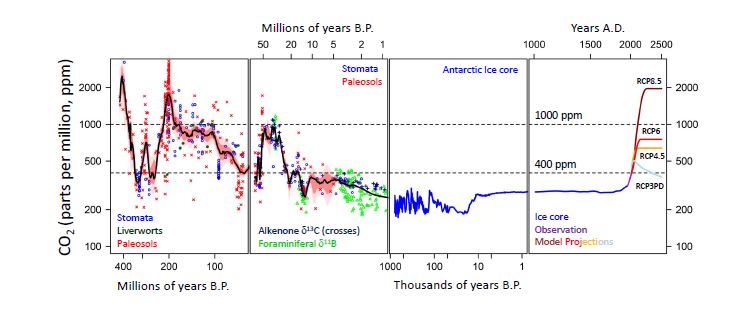
Figure 1: Compilation of available CO2 data for the last 450 million years. For data sources see text. Proxy records are colour coded and labelled in the relevant panel. Greenhouse gas emission scenarios (RCP – Representative Concentration Pathways) used in IPCC AR5 are shown in the right hand panel. Note the variable log scale for time. For the geological data a smoothed line has been fit to the data with an uncertainty accounting for uncertainty in age and CO2. The black line describes the most probable long-term CO2 with 68% confidence limits in red, and 95% confidence in pink.
Carbon dioxide (CO2) in the Earth’s atmosphere is a potent greenhouse gas, responsible for trapping longwave radiation and ensuring the habitability of our planet. Variations in its concentration are thought to be important for controlling the evolution of the Earth’s climate on geological timescales (hundreds of thousands to millions of years) and recent anthropogenic increases in atmospheric CO2 have played a major role in more recent global warming. Read more here.
Reconstructing atmospheric CO2 in the past is a tricky business. For the last 800 thousand years we have bubbles of ancient atmosphere trapped in ice that can be recovered from Antarctica. Prior to this time we have to rely on more indirect methods also known as proxies. Those available to us are discussed in detail in the latest IPCC report, and in particular in Table 5.A.2 in Chapter 5 “Information from Paleoclimate Archives” and more briefly here.
In Figure 1, we have plotted all the available pre-ice core CO2 reconstructions for the last 423 million years (a total of nearly 800 data points) and compared them to more recent records and projections for the future. The palaeo-CO2 data can be found here, the ice core data here & here, historical data here and the projections of CO2 for the future here.
For the ancient CO2 data there is an increased variability due to the existence of both real short term variability (e.g. orbitally driven change like the well-known glacial-interglacial cycles) and increased noise due to the uncertainty in CO2 reconstructed by these more indirect methods. To account for this and to better reveal the long-term trends in the CO2 data we have fitted a smoothed curve, which has an uncertainty due to the uncertainty on the age and CO2 of each data point. This smoothed curve can be found here (Phanerozoic-CO2). This treatment reveals a number of interesting features:
- Despite considerable variability, there has been a gradual long term decline in CO2 over the last 450 million years or so. On average this is around 13 ppm (parts per million) per million years
- Values similar to today (398.03 ppm for Feb 2014) were last seen during short intervals in the Pliocene some 3 to 5 million years ago, but the last time long-term mean CO2 was at this level was in the middle Miocene climatic optimum (~16 million years ago; see this blog piece by Paul Pearson for more discussion).
- For much of the rest of the last 450 million years or so Earth generally had higher CO2 than today (with the exception of the Carboniferous-Permian ~300 million years ago where CO2 was once again similar to today).
- Business as usual emission scenarios (RCP8.5 on the figures) indicate atmospheric CO2 will reach around 1000 ppm by around 2110 AD (less than 100 years’ time). The last time CO2 was this high was during the early Eocene Climatic Optimum (EECO)– the warmest time period of the last 50 million years. The planet was so warm during the period that it was completely ice free (sea-level +65 m or so relative to today) and the latest compilations put global temperatures +13 ± 2.6°C warmer than today (Cabellero and Huber, 2013). It is important to note though that around 5 oC of this warming was due to changes in continental configuration, vegetation and the loss of the continental ice sheets.
- Business as usual emission scenarios (RCP8.5) indicate atmospheric CO2 will reach around 2000 ppm by around 2250 AD. The last time long-term CO2 was at this level was 200 million years ago at the Triassic-Jurassic boundary when CO2 was elevated by the massive outpourings of lava (covering an area of 11 million km2) as the supercontinent Pangaea broke apart and the Southern Atlantic opened for the first time, Read more here.
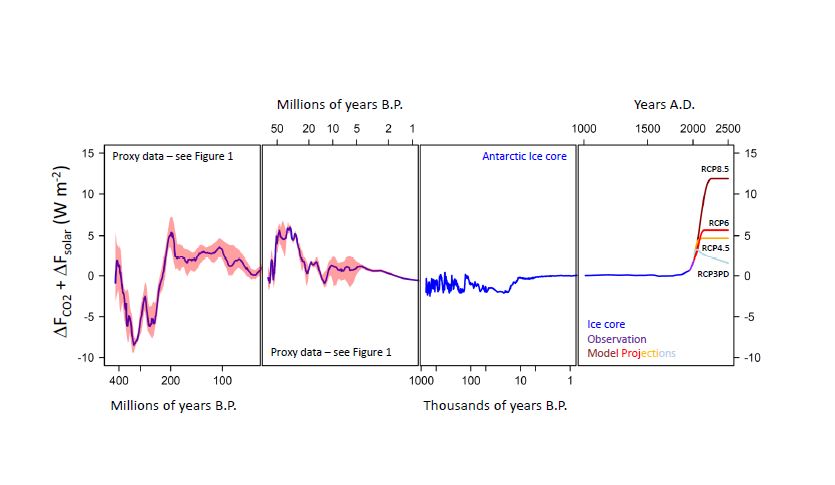
Figure 2: Climate forcing by changing CO2 and solar output for the last 450 million years. CO2 data and projections are as outlined in Figure 1. Changing solar output calculated as described in Gough et al. (1981; Solar Physics, 74, 21-34) with CO2 forcing from Byrne and Goldblatt (2014; doi: 10.1002/2013GL058456). The red band is the 95% confidence interval around the smoothed line through the published CO2 data.
However, the evolution of climate over this time period is not only being forced by changing CO2. As well as tectonics changing the position of the continents, and changes in vegetation and ice changing Earth’s albedo (its reflectiveness) through time (http://www.scotese.com/), models of stellar evolution predict that the output of our Sun has increased over its life time. On relatively short geological timescales (e.g. the last 5 million years or so) this effect is not significant. But over 400 million years the output of the sun has increased by around 4% (equivalent to ~12 W m-2 of climate forcing). We calculated the climate forcing by CO2 (in W m-2) and the Sun for the last 400 million years (using doi: 10.1002/2013GL058456; see Figure 2).
What is revealed is that despite a dramatic change in solar output, the combined climate forcing by CO2 and the Sun has remained relatively constant (Figure 2). This has been commented on before (here) and is likely due to the operation of a strong negative feedback process changing CO2 levels on geological timescales as a function of global temperature (silicate weathering – more here). However we see that with the latest treatment of the proxy data forcing has remained even more tightly constrained (within ± 5 W m-2) over the last 400 million years (Figure 2). Given this longer term view of climate forcing, the scenarios for future fossil fuel use stand out as being even more extreme, and the business as usual scenario (RCP8.5) would amount to a climate forcing by CO2 that is largely unprecedented in the geological record (as far as we can tell).
Members of the Descent into the Icehouse project are working to improve our estimates of CO2 during the EECO. It is important to note that winding the clock back to EECO CO2 levels in the coming century will not result in a simple return to the Eocene climate. Understanding what drove the evolution of the Eocene climate however will aid our wider understanding of the Earth’s climate system and how it behaves in warm climate states.
See here for more information on the Descent into the Icehouse Project


Thanks for this. I have been arguing on othe sites with people who are certain that we can know for certain what is coming simply by looking at past era's when CO2 concentrations were at whatever level we think they will be in the future. Your last two paragraphs, in particular, put the lie to such notions. We are indeed headed into new climate territory, not only for reasons you so clearly lay out, but also because of the extreme speed as which we seem to be getting there.
This is great. I was looking for exactly these graphs for my class notes a coulpe weeks ago. How should I best reference this?
(Rob P) - See the link in the greenbox at the bottom of the post which takes you to the Descent into the Icehouse Project. This post is a re-post of an article of the same title which appears there.
I've let Dr Gavin Foster know that the post is up, so he may turn up to answer questions. I can't guarantee that however, as the e-mail was only sent moments ago and he might not necessarily be available.
If there are ~800 data points in 423,000,000 yrs then it doesn't indicate the maximum and minimum CO2 and temperatures on, say, century averages. As a concrete example, I recall vaguely a public talk by Dr. Hansen and others that forcing latest deglaciation was ~7 w/m**2 to give +5 Celsuis. Can somebody inform how we know that CO2 and temperature on a rolling 100 year (human-size) average did not vary considerably more than the 5,000x coarser time sampling described and depicted ?
grindupBaker @ 3... I don't think the graph suggests century scale resolution prior to the glacial data. But you might also assume that the past 800k years are some evidence of a model for past conditions.
I'm sure there's much more to it than that, but that would be my initial reaction.
This post brings up a question I've always wondered about.
Given that CO2 has operated as a thermostat over the past few billion years, and can be seen doing this as solar output has increased over the ~400my, if you were to set aside human emissions of CO2 for a moment, what would happen naturally over the next 500my?
As solar irradiance grows, and CO2 level fall to compensate, doesn't that suggest there would be a point where the biosphere is no sustainable? Would you get to a point where life would become CO2 starved? And then following that, wouldn't there be a point in time when surface temps have to rise (on geologic scales) because the planet has exceeded the capacity for CO2 to regulate the climate system?
That figure 2 (Climate forcing - CO2 and solar) is a jaw dropper. It shows that even if we stablise at +6W/m^2 (aka pathway RCP6) then we can eventually expect a return to the early Eocene Climatic Optimum (EECO) of 50 million years ago – which is described above as:
"The planet was so warm during the period that it was completely ice free (sea-level +65 m or so relative to today) and the latest compilations put global temperatures +13 ± 2.6°C warmer than today (Cabellero and Huber, 2013)."
Has anyone got a handle on how long it would take to reach that equilibrium?
Rob H
That is my understanding. The figures I have read suggest life on Earth has around 500 million years left to go. At that point the CO2 weathering thermostat will drive CO2 levels down to the point where plants will be unable to photosynthesis at all. When plant life (particularly cyano-bacteria) go extinct most animal life will follow. Bacteria will remain for some time.
With life removed that part of the carbon cycle is removed. Oxygen in the atmosphere declines rapidly allowing other GH gases such as Methane that would otherwise be oxidised to accumulate so more GH effect. And probably less draw down of CO2. The rate of tectonic movement may slow since it is thought that life contributes to reducing the grain size in soils below that which geological processes alone can achieve, thus increasing the lubrication soils and sediments provide as the plates slide over each other. So the weathering pump may see its final stage - deep sequestration via subduction reduced. So CO2 will likely build up further. Water vapour will keep adding its bit. Eventually the last life on Earth will be extremophile bacteria.
However, assuming we can survive the next few centuries there is no reason humanity can't find a way around this. Just take a bit of Solar System Engineering. Regular controlled flyby's by a good sized asteroid every century or so should allow us to slowly nudge Earth's orbit outwards to compensate. Of course we will need to adjust the orbits of the other planets as well to maintain stability. But with lots of time we can surely do all of that
Any clues about what the 'hump' between 20 & 50 Myr is caused by - that is way more than just the PETM.
"The palaeo-CO2 data can be found here"
'here' doesn't have a link.
(Rob P) - My bad. I can't edit the post now, but try this
Glenn@8,
Your "hump" is portrayed innacurately on fig 1.If you look at the more detailed Cenozoic reconstructions, e.g. here:
you fin. The rise in the early C until ~50ma was due to increased CO2 degassing by indian plate tectonics (India was running like crazy from antarctica through entire ocean at 8inches/y. The fall after ~50ma was due to India smashing into Tibet and rise of Himalaya and increased weathering.
Thanks chriskoz
I had thought of the increased weathering due to the formation of thr Himalayas but had not twigged to the increased outgassing due to subduction. That makes a lot of sense.
What is also striking in Fig 1 is just how wide the confidence intervals aren't!
That CO2 Weathering thermostat surely is a really useful thing to have around. Real neat if you like having a planet with life on it.
Attached is a list of replies to some of the above questions by Dr Foster.
Thanks all for your comments on our contribution. I will try here to answer a few of your questions here.
#2. Stephen Baines – How should I best reference this?
We are writing this up for a publication but as with most academics I have a lot of competition for my time (i.e. teaching vs. research) and this will have to wait till the summer. In the meantime just reference the descent into the icehouse website where this originally appeared (www.descentintotheicehouse.org.uk).
#3. gindupBaker – asked about the resolution of the records. Certainly short intervals could exhibit more variability than is shown in the plots. Mostly though we are reconstructing averages of relatively long periods of time with the techniques used – e.g. thousands of years. The 7 W/m2 you are referring to includes the forcing from changes in albedo related to the waxing and waning of the ice sheets. The CO2 (and solar forcing) we calculate here is entirely consistent with Hansen’s calculations.
#5. Rob Honeycutt – This is a really interesting observation and something I had also thought about. Glenn Tamblyn’s comment #7 I hope answers your question though.
#6. macoles – has anyone got a handle on how long it would take to reach that equilibrium?
The slowest parts of the climate system are the continental ice sheets. These respond very slowly to forcing and will take something like 1000 years to reach equilibrium (though no one can put an exact figure on this), more if we are looking at melting all the continental ice on the planet, but that sort of order. This implies of course that if even if we stop CO2 emissions tomorrow, we are in for a long period of climate change as the Earth system readjusts to the new forcing. There was a Skeptical Science post about some of our other work that relates to this that you may be interested in (https://www.skepticalscience.com/Carbon-Dioxide-the-Dominant-Control-on-Global-Temperature-and-Sea-Level-Over-the-Last-40-Million-Years.html)
#10. Chriskov – your “hump” is portrayed inaccurately on fig.1. if you look at the more detailed Cenozoic reconstruction e.g. here.
Chriskov you have to be careful with what you accept as a reconstruction of CO2 here. What we plotted and compiled are the latest published proxy estimates of CO2 based on several tried and test techniques (albeit each with its own particular group of weaknesses and limitations). What you have plotted is a simple transformation of the benthic foraminiferal oxygen isotope compilation of Jim Zachos (performed by Jim Hansen). Benthic foram d18O is a proxy of deep water temperature AND ice volume but NOT CO2. It is therefore very dangerous to use this to calculate CO2 as you are directly linking cause (CO2 change) with effect (ice volume and deep sea temperature change). Furthermore, the relationship between global temperature and deep sea temperature is not straightforward, nor is the way in which you deconvolve d18O into a temperature and ice volume record. For instance, to make the plot you show one has to firstly remove the ice component of the d18O (which is difficult without a 65 million year record of sea-level), then assume a constant relationship between deep sea temperature and global temperature, and then assume a climate sensitivity to radiative forcing (and assume it’s only CO2 change that is doing the forcing). This approach has its uses but our research is focused on using the geological past to try to independently estimate parameters like climate sensitivity from the geological record (e.g. see http://www.nature.com/nature/journal/v491/n7426/full/nature11574.html). For this you obviously need independent estimates of CO2 and climate change.
The record aside, the reason for elevated CO2 in the Early Cenozoic (which is evident in our record but maybe obscured partially by the log-scale) is, as Chriskoz notes, most likely due to enhanced outgassing as the Tethys ocean was subducted below the Asian continent (that culminated with the Indian-Asian continent collision).
#12. Glenn Tamblyn – That CO2 weathering thermostat surely is a really useful thing to have around…
We couldn’t agree more. Though of course, as with all things in science, it’s not necessarily a done deal that silicate weathering is responsible. Lots more work to be done!
The Foster et al paper is now available at:
http://www.nature.com/articles/ncomms14845