Climate Science Glossary

Term Lookup

Enter a term in the search box to find its definition.

Settings

Use the controls in the far right panel to increase or decrease the number of terms automatically displayed (or to completely turn that feature off).

Term Lookup

Settings


All IPCC definitions taken from Climate Change 2007: The Physical Science Basis. Working Group I Contribution to the Fourth Assessment Report of the Intergovernmental Panel on Climate Change, Annex I, Glossary, pp. 941-954. Cambridge University Press.

Home Arguments Software Resources Comments The Consensus Project Translations About Support

Twitter Facebook YouTube Mastodon MeWe

RSS Posts RSS Comments Email Subscribe


Climate's changed before
It's the sun
It's not bad
There is no consensus
It's cooling
Models are unreliable
Temp record is unreliable
Animals and plants can adapt
It hasn't warmed since 1998
Antarctica is gaining ice
View All Arguments...


Username
Password
New? Register here
Forgot your password?

Latest Posts

Archives

Assessing global surface temperature reconstructions

Posted on 24 July 2010 by Ned

Guest post by Ned

There are three prominent reconstructions of monthly global mean surface temperature (GMST) from instrumental data (fig. 1):  NASA's GISTEMP analysis, the CRUTEM analysis (from the University of East Anglia's Climatic Research Unit), and an analysis by NOAA's National Climatic Data Center (NCDC).  

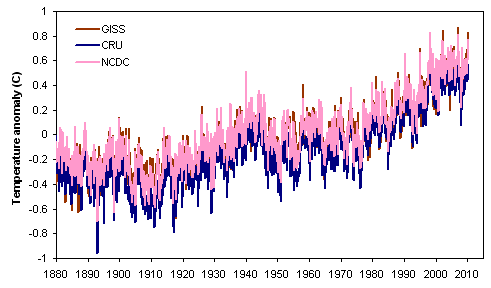
Figure 1.  Comparison of global (land & ocean) mean surface temperature reconstructions from NASA GISS, the University of East Anglia's CRU, and NOAA NCDC.


How reliable are these temperature reconstructions? Various questions have been raised about both the data and the methods used to produce them.  Now, thanks to the hard work of many people, we can conclude that the three global temperature analyses are reasonable, and the true surface temperature trend is unlikely to be substantially different from the picture drawn by NASA, CRU, and NOAA.

The three GMST analyses have much in common, though there are significant differences among them as well.  All three have at their core the monthly temperature data from the Global Historical Climatology Network (GHCN), and all three produce both a land-stations-only reconstruction and a combined land/ocean reconstruction that includes sea surface temperature measurements.

Let's explore the reliability of these reconstructions, from several different angles.


The data and software used to produce these reconstructions are publicly available

Source code and data to recreate GISTEMP and CRUTEM are available from NASA and CRU websites.  (The data set provided by CRU excludes a fraction of the data that were obtained from third parties, but the results are not substantially affected by this).

The software has been successfully tested outside of NASA and CRU, and it works as advertised

Both GISTEMP and CRUTEM have been successfully implemented by independent investigators. For example, Ron Broberg has run both the CRUTEM and GISTEMP code.  In addition, the Clear Climate Code project has duplicated GISTEMP in Python.   Figure 2 shows a comparison of the output of the GISTEMP reconstruction process as implemented by NASA and by Clear Climate Code ... but since the results are identical, the second line falls exactly on top of the first.

Comparison of GISTEMP and CCC

Figure 2.  The GISTEMP land/ocean temperature analysis as implemented by NASA and by Clear Climate Code.   Results of the two analyses are effectively identical.


Similar results can be obtained using different software and methods

Over the past year, there has been quite a flurry of "do-it-yourself" temperature reconstructions by independent analysts, using either land-only or combined land-ocean data.  In addition to the previously-mentioned work by Ron Broberg and Clear Climate Code, these include the following:

(There are probably others as well that we're omitting!)

Most recently, the Muir Russell investigation in the UK was able to write their own software for global temperature analysis in a couple of days.


For all of these cases, the results are generally quite close to the "official" results from NASA GISS, CRU, and NOAA NCDC. Figure 3 shows a collection of seven land-only reconstructions, and Figure 4 shows five global (land-ocean) reconstructions.


Figure 3.  Comparison of land-only reconstructions, 1900-2009.  Note that the NASA GISS reconstruction using only land stations is not shown here, because it is conceptually different from the other analyses.


Figure 4.  Comparison of land-ocean reconstructions, 1900-2009.

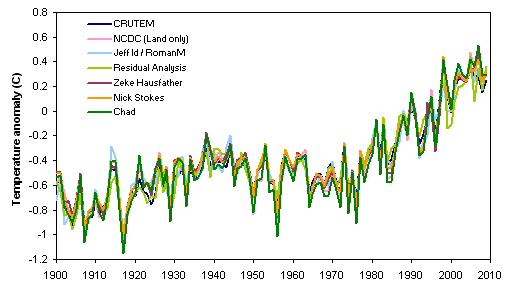
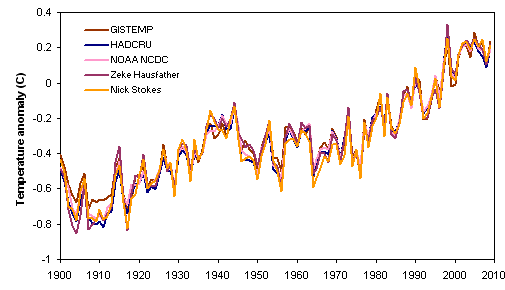
Obviously, the results of the reconstructions are quite similar, whether they're by the "Big Three" or by independent analysts.


The temperature increase is not an artifact of the GHCN adjustment process

Most of the analyses shown above actually use the raw (unadjusted) GHCN data.  Zeke Hausfather has done comparisons using both the adjusted and raw versions of the GHCN data set, and as shown in fig. 5, the results are not substantially different at the global scale (though 2008 is a bit of an outlier).

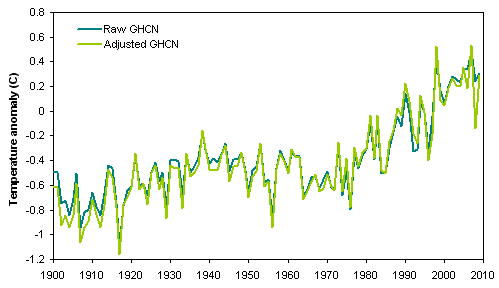
Figure 5.  Comparison of global temperatures from raw and adjusted GHCN data, 1900-2009 (analysis by Zeke Hausfather).


The temperature increase is not an artifact of declining numbers of stations

While it is true that the number of stations in GHCN has decreased since the early 1990s, that has no real effect on the results of spatially weighted global temperature reconstructions.  How do we know this?

* Comparisons of trends for stations that dropped out versus stations that persisted post-1990 show no difference in the two populations prior to the dropouts (see, e.g., here and here and here).

* The spatial weighting processes (e.g., gridding) used in these analyses makes them robust to the loss of stations.  In fact, Nick Stokes has shown that it's possible to derive a global temperature reconstruction using just 61 stations worldwide (in this case, all the stations from GISTEMP that are classified as rural, have at least 90 years of data, and have data in 2010).

* Other data sets that don't suffer from GHCN's decline in station numbers show the same temperature increase (see below).

 One prominent claim (by Joe D'Aleo and Anthony Watts) was that the loss of "cool" stations (at high altitudes, high latitudes, and rural areas) created a warming bias in the temperature trends.  But Ron Broberg conclusively disproved this, by comparing trends after removing the categories of stations in question.  D'Aleo and Watts are simply wrong.


The temperature increase is not an artifact of stations being located at airports

This might seem like an odd statement, but some people have suggested that the tendency for weather stations to be located at airports has artificially inflated the temperature trend.  Fortunately, there is not much difference in the temperature trend between airport and non-airport stations.


The temperature increase is present in other data sets, not just GHCN

All of the above studies rely (mostly or entirely) on monthly station data from the GHCN database.  But it turns out that other, independent data sets give very similar results.


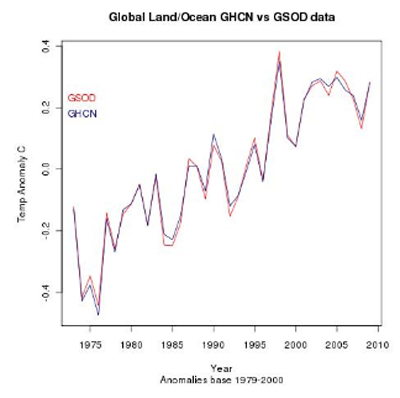
Figure 6.  Comparison of global temperatures from the Global Historical Climatology Network (GHCN) and Global Summary of the Day (GSOD) databases. (Analysis by Ron Broberg and Nick Stokes).

What about satellite measurements of temperatures in the lower troposphere?  There are two widely cited analyses of temperature trends from the MSU sensor on NOAA's polar orbiting earth observation satellites, one from Remote Sensing Systems (RSS) and one from the University of Alabama-Huntsville (UAH).  These data only go back to 1979, but they do provide a good comparison to the surface temperature data over the past three decades.  Figure 7 shows a comparison of land, ocean, and global temperature data from the surface reconstructions (averaging the multiple analyses shown in figs. 3 and 4) and from satellites (averaging the results from RSS and UAH):


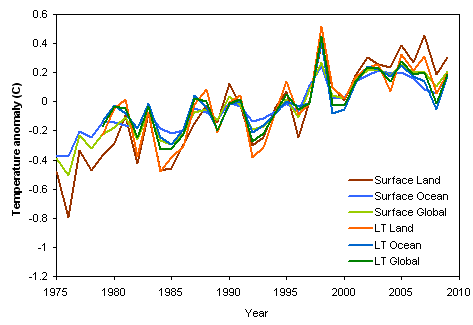
Figure 7.  Comparison of temperatures from surface stations and satellite monitoring of the lower troposphere.

We'll end by looking at all the surface and satellite-based temperature trends over the entire period for which both are available (1979-present).  What are the trends in the various data sets and regions?  As shown in fig. 8, the surface temperature trends over land have a fair amount of variability, but all lie between +0.2 and +0.3 C/decade.  Surface trends that include the oceans are more uniform. 


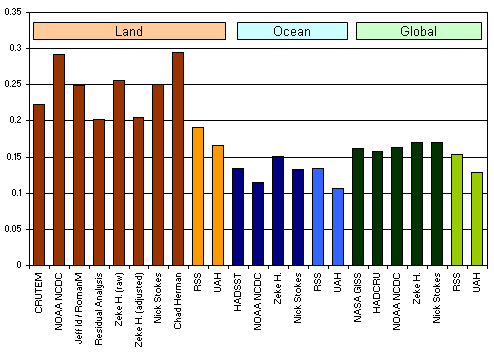
Figure 8.  Comparison of temperature trends, in degrees C per decade.

Overall, the satellite measurements show lower trends than surface measurements.   This is a bit of a puzzle, because climate models suggest that overall the lower troposphere should be warming about 1.2X faster than the surface (though over land there should be little difference, or the surface should be warming faster).  Thus, there are at least three possibilities:  

  • The surface temperature trends show slightly too much warming.
  • The satellite temperature trends show slightly too little warming.
  • The prediction of climate models (about amplified warming in the lower troposphere) is incorrect, or there are complicating factors that are being missed. 

It should be noted that in the past the discrepancy between surface and satellite temperature trends was much larger.  Correcting various errors in the processing of the satellite data has brought them into much closer agreement with the surface data. 

Conclusions

The well-known and widely-cited reconstructions of global temperature, produced by NASA GISS, UEA CRU, and NOAA NCDC, are replicable

Independent studies using different software, different methods, and different data sets yield very similar results.  

The increase in temperatures since 1975 is a consistent feature of all reconstructions.  This increase cannot be explained as an artifact of the adjustment process, the decrease in station numbers, or other non-climatological factors. 

In contrast to normal practice here at Skeptical Science, for this post we have emphasized the "near-real-time" results of studies undertaken by individuals (in some cases non-specialists and highly talented amateurs) as published on blogs, rather than the work of professional scientists published in the peer reviewed literature. Since many of the "controversies" about the reliability of surface temperature trends first arose in the blogosphere, it is perhaps appropriate that those controversies are now being carefully and thoughtfully resolved in the same environment.


Sources

 Acknowledgments

We would like to thank the scientists of GISS, CRU, and NCDC for their work and their patience.  We would also like to thank the individual authors of the "independent" temperature analyses featured here, particularly Zeke Hausfather who compiled the results of multiple different reconstructions, and Lucia L. who provides space for Zeke's work on her blog.

0 0

Printable Version  |  Link to this page

Comments

1  2  Next

Comments 1 to 50 out of 73:

  1. Ned This is very impressive work. I have been reading this site for some months now and am most impressed with the quality and the quantity of dedicated and talented work that is submitted. Congratulations and keep it coming. Bob
    0 0
  2. Ned - fantastic compilation. Thank you.
    0 0
  3. Another temperature reconstruction I've been wanting to get my hands on is by the European Centre for Medium-Range Weather Forecasts (ECMWF). They're the ones who published a paper analysing the HadCRUT data and concluding their recent warming trend was slightly low due to not including the Arctic region where warming was pronounced (blogged about here). I'm told their temperature data is somewhere on their website but haven't tracked it down yet (admittedly I hadn't looked that hard). Anyone else found it, plotted it?
    0 0
  4. Could the ECMWF data be here?
    0 0
    Response: That page still doesn't make it easy - what's the path from that URL to global surface temperature?
  5. Japan Meteorological Agency seems to have there own set of data. They use the "Kobe collection" (Ishii et al. 2004) for SST; for land temperatures, NCDC data is used till 2000, and CLIMAT messages are used from then on. Their data uses 1971 ~ 2000 as their baseline. Kooji Ishihara 2005 ~ COBE-SST を用いた全球平均気温の算出
    0 0
  6. Nicely done, Ned: Confidence in these temperatures can now be at an all time high! It is nice to see this kind of consistency. Take just about any of these graphs and fit a line from 1970 or so to today: you see a global temperature increase at a rate of 0.4-0.6 deg in less than 30-40 years. I can't wait to hear the "No, its not" chorus come chiming in.
    0 0
  7. "It is nasty to see this kind of conspiracy" Is what some so-called 'sceptics' might see in muoncounter's post. Anyway... I had a solid idea that the temp reconstructions were robust anyway given their agreement and consistency, and events over the last year have only reinforced this. But I was appalled by the behaviour of Watts and D'Aleo, claiming the dropouts enhanced warming. This was so amply proved false that it stopped being a sceptic talking point quite quickly, but I do occasionally remind people of it. As Ned says, D'Aleo and Watts are simply wrong.
    0 0
  8. http://www.ecmwf.int/products/forecasts/d/inspect/catalog/research/eraclim/timon/timon_ana_2D!TLT!anom!Globe!195701-201012!/ ? D.
    0 0
  9. Very nice post Ned, thanks...
    0 0
  10. There is also a third satellite temperature reconstruction that has substantially higher trend particularly in the tropics: http://www.star.nesdis.noaa.gov/smcd/emb/mscat/mscatmain.htm NOAA/nesdis do not provide TLT data but a discussion and comparison with other reconstruction is available in this paper: Zou et al 2009 ECMWF reanalysis data are available at knmi climate explorer: ecmwf reanalysis
    0 0
  11. Nice work Ned.
    0 0
  12. Did I miss something? It appears to me that the post is focussing on global land+ocean anomaly. But the dataset referenced "CRUTEM" is from land-station data only. For land+ocean, you need "HadCRU".
    0 0
  13. I've seen -some- of these examples cited in various places but never all together. This post ought to be be a mandatory checkpoint for sensible self-professed climate skeptics; going off the rails on a matter so unambiguously resolved will serve as a useful credibility diagnostic no skeptic will want to fail. One improvement I could think of would be to bring the external supporting material together under one roof so as to avoid "rot" of the links but I suppose there could be some permissions hurdles. Nice job, Ned.
    0 0
  14. 'Over the past year, there has been quite a flurry of "do-it-yourself" temperature reconstructions by independent analysts, using either land-only or combined land-ocean data.' The striking aspect of these reconstructions is not only their similarity to peer reviewed work but also the origin of some in sources associated with 'scepticism.' I checked out the Jeff Id reconstruction which was done by RomanM and posted on Lucia's Blackboard. Lucia is described as a 'lukewarmer' on WUWT and seems to strive for balance from what I've seen of her site. Jeff Id is strongly sceptical and very politicised in his perspectives (hence I stopped visiting his site - far too much partisan baggage). I think the notion that the world is not showing an overall warming trend in recent decades simply can't be taken seriously. WUWT has shifted the argument to suggesting that the 1930s showed similar temperatures to today but alleges that temperatures have been subsequently 'adjusted.' The latter claim would be worth dissecting. Interestingly, the Japanese data set posted by apeescape shows a 1940 warming though it's substantially less than that of the last 30 years. At any rate, the bottom line is that not even WUWT is claiming the absence of a current warming trend even while alluding to some recent 'weather' events which seem counterintuitive to the 'consensus' (sea ice, record cold in South America, etc). However, its readership's responses are much less nuanced with comments on the lines of 'It's freezing down here' or references to AGW being a proxy for 'world government,' 'socialism,' and the like. Sometimes, someone responds with a bit of serious science but this is rare. WUWT's readership is thus far less sophisticated than its bloggers. The readership seems to be more interested in entrenching preconceived notions. The bloggers however do give an airing to questions which ought to be at least asked (even if the eventual outcome may often be rejection of the hypothesis by the scientific community). The readership on pro-consensus sites is much more sophisticated. I do however feel perturbed at times by the undercurrent of anger of some posters which I feel divides the world into 'them' and 'us.' Some may simply be people who do not suffer fools gladly - well, I do understand that - I react similarly to the 'hired guns' in my own field though I couch my written responses in far more polite language. Others, however, may I fear be similarly not wanting to engage with the real complexities. The problem with disengaging from the complexities is that it actually hinders scientific advancement. The '100 scientists' post included a couple of responses suggesting that the dissenting 3 scientists played an important role. I might illustrate this with an example from my own field. When I was a medical student and trainee psychiatrist, the prevailing explanation of illnesses such as schizophrenia and major depression was the 'monoamine' hypothesis. Basically, psychotropic medications all shared common mechanisms in respectively blocking or potentiating the activity of monoamine neurotransmitters (chemical messengers) such as dopamine blockade (in schizophrenia) or serotonin and/or noradrenaline potentiation at synapses (junctions between nerve cells). Schizophrenia was seen as a consequence of excess dopamine activity while depression as a consequence of serotonin/ noradrenaline insufficiency. Animal models, some in vivo studies in patients, and post mortem studies of patients lent support to the hypothesis (ie, multiple converging lines of evidence existed) even though no direct evidence of synaptic monoamine dysfunction was ever demonstrated. There was no question that our drugs worked reasonably well (though often with limited effect) and as best as we could tell only worked only if they affected synaptic neurotransmitters in specific ways. However, while the impact on synaptic neurotransmitter activity was demonstrably immediate, symptoms usually did not recede until at least two to six weeks of starting on the drugs. At the time, some contrarians debunked the monoamine hypotheses of depression and schizophrenia precisely because of this problem (and a whole lot of other issues besides - eg, depictions of psychiatric illness as no more than a social construct). The profession saw them as eccentrics and indeed they included in their number some seriously eccentric people. Because of the stigma around psychiatric illness, a significant body of patients often ended up with less access to treatment. The views of the contrarians fed the antipsychiatry movement which has had and to some extent still has a lot of traction. Nevertheless, a great deal of further research ensued and we now think that depression and schizophrenia have far more complex though still poorly understood origins. Much of the research implicates intracellular mechanisms as well as changes in neuronal connectivity in key brain areas ensuing over periods going from weeks to months and much more in keeping with real life trajectories of treatment response. We're hoping that this research will result in more sophisticated therapies (ie, more effective therapies that address the causes of these illnesses with significantly lower side effect burdens for patients) though so far nothing is on the horizon. The evidence base around the AWG hypothesis is arguably more robust than the evidence base around the neurobiology of psychiatric illness. Parallels however exist. We have an extraordinary knowledge explosion in brain function but much of this knowledge has not yet been integrated into a coherent synthesis. Neuroscience like climate science depends on a multiplicity of disciplines encompassing inter alia physicists. We have a similar knowledge explosion in climate science. My impression is that we may have a better synthesis in climate science than we do in neuroscience. However, treating the work of outliers with outright contempt runs the significant risk of demotivating folk who actually do want to look more closely at pieces in the jigsaw that don't quite fit (like some of the questions around cloud cover, feedbacks, and the like). Some of the folk currently interested in these areas may well be barking up the wrong tree. Maybe the bits of the jigsaw fit better than they think. However, angry dismissals of their work with the implicit assumption of bad faith add to the problem and don't contribute to solutions.
    0 0
  15. GP Alldredge writes: Did I miss something? It appears to me that the post is focussing on global land+ocean anomaly. But the dataset referenced "CRUTEM" is from land-station data only. For land+ocean, you need "HadCRU". I used HADCRUT for the parts of the post that deal with land/ocean temperatures (figs 1 & 4) and CRUTEM for figure 3, which compares land-only temperatures. Figure 8 has both CRUTEM and HADCRUT in it (note the microscopic labels...). The original draft of this post had more detail on the reconstructions, including an explanation of CRUTEM vs HADCRUT, GISTEMP land-only vs land/ocean, etc. But it was getting absurdly long....
    0 0
  16. Thanks for the kind words and helpful suggestions, everyone. I had looked into the JMA data set (briefly) but wasn't able to find a numerical version of the data in an easy-to-use format. I admit I didn't invest a lot of time in it. They do post a version of the full data set but it's in a fairly complicated and cryptic format. It probably is worth looking into further, however, since as apescape points out it uses some different sources and thus would nicely complement the others. chriscanaris, thank you for your long and thoughtful comment. I always enjoy reading your ideas and opinions here. The first half of your comment I agree with completely. Not knowing anything about psychiatry I found the second half fascinating, though I'll have to remain agnostic on the extent to which it's an analogy for the "science process" issues in AGW.
    0 0
  17. One note -- Figure 6 shows the result of a great deal of work by Ron Broberg to develop a non-GHCN temperature data set based on the SYNOP/GSOD database of surface temperature reports. Nick Stokes used these data in his TempLS program. This is quite an interesting project, IMHO, and the comparison in figure 6 (from Nick's blog post) is rather impressive. I'd encourage interested readers to check out the posts about GSOD on Nick's and Ron's sites.
    0 0
  18. Yes Chris, good stuff. However I think your analogy breaks down - in the psychiatry case it sounds like the "skeptics" were right (partly right?) but for the wrong reasons. I don't think that counts. Other psychiatrists would have go there eventually for the right reasons. Also "implicit assumption of bad faith" - the problem is that while your psychiatrists may not have been acting in bad faith (though it sounds as if, like AGW deniers, they were acting from ideological beliefs) there is absolutely no doubt that many, perhaps 97 out of a 100 of the deniers are acting in bad faith. For reasons to do with ideology (a complex ideology) on the one hand and financial interest (one way or another) on the other hand. I think most of these ideologies break down in the face of deniaworld's massive attack on not just climate science but all science. The only analogy I think is close is the tobacco companies fight against restrictions ad regulations.
    0 0
  19. I think Steve Mosher has done a reconstruction.... dont see him on the list.
    0 0
  20. Chris, no work that is rigorous, well thought out and scientifically carried out receives contempt. The likes of Carter et al, Soon-Baliunas or G&T should reeive contempt. The bloggers at WUWT are not that sophisticated. See the Western snow pack thread, CO2 snow, etc... The bad faith mentioned by David above is also patent, I have seen it on a number of occurences, in which Watts trumpeted papers that did not support a "skeptic" position at all as if they actually did. WUWT is not a credible source of information.
    0 0
  21. The issue of urban heat island effect is still extremely important to consider in all this though lets remember... I have not seen many reconstructions at all that can effectively keep this effect at a minimum.
    0 0
  22. David @ 18: Thanks for your kind comments. You're probably right when you say that advances in my field would eventually have come for the right reasons. Still, I do do think the contrarians may have helped stimulate research by highlighting the flaws in the prevailing paradigm. In medicine, many advances occur with serendipity. Often, there's folks out there in underfunded labs beavering away at something highly specialised and obscure in the basic sciences. The relevance to clinical medicine may not be immediately apparent - however, more clinically oriented folk looking for answers stumble across the work and suddenly something very obscure becomes very interesting and hot stuff. Work on the retroviruses focused inter alia on transcription of DNA to RNA (an important topic to be sure) is an excellent example - without that foundation, we would have been very much slower in identifying the HIV virus. We see similar processes in climate sciences - think of the extraordinary interdisciplinary collaboration underpinning GRACE. Phillipe @ 20: I'm conscious of the limitations of WUWT. I did say the readership is far less sophisticated than the bloggers - that's not a glowing endorsement of the bloggers. Some of the posts have a very puerile quality. Still, one does come across enough pieces which are food for thought - hence I visit but almost never post (in marked contrast to this site). In fairness to them, they have put up corrections and counterarguments and more recently they seem to have been trying to align more closely with consensus science. I find it much easier to cope with ideologies I disagree with than with bad faith. While ideology may be impervious to evidence, it has its own internal logic. All of us partake of some ideology (even if we would be loath to call it that). BTW, I have to confess my ignorance: who are G&T?
    0 0
  23. #21: "urban heat island effect" Where have we heard this before? UAH and RSS are satellite temperature measurements. For the global columns in Ned's Fig 8, they average a trend of 0.14ish. All others average 0.16ish; if there is such an effect, then its magnitude is limited by the difference, 0.02 or so. And how does UHI impact the ocean temperatures, which are equally self-consistent? (or is that a part of the conspiracy?)
    0 0
  24. @ 21. That's one of the reasons anomalies are used rather than absolute temperatures. Think about it.
    0 0
  25. Thanks Ned, I wasn't aware of these other individual reconstructions, but it is encouraging to see they are in agreement with the official versions.
    0 0
  26. Ned, the Japanese version of their website seem to have monthly and yearly (World, Northern, Southern hemisphere) datasets in an HTML table.
    0 0
  27. apeescape: Thanks! I hadn't seen that before. It doesn't seem to be on the English version of their pages. chriscanaris: G&T is Gerlich & Tscheuschner. dorlomin: Do you have a link for Steve Mosher's temperature reconstruction? Does it differ much from the others, either conceptually or in the appearance of the results?
    0 0
  28. "The bad faith mentioned by David above is also patent, I have seen it on a number of occurences, in which Watts trumpeted papers that did not support a "skeptic" position at all as if they actually did" I don't know such cases demonstrate bad faith on Watts part, rather than simple ignorance. A year or so ago he was touting a paper which discussed the role of halogenated compounds in ozone depletion as "proving science wrong about CFCs causing ozone depletion". He was simply unaware that CFCs banned by the Montreal Protocol are, in fact, halogenated compounds!
    0 0
  29. It was posted about here. http://rankexploits.com/musings/2010/new-work-on-temperature-reconstructions/
    0 0
  30. dolormin @ 29: Actually, the Mosher reconstruction originally appeared on WUWT where he makes a review similar to Ned's of other data sets. He concludes: 'As noted above there are many questions about the calculation of a global temperature index. However, some of those questions can be fairly answered and have been fairly answered by a variety of experienced citizen researchers from all sides of the debate. The approaches used by GISS and CRU and NCDC do not bias the result in any way that would erase the warming we have seen since 1880. To be sure there are minor differences that depend upon the exact choices one makes, choices of ocean data sets, land data sets, rules for including stations, rules for gridding, area weighting approaches, but all of these differences are minor when compared to the warming we see. That suggests a turn in the discussion to the matters which have not been as thoroughly investigated by independent citizen researchers on all sides: A turn to the question of data adjustments and a turn to the question of metadata accuracy and finally a turn to the question about UHI. Now, however, the community on all sides of the debate has a set of tools to address these questions.' I guess it illustrates the reality that reasonable stuff does appear sometimes on WUWT. dhogaza @ 28: I haven't had a chance to check out WUWT on his CHC/halogenated compound gaffe. Although I happen to remember enough chemistry to know that CFCs are precisely that (at least when you say it explicitly), I probably wouldn't have remembered the Montreal Protocol. It's the sort of mistake I could easily have made. There's a saying which I'm sure has been called somebody or other's law: Before conspiracy, suspect stuff up. It's really a variant of Occam's razor (not an infallible instrument but often useful). At any rate, what is very interesting is the movement towards the middle ground on the part of a number of 'sceptical' players.
    0 0
  31. PS: Thanks Ned for the G&T :-)
    0 0
  32. Nice job, Ned!
    0 0
  33. Very nice post! Just out of curiosity, what was the reason for the large size of the 2008 GHCN adjustment?
    0 0
  34. @chriscanaris, Your opinions on WUWT do not correspond to mine. To me, it is a political rather than a science website. If you think of its readers as a "constituency" they are offered almost continual reassurance from the posters of the rectitiude of their position, that victory is assured, that reason in on their side, and that the opposition are fraudulent posers who are about to be found out. The multiple ironies are obvious, particularly in the regular accusation that climate science is a "religion", but also obvious is the resemblance to politicians interacting with their followers. Most of the threads, while obstensibly "science" or science-related, seem to be shaped with this in mind. As true science, they do not stand up to scrutiny. Most of the science projects initiated by WUWT seem to have run into the sand ... at least I have not heard much about them recently. "Citizen science" that it claims to be pushing has not much to show. Of course, many websites on the pro-side, fall into the same bracket, but are not a strident as WUWT, and have much more science to boot. But then, many of those bloggers are already professional scientists with a day job.
    0 0
  35. werecow writes: Very nice post! Just out of curiosity, what was the reason for the large size of the 2008 GHCN adjustment? I don't know. However, I do find it mildly amusing that certain people make aggressive claims about the GHCN adjustment process when the actual effect of the adjustment is to reduce the magnitude of the post-1970s warming trend. I haven't done a survey, but I would bet that a very large percentage of the WUWT readership assumes that the GHCN adjustments artificially inflate warming, when in truth they add a (very small) cooling trend in recent decades.
    0 0
  36. muoncounter, #21: "urban heat island effect" Where have we heard this before?...etc... Firstly, I'm not a conspiracy theorist. The many people who are included in this post as being independent researchers are all focused on this issue as being the next important one to solve. I believe that the conclusion that the UHI effect is negligible is not an effective way of looking at this issue. We do know that warming is occurring right now Globally but just because we are on the side of the consensus does not mean that we should leave some issues unresolved. And about the ocean temperatures, lets be real, ocean trends in the last couple years have not been exceedingly positive. The warming could perhaps be stored somewhere else (deep ocean maybe?)but it is clear to see that the thermal expansion of the oceans has reduced compared to during the late 1990s. Even Cazenave et al. 2009 conclude that.
    0 0
  37. Ned has produced an elaborate snow job. It reads like these are truly 'independent' sources of data. The critical piece of information regarding NASA, CRU and NOAA reconstructions is this: Quote: "All three have at their core the monthly temperature data from the Global Historical Climatology Network (GHCN), and all three produce both a land-stations-only reconstruction and a combined land/ocean reconstruction that includes sea surface temperature measurements." Endquote It is no surprise that if you run the same core data through a software processing package - you might get similar results. The only 'independent' sources of temperature data are the satellite data from RSS and UAH. I believe these draw from the same satellites. Again it is no surprise that they produce similar results to each other. What is of interest is that there has been a flattening of temperatures since 1998 in all the reconstructions, and overall, the satellite reconstructions since 1975 show less warming than the GHCN charts. Of even more interest is that theoretical CO2GHG forcings have been at their highest levels and steadily increasing over that period with increasing CO2 concentrations in the atmosphere. The surprise conclusion of this article: "The well-known and widely-cited reconstructions of global temperature, produced by NASA GISS, UEA CRU, and NOAA NCDC, are replicable." I should jolly well hope so - otherwise why are we in this monumental debate over the nature and extent of global warming!!
    0 0
    Response: "there has been a flattening of temperatures since 1998"

    This line of thinking has been examined in detail in a recent blog post.

    "satellite reconstructions since 1975 show less warming than the GHCN charts"

    The UAH satellite trend is slightly less than the GHCN trends but the RSS satellite trend is nearly identical to the GHCN trends. The reason for the difference between UAH and RSS is examined here.
  38. Ken Lambert writes: Ned has produced an elaborate snow job. That's a rather unkind thing to say. One of the difficulties of rebutting "skeptic" claims is that they're not uniform. One person claims that there's no warming, another that there's warming but it's from the Sun, and a third that it is anthropogenic but that it will be too small to matter. Inevitably, attempts to answer the claims from person A will lead to complaints from persons B and C that you're ignoring the real point. They may even accuse you of a "snow job" :-) Thus, we see Ken writing: It is no surprise that if you run the same core data through a software processing package - you might get similar results. But that is a surprise to many people. For years, there were all kinds of suggestions that there are problems with the GISTEMP or CRUTEM software. The fact that people wrote different software but get similar results helps dispel those claims about problems with the software. There have also been claims -- including many long arguments on this very website -- that the decrease in numbers of high-latitude stations causes an artificial warming trend. Again, the studies done by people linked in my post dispel those claims. Likewise, there are a lot of people out there who think that the GHCN adjustment process is the cause of the observed warming, and that this warming would disappear if one just went back to the "raw" data. Thus, showing that the warming signal is present in almost identical form in the raw and adjusted data helps dispel that claim. So ... if you never thought there were any problems with the GISS or CRU software, and never believed the widely publicized claims from Joe D'Aleo and Anthony Watts about the "March of the Thermometers" then congratulations. You're way ahead of a lot of your fellow "skeptics", and you can ignore this thread and focus on other arguments. But there are many, many people out there who still have doubts on these points. This thread is for them. Actually, though, you should check out the work by Ron Broberg and Nick Stokes. They've been developing a non-GHCN temperature record, using data from SYNOP reports in the GSOD database. It's quite different from GHCN, though as you can see in Figure 6 above the results are basically the same. Getting back to my point at the start of this comment: Ken, if you think it's a waste of everyone's time for us to be explaining that: * The GISS and CRU software does not introduce "artificial" warming into the temperature record. * The decline in numbers of stations does not introduce "artificial" warming into the temperature record. * The GHCN adjustment process does not introduce "artificial" warming into the temperature record. etc. then there is one constructive thing you can do. Next time one of your fellow "skeptics" makes that argument, you can correct her/him yourself, rather than waiting for me to do it.
    0 0
  39. Robert Way, I agree that there's room for some mildly interesting science on the UHI question. I don't think it will turn out to be zero (that would be surprising) but I don't think it will account for more than a small fraction of the observed warming. We know that over the past three decades the oceans have warmed (obviously not due to UHI) and AFAIK every model suggests that the land should be warming faster than the ocean. Those two facts, plus the fact that land is only 29% of the surface, suggest that UHI's impact on the global mean must be fairly small. I think the more interesting science will be on the question of why the tropospheric amplification is not really showing up. If you ignore the land entirely, and just look over the oceans, the lower troposphere should be warming about 1.4X the rate of the surface. We have satellite measurements of sea surface temperature and of lower troposphere temperature. The LT trend is pretty much the same as the SST trend, not 1.4X higher. Both data sets come from satellites. How will this be resolved?
    0 0
  40. Ken Lambert at 23:17 PM on 26 July, 2010 "What is of interest is that there has been a flattening of temperatures since 1998 in all the reconstructions, and overall, the satellite reconstructions since 1975 show less warming than the GHCN charts." I am highly skeptical of this conclusion. I have added the gradients for all three in degrees/year. Now ignoring the fact you cherry pick 1998 which is an obvious peak el Nino year, and the publicly available satellite data goes back to 1978 and not 1975, and the RSS satellite data has indistinguishable gradient from GISS and other land/ocean based datasets since 1978, and the 20 year gradient since 1990 has increased over the thirty year gradient in all data sets, I ask what flattening? or less warming? I could also have added the various independent radiosonde datasets, eg gradient 0.0193 for HadAT since 1990, but no surprises here either.
    0 0
  41. Excellent synthesis Ned. Thanks for taking the time and for making the effort. What you have here is a comprehensive summary of the pertinent facts about the global SAT record. I'm not surprised that those in denial about AGW are going to try and dismiss it out of hand-- the data presents a very robust (an inconvenient) picture of warming. Peter @40, you beat me to it :)
    0 0
  42. Albatross -- thanks! Peter Hogarth: Here's another way of visualizing this: The gray line is RSS (satellite) monthly temperatures through 2000. The pink trendline is the linear trend 1979-2000. Note that, for the past decade, temperatures have mostly been above the pre-2001 trend. In fact, about 2/3 of the months have been above the trend line, including 10 of the past 12. The one exception was the 2008 La Nina.
    0 0
  43. #38 Ned at 00:01 AM on 27 July, 2010 Likewise, there are a lot of people out there who think that the GHCN adjustment process is the cause of the observed warming, and that this warming would disappear if one just went back to the "raw" data. Thus, showing that the warming signal is present in almost identical form in the raw and adjusted data helps dispel that claim. It is not as simple as that. The effect of adjustments on overall GHCN trend may be negligible relative to the raw dataset, but it is not so with USHCN which is a subset of it. On this subset 80% of warming during the lats nine decades is created by adjustments. Also, the statistics of adjustments is entirely different on this subset. This difference in adjustments for the US vs. the rest of the world either does not make any sense from a scientific point of view or it has such a subtle explanation, that it has escaped all the wise people attending to this blog. You can look up the details here and here. An even more serious question is why to waste time and effort to adjustments that have no substantial effect whatsoever on a global scale? It is also shown, that there is not much difference between "rural" and "urban" trends. But no one has explained yet why the far reaching consequences of this observation are ignored.
    0 0
  44. Robert Way at 23:14 PM on 26 July, 2010 "ocean trends in the last couple years have not been exceedingly positive" I suspect that was written in haste...? Thermal expansion of oceans in recent years: We have to be careful here. Cazenave 2009 was writing just after the altimeter data was showing a temporary dip in rate of MSL rise, there is something of an update in Cazenave 2010 where the recent estimate of reduction in the thermal expansion component of MSL is put into the context of other previous natural variations (see for example figure 7 in that paper) which look similar and the altimeter trend reverting back to the pre-2007 rate after 2008 (yet table 1 is a repeat of the 2009 one with data up to 2007). This is discussed briefly. There is also new (2010) evidence from Grace on increased land storage of water in Llovel 2010 This first estimate based on measurement of Land storage trend contribution to mean sea level trend is slightly negative, giving -0.22 +/-0.05 mm/year. We then have factors like the 2010 reprocessing of the entire DUACS altimeter data set, though this seems to have reduced variability in global MSL terms (no real difference in estimates of MSL rise rate) it has resulted in some significant (>1mm/yr) localised differences (corrections!) between old and new datasets.
    0 0
  45. Ned at 02:04 AM on 27 July, 2010 Thanks, that is indeed a clearer way of visualising the increase. I also forgot to mention I had offset the GISS data in an attempt at clarity.
    0 0
  46. Berényi Péter writes: It is not as simple as that. The effect of adjustments on overall GHCN trend may be negligible relative to the raw dataset, but it is not so with USHCN which is a subset of it. Even if that were the case, the US represents approximately 2% of the surface area of the Earth. There is no way that the USHCN adjustment process is going to have a detectable influence on the global temperature record. As Figure 5 shows, at the global scale you get virtually no difference using raw or adjusted data. BP continues: This difference in adjustments for the US vs. the rest of the world either does not make any sense from a scientific point of view or it has such a subtle explanation, that it has escaped all the wise people attending to this blog. Peterson & Vose 1997 make it clear that different adjustment processes are used for USHCN and non-USHCN stations. The NCDC website FAQ explains that NOAA has detailed station history information for USHCN stations that it does not have for non-USHCN stations. BP continues: An even more serious question is why to waste time and effort to adjustments that have no substantial effect whatsoever on a global scale? Maybe because they want to make individual station records as accurate as possible for local to regional-scale studies, even if those corrections largely get lost in the noise when averaging data globally? Or maybe nobody could be certain there would be no effect at the global scale until actually trying it? Or maybe there's some other explanation.
    0 0
  47. #36: " the conclusion that the UHI effect is negligible is not an effective way of looking at this issue." Seems to me that a necessary step in researching something is a consideration of whether or not it is likely to be of negligible significance. But the more important point was somehow missed: If GISS/HAD/GHCN etc are as consistent with UAH/RSS as Ned has shown, then any major revision of one had better also apply to the other. If UHI can profoundly flatten surface temperature measurements, then what 'correction' will do the same to the satellite data? As far as I can discern, UHI doesn't apply to satellite measurements of atmospheric temperatures. "about the ocean temperatures, lets be real, " Point was: Looking at Ned's fig 8, all blue bars are of comparable height. Again, different data sources and interpretations are consistent with one another about the trend. #37: " no surprise that if you run the same core data through a software processing package - you might get similar results." It would require significant explanation if the results were not similar. Ned has shown that the conclusion all competent measurement systems show increasing temperatures on a global scale during this time period is well-founded. But Mr. Lambert's criticism can be inverted: It is no surprise that if you run the same set of selectively chosen points out of a large data volume through a set of preconceived notions, you get the same tired denialist arguments. What is disappointing, however, is how quickly those arguments revert to mere name-calling and accusation. What makes this blog different is, for the most part, the discussion stays on a higher plane.
    0 0
  48. Ned #38 It was a bit unkind Ned - don't take it to heart. Put it down to hardened arteries and red wine. You obviously put a lot of work into the piece. My criticism centres around the notion that three analyses of the same core data somehow adds validity to the basic core data. The question to be asked is who (and where) assembled the basic core data - and how good is it?? As for moderator Johns comment; and Peter Hogarth #40 ; why does a linear trend line run from end to end of a temperature set, the best or most informative fit? It is most probable that a temperature trend is non-linear in any case. The drivers of temperature are non-linear. CO2GHG forcing is logarithmic, Solar 11 year cycle is sinusoidal, longer term Solar cycles are probably sinusoidal, Radiative cooling is exponential (with T^4), cloud and aerosol cooling nobody really knows - so what is sacred about a linear trend line?? If you do a least squares or other spline or smoothed fit - you will get flattening since about 1998 on all these temperature reconstructions. What has to be explained is how can the earth system be subjected to more forcing and produce flatter temperatures over this last 12 years or so.
    0 0
  49. Thanks, Ken. A few comments on your comments about my comments.... My criticism centres around the notion that three analyses of the same core data somehow adds validity to the basic core data. Again, keep in mind that we have to start with baby steps here. There are people who think the software to produce these reconstructions is secret and the results can't be replicated. There are people who think that decreasing the numbers of high-latitude stations is artificially warming the record. There are people who think that the GHCN adjustment process is somehow implicated. None of these are true, so it's helpful to establish that. I agree that going further requires looking at other data sets besides GHCN. Of course we have satellite data on sea surface temperatures and lower troposphere temperatures, so that's helpful. It would also be helpful to have another land temperature record not based on GHCN -- that's what Ron Broberg and Nick Stokes have been working on. Anyway, there seems to be a lot of evidence in support of the existing surface temperature reconstructions. After spending all this time researching them, I now feel pretty confident. Nobody seems to be able to come up with a reconstruction that's radically different. Ken continues: It is most probable that a temperature trend is non-linear in any case. Yes, I agree, though I'd politely differ a bit from your explanation of this. CO2 doesn't depart a lot from a linear trend over short (1-2 decade) time scales, and I think the solar contribution is pretty small (it's been declining over the past few decades but temperatures have been high since 2000). I think most of the nonlinearity comes from internal processes related to the movement of heat within the climate system (e.g., ENSO). That's a difficult thing to model, so looking at short time periods (sub-decadal) is problematic. My personal opinion about the "flattening" is that it's an artifact of the very rapid jump in temperatures at the start of the decade (2000-2002) plus a large La Nina near the end (2008). If you refer back to my figure from a previous comment temperatures have persisted at a high level. A substantial La Nina in 2008 only temporarily brought us down to temperatures that were ordinary back in the mid-90s, and a relatively small El Nino now produces temperatures that rival the peak from the monster El Nino of 1998. So I think the "flattening" thing will ultimately turn out to be an artifact of people over-interpreting the noise in the signal.
    0 0
  50. Ned, Personally I think the most important question right now is where all the missing heat is. I know individuals like to think it is being stored in the deep ocean but how can we really know for sure? Either way once the heat comes to the surface then we will see quite high temperatures. I also agree that the UHI is not a non-issue as some may speculate. I imagine it does have some effect and probably explains perhaps some of the difference between the satellites and the temperature measurements at the surface. Finally, Peter Hogarth, I realize that may have came across wrong. Of course Ocean temperature trends are positive compared to the baseline. I just meant that the SSTs have not followed the warming of 21st century air temperatures quite so well as one would think.
    0 0

1  2  Next

You need to be logged in to post a comment. Login via the left margin or if you're new, register here.


The Consensus Project Website

THE ESCALATOR

(free to republish)


© Copyright 2024 John Cook
Home | Translations | About Us | Privacy | Contact Us