


 Arguments


Daffodils in bloom, the warmest ever December: how worrying is the world’s strange weather?
Posted on 9 February 2016 by Guest Author
December temperatures in London have been warmer than July’s. Scotland is balmier than Barcelona. Artificial snow covers European ski slopes. Africa faces its worst food crisis in a generation as floods and droughts strike vulnerable countries.
With unusual weather from Britain to Australia, scientists are blaming climate change – but also the natural phenomenon called El Niño, which is raising temperatures and disrupting weather patterns. A double whammy then, but how disturbed should we be as the records tumble?
According to the UK Met Office, the exceptional warmth in Britain and northern continental Europe is linked to the strongest El Niño ever recorded. “What we are experiencing is typical of an early winter El Niño effect,” said Adam Scaife, head of Met Office long- range forecasting.
The cyclical event, named after the birth of Christ because it traditionally occurs in Latin America around Christmas, sees temperatures in the equatorial Pacific rise several degrees. The consequences in years like this are dramatic. Monsoons and trade winds are disrupted, leading to cyclones, droughts, floods and food shortages across the world.
Friday night was one of the warmest recorded in the UK in December. With the warm spell due to continue over Christmas, it is almost certain that more records will be broken. According to Scaife, “we cannot attribute the recent floods [in Britain] to the El Niño, but in early winter [during El Niño years] we tend to have a strong jet stream which brings us mild conditions. In late winter, January and February, we tend to get a weak jet stream which brings more wintry conditions.”
Roger Brugge, a senior scientist at Reading University’s atmospheric laboratory, said: “The first 17 days of December have been the mildest on record by a remarkable 1.1C. The average temperature during this period, of 10.6C, is similar to what can be expected around the beginning of May.”
Worldwide, November was the warmest recorded by the US government’s National Oceanic and Atmospheric Administration, and the seventh month in a row where temperatures have been well above the 100-year average; 2015 is on track to be the warmest year and last week the Met Office forecast that the global average temperature in 2016 would be a record 1.14C above pre-industrial temperatures.
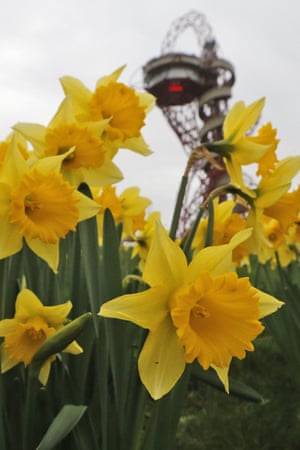
Daffodils in bloom at London’s Olympic Park December. Photograph: Frank Augstein/AP
So is the current spell of exceptional heat around the world a foretaste of life in a warmer climate, or just a temporary blip? Atmospheric scientists believe we are seeing climate change with an El Niño effect on top. The two combined are raising temperatures dramatically.
“We expect 2016 to be the warmest year ever, primarily because of climate change but around 25% because of El Niño,” said Scaife, who added that El Niño was not linked directly to climate change but exacerbates its effects.
The effects are already being seen worldwide, and nowhere more dramatically than in east and southern Africa, which is most vulnerable to climate change and extreme droughts. The El Niño effect has shifted rainfall patterns and led to severe drought. After years of good harvests and relative food security, Africa faces one of its biggest food emergencies in a generation with Ethiopia, Malawi, Eritrea, Somalia, Zimbabwe and other southern and east African countries all needing emergency food aid within weeks.
“The projections across Africa are shocking; 39 million people are expected to be affected,” said a spokeswoman for the UK Department for International Development. “Around 3.5 million people in Africa could also be affected by floods and subsequent disease epidemics. The situation in Ethiopia is particularly worrying, with 18 million people projected to require food assistance in the coming months.”
This month the UN World Food Programme said 2.8 million people in Malawi needed urgent food aid as shortages had more than doubled food prices from 2014 levels. This year, it said, southern Africa’s cereal harvest fell by almost a quarter, down to 34 million tonnes.
“Serious concerns are mounting that southern Africa will this coming season face another poor harvest, possibly a disastrous one,” warned the UN’s Office for the Coordination of Humanitarian Affairs. The UN has appealed for £5.7bn for humanitarian aid for Africa. A further £67m has been requested for Central America, the Pacific region and northern South America, where a combination of intense rains and droughts has devastated crops.
The widespread El Niño effects are being felt in Latin America as well as Indonesia and Papua New Guinea, where it has led to some of the worst forest fires in decades. In Central America, one of the most severe droughts on record has led to 3.5 million people in Guatemala, Honduras and El Salvador needing food aid. The UN says that more than two million people have been affected in Peru and Ecuador.
Each El Niño is different, but this year is being compared with 1997 and 1998, when 21,000 people died and $36bn of damage was caused. Scientists say that El Niños can add significantly to climate change. Because the phenomenon causes less rain to fall in many areas of the tropics, forests become especially vulnerable to man-made fires, which accelerate carbon dioxide buildup in the atmosphere and reduce air quality.
The tens of thousands of fires that engulfed much of Indonesia this year and led to serious air pollution across the region have been calculated to have emitted more greenhouse gases in one day than is generated from all US economic activity, according to the Washington-based World Resources Institute. The 1997 fires in Indonesia also produced huge carbon emissions, estimated to be the equivalent of 13%-40% of the world’s annual fossil fuel emissions.


Here, in Mid-Wales, the first Lesser Celandines come into flower in February most years. This time round, I photographed their flowers - and those of Red Campion - on December 29th!
"Daffodils in Bloom"
This has happened before, and especially before all the noteriety regarding global warming. Quite often there may be a warm spell and trees start to bud early, and it gets cold again and the buds die and the tree will bud again, when the buds will sustain.
One needs to realize, that there are several regions of the United Kingdom, which exist, and have done so for many, many, years, in a Sub Tropical Cimate. There are Palm Trees, and other such 'flora', which is endemic to the United Kingdom - thanks in part to the Gulf Stream and the North Atlantic Drift.
There will be more daddodils to come; in March or April, they will bloom again, just as they have before.
NecktopPC - Yes, there is yearly and even decadal variation in flowering times everywhere. However, there is also a distinct and statistically significant trend in earlier and earlier blooming, in pole-ward shifting of plant hardiness zones, and claiming it's all due to short term variation is quite frankly nonsense.
Just from my region, see Abu-Asab et al 2001, "Earlier plant flowering in spring as a response to global warming in the Washington, DC, area", noting that those times "...show a significant advance of 2.4 days over a 30-year period [...] Advances of first-flowering in these 89 species are directly correlated with local increase in minimum temperature."
Also see Chung et al 2011, "Predicting the Timing of Cherry Blossoms in Washington, DC and Mid-Atlantic States in Response to Climate Change", noting that "Our results indicate that PBD [Peak Bloom Dates] at the Tidal Basin are likely to be accelerated by an average of five days by 2050 and 10 days by 2080 for these cultivars under a mid-range (A1B) emissions scenario."
The times, and the plant zones, they are a-changing. Handwaving like yours doesn't change that.
KR - There are some in the scientific community that do not hold Springer in high esteem; claiming that the "journal has published some real gems."
RE: "The times, and the plant zones, they are a-changing."
Here is a Blooming schedule: http://www.nps.gov/chbl/cherry-blossom-bloom.htm
NecktopPC - A Guilt by Association fallacy (perhaps better described as Poisoning the Well) is your response to Abu-Asab et al 2001? That's no argument at all. And linking only the current bloom schedule is a red herring - the opening post is about climate trends.
If you have genuine issues with that Abu-Asad et al's methodology (which is quite simple, really) or their conclusions (difficult to see how, simple statistics), preferrably supported by some published literature, great, it might be interesting to discuss. The same goes for growth regions published by the USDA - I'm sure farmers would love to avoid changing crops due to shifting hardiness zones, and would eagerly await actual evidence for climate stability.
However, throwing out nothing but logical fallacies seems to indicate you have no actual evidence backing your posts.
The general theme over the next few days will be for things to get a bit colder, more in keeping with the season - temperatures will drop to around six degrees over the next few days, with the prospect of London and the south east being struck by the occasional snow flurry.
2010: Coldest December since 1890. Average UK temperature of -0.7°C, although parts of Scotland were far colder at -21.3°C URL
London weather: Capital set for cold snap as Arctic blasts hit the UK
The unseasonably warm winter will take a dramatic cold turn as maximum temperatures fall from 11 degrees to a maximum of 5 over the next week. URL
And the temperature today is at 6 degrees C and it is forecast to be -1 on Tuesday - URL
[PS] Since this site is about climate not weather, papers about trends, comparisons of hot records versus cold records and so on are relevant. Weather reports are not, nor are they on topic.
NecktopPC - See Does cold weather disprove global warming? The answer is No. Short term weather is not climate, and if you are arguing that the variation of a cold week disproves long term trends, you are simply wrong. Rather, you are just repeating earlier red herrings.
KR - I was not disproving global warming, based on the weather trends in the U.K.
I provided some weather information simply as a means of showing that the weather in the U.K. and daffodils blooming, was a one off, and that its not so unusual. (snip) The sky is not falling.
"According to the UK Met Office, the exceptional warmth in Britain and northern continental Europe is linked to the strongest El Niño ever recorded. “What we are experiencing is typical of an early winter El Niño effect,” said Adam Scaife, head of Met Office long- range forecasting."
Source
Climate is the average of weather over time and space. An easy way to remember the difference is; climate is what you expect, like a very hot summer, and weather is what you get, like a hot day with pop-up thunderstorms.
[RH] Sloganeering phrase snipped.
PS - I am not disputing that your site is about climate.
Can climate exist without weather?
Weather is a major factor of climate. Weather over periods of time, results in the establishment of a climate; over time.
Does weather not make climate? Surely you would agree that climate does not constitute weather - and climate is based on the history of weather.
December 2015 (Daffodils) may have been the warmist in the U.K. thus far. but it all depends on the historic average trends (climate), and over decades.
Point being; should the past December (and it should) be included into the historical data, and then the average temperatures (calculated) considered; how much of an increase or decrease is there, for Decembers as a rule, over that historical period?
El Nino by itself in not weather, but it certainly is, a factor of weather - and likewise, so is the gulfstream and the jetstream.
Likewise: El Nino by itself, does not constitute climate, but it does have a definite effect on climate, albeit not in the long term. It does influence the weather, and the climate, and can be a factor, for as much as two years or more.
If there were no weather reports, and or the collection of weather data, then how would climate be established, or determined? One would only have one's memory or personal opinions to go on, in order to come to a decision, regarding what the climate is, at a particular location or country.
[PS] Have you actually read the article you are commenting on? Eg "We expect 2016 to be the warmest year ever, primarily because of climate change but around 25% because of El Niño,” said Scaife, who added that El Niño was not linked directly to climate change but exacerbates its effects." Your weather reports seem to be pushing the view that nothing is really changing, nothing to worry about. The article, and papers provided by other commentators, show otherwise. You are welcome to provide contrary evidence of trends. So far you have not provided anything about trend.
NH average temperatures for Dec can be found here, should you want to calculate the trend.
For those who are interested (as opposed to those who from their comments seem to feel that climate isn't changing), Hansen et al 2012 discusses how warming trends 'load the dice' for more and more extreme heat events. Previously 3-sigma outlier heat waves affecting 1% of the globe (using a 1951-1980 baseline) are now affecting 10% of the globe, as they are now less than 2-sigma extremes. What was once rare in terms of a heat wave is becoming more and more common, and events like the UK warm December, while not in and of themselves evidence of change, are exemplars of how observed change is affecting us.
This can also be seen in just the statistics of how often we see temperature extremes, as in Meehl et al 2009 - the ratio of record highs to record lows corrects for number of observations and length of temperature record, and clearly show more and more record highs compared to record lows for the last 40+ years.
I would never claim a single month warm/cold event was by itself evidence of a trend - but we can look at the climate statistics and trends (as opposed to the weather), see how the frequency of those events is changing, and be more than justified in pointing to an extreme heat event as a harbinger of the future.
I do wonder if the posted article has suffered a bit from too much editing. Is it correct in the third paragraph to conflate the "exceptional warmth in Britain" during December with the Adam Scaife quote talking of us "experiencing is typical of an early winter El Niño effect"?
December in southern UK was startlingly "exceptional" with the CET December average temperature head and shoulders above anything previous (since 1659). If this were what the Adam Scaife quote referred to, this would be "typical of an early winter El Niño effect," and we should expect December 1997 to show at least signs of being exceptionally warm. But we don't see that. While CET's December 1997 was not a cold December, sitting at =10th warmest in the last 30 years of CET Decembers it's a bit of a stretch to even call it 'warm'.
So I would suggest the Adam Scaife quote was more likely referring to global climate events and not to the UK's warm winter.
Following up on KR's comment above, Hansen and Sato have updated their data. For 2015 21% of the world had 3-sigma or greater temperatures during Jun/Jul/Aug of 2015. Since 0.1% is the expected rate of 3-sigma temperature, more than 99% of heat waves during the summer could be attributed to AGW. Winter temperatures have higher standard deviations but the temperatures are so high now that a significant amount of high winter temperatures can be attributed similarly to AGW. The December England temperatures were so extreme that the likelyhood of similar temperatures without AGW would be very small. (Hansen and Sato only show the JJA data).
[Rob P] Spatial pattern of extreme temps from Hansen & Sato:
michael sweet @12:
It is not quite that simple. The statistical distribution in Hansen, Sato and Ruedy (2012) is against a thirty year period (1950-1980). Therefore it represents the probability, with no AGW, of a seasonal distribution of heatwaves over a thirty year period. Within that, it is quite consistent that any given year have an unusually high number of heatwaves, and correspondingly, for some other year to have an unusually low number of heat waves. Ergo, because at least some of the high % of warm areas in 2015 is due to the El Nino, you cannot reason that 99% of heatwaves in 2015 could be attributed to AGW.
If you wanted to determine that attribution from Hansen, Sato and Ruedy's work, you would first need to find the statistical distribution of warm areas in detrended 2015 data. That would determine the area subject to heatwaves in a no AGW case, ie, based on natural variability alone. From that, you could then determine the increase in areas subject to heatwaves due to the trend, which could then be attributed to AGW.
Tom,
THe statistics are above my grade. On the other hand, the baseline is 1950-1980 which includes a substantial amount of warming from pre-industrial. If you subtract out all that heat I doubt that more than 0.1% 3 sigma remains, even if you only used El Nino years.
I have heard it argued that Hansen and Cato only showed that the average temperature over the summer was hot and that single months have a higher variation. I do not think much of those arguments. The globe is clearly warmer and we have to own up to the damage that we have done.
michael sweet @14:
You are right to think little of those arguments. They completely ignore the drift in annual values as shown on this adaption of Hansen (2013)'s chart.
Further, they completely ignore the drift in 11 year distributions as shown in the update:
As you can see from that update, there is slight variation in the 11 year distributions that strongly overlap the baseline period, and the first following 11 year period is not so distinct that it requires significant explanation. The two following 11 year periods, however, and the definite trend certainly require explanation (except for NH Dec to Feb). Detailed statistics would show how much they are in need of explanation (ie, how statistically significant they are, or more correctly, what their p value is) and may show the drift shown in the fourth panel is statistically significant. But eyeball mark 1 is sufficient to show something interesting is going on in the rest of the panels (particularly the first).
Tom,
We agree. It frustrates me that scientific posters (where you carry much of the burden) are held to a high standard for claims that AGW causes warming while skeptical posters can make whatever wild claims they want. This happens everywhere.
Necktoppc at 8 claims that the high temperatures in Britian are expected because of the strong El Nino. Why was 1998 so cold when El Nino was the same as 2015? (S)he claims at 2 "This has happened before, and especially before all the noteriety regarding global warming." Has any evidence been presented that this claim is true? A single month in the last decade was rated cold and that cherry pick is offered against the mountain of high temperature records.
Tamino has a new post that last month broke the anomaly record for NASA, set in November 2015. The anomaly is about 0.2 higher than any before November 2015 but according to skeptics, it could still be caused by the El Nino. A local fact checker rated an Obama statement that fish were in the streets of Miami (from sea level rise) as half true because it was actually in a city next to Miami called Miami Beach. Meanwhile Ted Cruz claims it is not getting warmer and is not called on it. Australia shoots the messanger to stop the message.
We need to go beyond these arguments of if AGW is occuring and move on to solutions.
You do a great job here dealing with the skeptics day after day.