Climate Science Glossary

Term Lookup

Enter a term in the search box to find its definition.

Settings

Use the controls in the far right panel to increase or decrease the number of terms automatically displayed (or to completely turn that feature off).

Term Lookup

Settings


All IPCC definitions taken from Climate Change 2007: The Physical Science Basis. Working Group I Contribution to the Fourth Assessment Report of the Intergovernmental Panel on Climate Change, Annex I, Glossary, pp. 941-954. Cambridge University Press.

Home Arguments Software Resources Comments The Consensus Project Translations About Support

Twitter Facebook YouTube Mastodon MeWe

RSS Posts RSS Comments Email Subscribe


Climate's changed before
It's the sun
It's not bad
There is no consensus
It's cooling
Models are unreliable
Temp record is unreliable
Animals and plants can adapt
It hasn't warmed since 1998
Antarctica is gaining ice
View All Arguments...


Username
Password
New? Register here
Forgot your password?

Latest Posts

Archives

A Flanner in the Works for Snow and Ice

Posted on 23 January 2011 by MarkR

A new paper by Flanner et al in Nature Geosciences tries to estimate the so called ‘cryosphere albedo feedback’ since 1979. As Earth warms, ice and snow melt and the loss of their shiny, reflective surfaces means more sunlight is absorbed and global warming receives a boost.

The strength of a feedback can be calculated from how much extra heating it adds as temperatures increase; the equations are here. Climate models expect that changes in Northern Hemisphere snow and ice since 1979 should have been a positive feedback of about 0.25 W m-2 K-1 - i.e. for each degree of global warming, the loss of snow and ice means that another 0.25 W of sunlight is absorbed per square metre of the Northern Hemisphere. Globally, and in the long run it’s expected to be 0.2 because there’s less snow in the south and you eventually run out of summer snow to melt.

Flanner et al use satellites to measure the change in shortwave (i.e. sunlight) reflectivity across the Northern Hemisphere from 1979 to 2008. 

They find the total amount of cooling that ice & snow provide to the Northern Hemisphere month by month split between sea ice and snow:
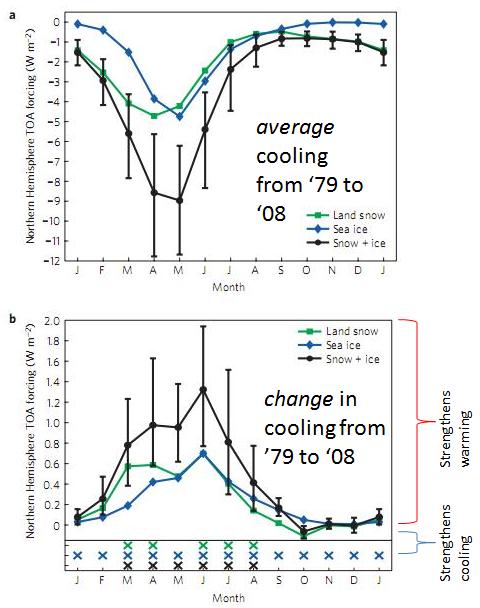


Figure 1a) is the total cooling effect by month of snow, ice and snow+ice. b) is the change in cooling effect for each month since 1979 split into snow, ice and snow+ice. Positive means melting has led to more warming, negative means it’s added to cooling.

Even though there is much more ice in the winter, the days are shorter and the sunlight weaker so the total cooling effect is smaller. May to June ice & snow is much more important even though there is less of it. Next they made annual averages and mapped these over the hemisphere:
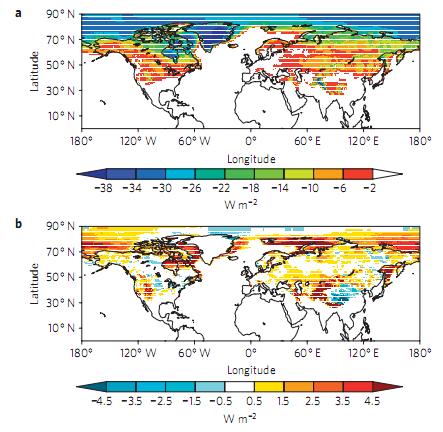
Figure 2a) total cooling effect and b) change in cooling effect since 1979 in snow and ice of the Northern Hemisphere.

The authors find that the total effect is 0.33-1.07 W m-2 K-1 with a best estimate of 0.62 W m-2 K-1, significantly higher than climate models’ 0.25 W m-2 K-1. Models have underestimated the darkening of the Northern Hemisphere and therefore how much global warming we’re ultimately in for.

Perhaps the first snow and ice melted more quickly than expected and eventually we’ll run out of the easy to melt bits, or maybe the decline in Arctic sea ice will halt for ~30 years to bring it back in line with models. However, if the current pattern holds then this would boost the best estimate of global warming temperature rises by about 20% - here’s hoping it’s just a blip!

0 0

Printable Version  |  Link to this page

Comments

Prev  1  2  3  4  Next

Comments 51 to 100 out of 156:

  1. 50, Ken,
    if you compare the Arctic circle with the Equator
    The amount of insolation in the Arctic does not need to match the Equator for it to be relevant to the Earth's climate. All of your attempts to try to redirect the discussion around this are just gamesmanship.
    0 0
  2. 50, Ken, As an aside, concerning the Arctic Circle, I merely mistyped my sentence... I'd meant to say "within the Arctic Circle at 75˚ (which is where the edge of the ice generally is in March/April, and is right now, and so is the primary area of concern). Your constant efforts to nitpick people's words and then pedantically carry on about it are neither helpful to debate nor appreciated, and I personally think they reflect rather poorly on you yourself rather than the people whom you are criticizing. [Moderators: Yes, I'm in a very bad mood this morning, and so have little patience for some things.]
    0 0
  3. 50, Ken,
    So how about putting some numbers on your assertion in the light of the above facts.
    Ummm... isn't that the point of Flanner's paper? So you're implying that my position has no credibility unless I invest the time and energy into performing the effort, for a mere comments thread, equivalent to the paper under discussion? How about we stick with Flanner, as summarized in the above post:
    However, if the current pattern holds then this would boost the best estimate of global warming temperature rises by about 20%
    0 0
  4. Ken Lambert @48 insists on a number of very bad arguments. First he insists that comments meant to defend a claim of very small energy gain in the arctic must not be interpreted that way because if you do, that would make him look bad. I do not think much of that claim, but were I to properly address it I would necessarily violate the comments policy, so I will not pursue it. Second, he insists on treating the total energy flux, the total change in energy flux, the total forcing, the total change of forcing, and the total energy stored in a particular way as if they were all the same thing. Thus he argues that the total change in forcing in the arctic cannot be greater than that at 23 degrees North simply because the total energy flux at 23 degrees North is greater than that in the arctic. As it happens, even for the Green House Effect, the total change in forcing is known to be stronger at higher latitudes, even though the total forcing is greater in the tropics, so his argument, if you distinguish between these two things is absurd. Likewise he insists that because Trenberth determined the total energy used in additional ice melt in the arctic is about 1*10^20 Joules per annum, that this sets an effective limit on the total change in flux, and change in forcing in the arctic. The non-sequitur is evident. Energy gained need not be retained, and if retained need not all go into one usage. In fact it is known that arctic water is carried to the ocean depths, carrying substantial heat with it. It is also quite probable that increased forcing in the arctic will result in less energy transfer from the tropics, resulting in a net heat gain outside the arctic. Without a full accounting of heat flows into and out of the arctic over the period of interest, which Lambert neither attempts nor cites, his argument is missing crucial premises. It is as though he believes that if he does not know what the energy flows are, they must not exist. It is only necessary to keep these various concepts distinct to see the absurdity of Lambert's arguments on these points - so no further rebuttal is necessary. Finally, Lambert persists in his arguments regarding the size of the area effected, and the low angle of incidence, as proof that change in forcing in the arctic cannot be significant. These factors are significant, and are fully accounted for in studies such as those by Flanner. Therefore, his argument is ungrounded. If he wished to pursue this argument honestly, he would analyse the method used by Flanner to account for these factors, and show the flaws, if any. For whatever reason, he wants to avoid that work, and declare Flanner void based on his own unquantified estimates of the effects involved, together with his misuse of a number from Trenberth. The easiest way to rebut him is to give him all he asks for. I previously worked out a rough estimate of the total increase of energy flux absorbed in the Arctic due to loss of sea ice over the last thirty years. That number is not to be confused with the increase in forcing as it does not account for the increase in outward flux. It was sufficiently large, however, that it was evident that even after allowing for any reasonable increase in outward flux, the forcings claimed by Flanner are reasonable. It is not possible to refute them in other words, by back of the envelope calculations. Lambert, of course, considers by number too large. He thinks it should be 2 orders of magnitude smaller. So I recalculated the figure making conservative assumptions, and allowing for every factor he has identified as significant. (I also did not allow for the other factors he did not bother identifying that tend to work the other way.) The result? The minimum change of inward flux with the most conservative estimate is just a third of my initial estimate (after correction for an error in calculation). Where, for his argument to fly, Lambert needs it to be 150 times smaller, it is just 3 times smaller. No wonder Lambert never quantified his argument, for once you do it is transparent it will not carry the weight he puts on it. The new calculation follows: Courtesy of Daniel Bailey, we know that the average latitude of the edge of summer sea ice in the arctic is 75 degrees. Over the summer months, at 75 degrees North, the average Zenith angle is about 57 degrees, with the sun varying from 57 degrees to 3 degrees above the horizon during the 24 hour day. I will treat the sun as having an angle above the horizon of 55 degrees for 3 hours (around noon), 45 degrees for 6 hours (around 9 am and 3 pm), 30 degrees for 6 hours (around 6 am and 6 pm, 15 degrees for six hours (around 3 am and 9 pm), and 0 degrees for 3 hours (around 'midnight'). These are, of course, approximations, but by my estimate they underestimate the values, which will lead to an overstating of the albedo of water at that latitude in the NH summer. They are more conservative than simple geometry indicates, of course, because refraction in the atmosphere means that light curves towards the surface, thus striking the surface at a higher angle of incidence than indicated by simple geometry. I would not normally consider this worth mentioning, but Ken Lambert wants to mention every factor that operates on the other side of the equation, not matter how slight. We should therefore keep track of all the factors that he does not want to mention. To actually determine the albedo, we consult the following chart from wikipedia: From that we can determine the ocean at that latitude will have an albedo of 0.05 for 15 hours of the day, ie, for any time when the sun is more than 20 degrees above the horizon. It has an albedo of 0.15 for six hours of the day (when the sun is about 15 degrees above the horizon), and an albedo of 1 for 3 hours of the day. Again, you will notice these are conservative estimates based on the charts. Therefore the average albedo is 0.2 My original estimate of ocean albedo was 0.1 The difference means that the change in albedo when sea ice melts is 0.7 rather than the 0.8 of my original estimate, meaning my original estimate was 1/7th too high. Those who have followed KL's posts in this debate will wonder why he has made such a big thing of the increase in albedo because of the high angle of incidence. Those of a more cynical nature will wonder why he always mentioned it, but never quantified it. I need to make some further adjustment based on data in Trenberth's energy balance diagram: The first thing to notice is the cloud albedo, which is 0.23 This is a significant over estimate for the arctic as there is a much higher amount of cloud in the tropics. I will use the figure unadjusted. The second thing to notice solar radiation absorbed by the atmosphere, which is again about 23%. Adjusting that for the average increase in path length over the day at 75 North over the summer months leads to a calculated absorption of 46%. Again, this is a significant over estimate of the effect. Much of the absorbed energy is UV radiation absorbed in the mesosphere and stratosphere. Because it is almost entirely absorbed, even in the tropics, the additional path length cannot lead to a doubling of the energy absorbed. In fact, in those portions of the spectrum where the radiation is entirely absorbed, increasing the path length results in no increase in absorption. Even where only part of the energy is absorbed, the correct treatment would be based on the Beers Lambert law, which applied to the total absorption would lead to an estimate of 40% absorption from doubling path length (rather than the 46% I will use), and is still an overestimate as it still does not allow for those significant areas of total absorption, particularly in the UV spectrum. Finally, it is also an overestimate because Trenberth's figure already includes the increased absorption due to path length in polar regions in the average, inflating the base figure before my calculation. Allowing for all these factors, a more accurate estimate is likely to be around 32% absorption, but I intend to give Lambert's objections absolutely everything that they could be conceivably by permitted, so I will use the 46% value. So, given these figures, and given that the top of atmosphere summer insolation at 75 degrees North averages 500 w/m^2, we can then determine that the average absorption by open ocean surface at 75 degrees North in the summer is 500*0.54*0.77*0.8 = 166.32 w/m^2. We can also determine that the average absorption by sea ice at the same latitude and time is 500*0.54*0.77*0.1 = 20.78 w/m^2. The difference, 145.53 w/m^2 is the additional power absorbed in the arctic for each square meter of sea ice that melts. Over the summer season, that means for each additional square meter of sea ice melted, and additional 1.1 billion Joules of energy is absorbed. The average change in sea ice area since 1978 during the summer is a reduction of 2 million square kilometers, or 2*10^12 square meters. That means the average additional energy received in the arctic summer due to global warming induce melt back is 2.2*10^21 Joules, or about a third of my rough estimate. Please note, because I have estimated conservatively at every step, this is definitely and underestimate of the real value. Also note, this estimate takes into account every single one of the factors Ken Lambert considers important. To put this into perspective (and bring it back on topic), Flanner estimates a change NH average forcing from melted sea ice of 0.47 w/m^2 over the three months with greatest increased forcing, which works out at 9.25*10^20 Joules over that period. That is less than half of the minimum value for the increase of incoming energy. Consequently, Lambert's claim that "Flanner's number is simply impossible" shows only that he is unwilling to address the evidence. Just briefly, and because Ken Lambert insists the comparison is significant, we might compare that figure to the equivalent figure at 23 degrees North. The comparison is very easy. There was no sea ice at 23 degrees north, even in the little ice age. So the additional energy absorbed due to sea ice melt at 23 degrees north is zero. Ken Lambert keeps on arguing that the calculations of additional incoming energy by me, and the calculations of ice albedo feedback by Flanner must be in error because of the relatively small part of the globe which is effected. What he neglects is that it may be a small part of the globe, but it is a very large part of the ice (and snow) covered portion of the globe. Because albedo effects are much stronger, for a given percentage change in the forcing agent, than are green house effects; this means that a relatively small part of the globe can have a disproportionately large effect on the total feedback to an initial forcing.
    0 0
  5. Tom Curtis #54 Stick to facts rather than emotive terms such as 'bad' Tom. Before we start on your 'Gish Gallop' as this site is wont to say, please explain what you mean by 'zenith' angle? The angle which the sun's rays strike the surface of the Earth is usually called the 'angle of incidence', or 'altitude'. At 75 degrees N latitude, at the summer solstice (Noon, June 21) this angle would be 23.4+(90-75) = 38.4 degrees. At midnight it would be 23.4-(90-75) = 8.4 degrees. Yet you say: "Over the summer months, at 75 degrees North, the average Zenith angle is about 57 degrees, with the sun varying from 57 degrees to 3 degrees above the horizon during the 24 hour day. I will treat the sun as having an angle above the horizon of 55 degrees for 3 hours (around noon), 45 degrees for 6 hours (around 9 am and 3 pm), 30 degrees for 6 hours (around 6 am and 6 pm, 15 degrees for six hours (around 3 am and 9 pm), and 0 degrees for 3 hours (around 'midnight')." How did you get these numbers Tom?? Here is a calculator you can use to check my numbers if you like: http://jamesrbass.com/sunform.aspx
    0 0
  6. Ken Lambert @55, I apologize to everyone. I have made an inadvertent error which sabotages my effort to give Ken Lambert everything he could possibly ask for his theory. To correct the error, I have proceeded as follows: 1) For each of May 21st 2011 and July 20th 2011, I have used the azimuth and altitude calculator referred to by KL to calculate the sun's altitude at 00:00, 01:30, 04:30, 07:30, 10:30, 13:30, 16:30, 19:30 and 22:30. 2) From one, I took the lowest altitude for each of the time intervals bracketed by those numbers, and including the interval from 22:30 to 01:30 as being one interval. I then rounded down to the nearest whole multiple of five degrees. This gives me altitudes for each of the time intervals of 5 (5.1) degrees for the three hours surrounding midnight; 5 (6.2) degrees for the three hours around 3 am and 9 pm; 10 (13.8) degrees for the three hours around 6 am and pm, 25 (25) degrees for the three hours around 9 am and 3 pm, and 30 (33.8) degrees the three hours around midday. (Numbers in brackets are the minimum values before rounding.) 3) I then compared these angles to the second table in 54 above to determine the reflectivity for each angle. Based on the curve for circular light (as light from the sun is not polarized), the albedo for a 5 degree angle of incidence is determined as being 0.6; for a 10 degree angle of incidence, 0.3, and for 25 and 30 degree angles of incidence, 0.05. 4) I then take the average of the values, which comes in at 0.31875 I shall round this up to 0.35, which compares to the 0.2 value I mistakenly calculated above. Because the two dates chosen are each 30 days seperate from the summer solstice, I believe this provides a reasonably conservative estimate of the average albedo over the summer period at 75 degrees latitude. If Ken Lambert thinks this is insufficiently biased in his favour conservative, he can let me know and I will do the calculation for 45 days before and after the solstice. Making this adjustment reduces the additional energy absorbed over the summer according to the conservative estimate from 2.2*10^21 to 1.7*10^21 That is still nearly double the 9.25*10^20 which we can expect from the additional forcing as calculated by Flanner over that period. It is still sufficient energy to melt 1.9 million square kilometers of 3 meter thick ice, or 25% of the remaining icecap. And it is still approximately 3 times the energy annual energy influx that Ken Lambert insists, "Therefore the Arctic must absorb less (much less) than the uniformly distributed portion of 6.4E20 Joules/yr." And it is still 17 times greater than the energy which Ken Lambert misrepresents Trenberth as indicating is the maximum absorbed in the arctic. Ken Lambert questions some of my other figures without being explicit. All are adequately explained - but if he feels my using a 90 day summer, or ignoring the effects of waves, or whatever, is insufficiently biased in his favour conservative, he again need only let me know. Ken Lambert would also do well to learn the meaning of "Gish gallop" before he makes a complete fool of himself.
    0 0
  7. Tom Curtis Thanks for your gracious admission that your incidence angle numbers were wrong and mine were right. This is your calculation form Post #54: "So, given these figures, and given that the top of atmosphere summer insolation at 75 degrees North averages 500 w/m^2, we can then determine that the average absorption by open ocean surface at 75 degrees North in the summer is 500*0.54*0.77*0.8 = 166.32 w/m^2. We can also determine that the average absorption by sea ice at the same latitude and time is 500*0.54*0.77*0.1 = 20.78 w/m^2. The difference, 145.53 w/m^2 is the additional power absorbed in the arctic for each square meter of sea ice that melts. Over the summer season, that means for each additional square meter of sea ice melted, and additional 1.1 billion Joules of energy is absorbed. The average change in sea ice area since 1978 during the summer is a reduction of 2 million square kilometers, or 2*10^12 square meters. That means the average additional energy received in the arctic summer due to global warming induce melt back is 2.2*10^21 Joules, or about a third of my rough estimate. Please note, because I have estimated conservatively at every step, this is definitely and underestimate of the real value. Also note, this estimate takes into account every single one of the factors Ken Lambert considers important." 1) Could you reconcile the corrected albedo numbers from your post #56 with the above calculation? 2) Where is the purported forcing effect of CO2 taken account in your calculations?
    0 0
  8. 57, Ken,
    Where is the purported forcing effect of CO2 taken account in your calculations?
    What the heck is this supposed to mean? Do you really misunderstand the situation that much, that you can ask a question like this? Or is this just more gamesmanship?
    0 0
  9. Ken Lambert @57: From my 56:
    "Making this adjustment reduces the additional energy absorbed over the summer according to the conservative estimate from 2.2*10^21 to 1.7*10^21 That is still nearly double the 9.25*10^20 which we can expect from the additional forcing as calculated by Flanner over that period. It is still sufficient energy to melt 1.9 million square kilometers of 3 meter thick ice, or 25% of the remaining icecap. And it is still approximately 3 times the energy annual energy influx that Ken Lambert insists, "Therefore the Arctic must absorb less (much less) than the uniformly distributed portion of 6.4E20 Joules/yr." And it is still 17 times greater than the energy which Ken Lambert misrepresents Trenberth as indicating is the maximum absorbed in the arctic."
    Emphasis added. Details of calculation in my 56 and my 54. I have not included in my calculations any of the effect of the original CO2 forcing. As is well known, this has a stronger effect at higher latitudes than as lower, so would tend to reinforce this effect. On the other hand, the water vapour feedback is stronger in the tropics. The strength of neither is relevant to the issue of whether the change in albedo due to arctic ice melt results in sufficient additional energy absorbed to be compatible with Flanner's calculated ice albedo forcing in the Arctic.
    0 0
  10. Tom Curtis #59 I will check your calculations and assumptions myself when I have time. I am intrigued by your admission that: "I have not included in my calculations any of the effect of the original CO2 forcing. As is well known, this has a stronger effect at higher latitudes than as lower, so would tend to reinforce this effect. On the other hand, the water vapour feedback is stronger in the tropics. The strength of neither is relevant to the issue of whether the change in albedo due to arctic ice melt results in sufficient additional energy absorbed to be compatible with Flanner's calculated ice albedo forcing in the Arctic." If that is the case with AG (mainly CO2 effects) excluded from your calculations, then would not Flanner's ice albedo forcing apply to any summer in the Arctic? That would mean this summer, next summer or a summer in the past - 200 years ago for example. Any nominal period of Flanner summers (30 - 50 years?)would eliminate the summer ice permanently. In that case why do we have summer ice in the Arctic at all?
    0 0
  11. 60, Ken, Ummm... what the heck are you talking about? Do you understand the current post at all? Are you really that confused?
    0 0
  12. Ken Lambert @60, I have consistently calculated the effects of the average change of sea ice extent between 1979 and 2010. The following graph from Tamino shows the sea ice area, which is slightly different but exhibits similar changes over time: You will clearly sea that the 2010 sea ice area through the summer months is from two to three million square kilometers less than it was in the late 1970s. On the other hand, every year there is an approximately eight million square kilometer reduction in sea ice area from the maximum around mid March to the minimum around mid September. That eight million square kilometer annual fluctuation drives the annual reduction in sea ice, and the annual reduction in sea ice thickness of about one meter across the whole ice pack. It is the reason the sea ice minimum is in mid-September rather than closer to the peak insolation in mid-July. That effect would have been operating for as long as we have had arctic sea ice, but it cannot lead to a runaway effect because the winter months eliminate the insolation that drives it. In contrast, the 2 million square kilometer additional reduction in sea ice extent since 1979 did not exist before, and is an additional forcing of arctic melt back. As you can see, that additional reduction in sea ice is a new feature, not having been observed before 1950, and not distinguishable from background noise before 1960. You will also note that as the additional melt back is more extensive in summer than in winter, in the past the variation between summer and winter was about half what it is now, with a consequently much reduced summer feedback of the seasonal melt. If you are observant, you will also notice that the two million square kilometer figure I use is very conservative, with the actual figure being close to three million for sea ice area, and four million for sea ice extent (reduction from 1979 only). That is, of course, in keeping with my intention to give you everything you could desire to sustain your theory (which collapses for all that generosity).
    0 0
  13. Tom Curtis #59 "Making this adjustment reduces the additional energy absorbed over the summer according to the conservative estimate from 2.2*10^21 to 1.7*10^21" Run me through how you calculate the 1.7E21 Joules? I notice you keep using the reference date for your sea ice extent as 1978. Forcing is quoted in W/sq.m (power) or Joule/sec-sq.m which introduces the unit of time. The compatible Trenberth unit is E20 Joules/year. You must therefore quantify the ice loss on a per time (annual) basis.
    0 0
    Moderator Response: Later in the same comment (from which you quote) Tom says this: "Emphasis added. Details of calculation in my 56 and my 54."
  14. Tim Curtis #62 Are you going to reply with your calculation?
    0 0
  15. Tom Curtis #62 Moderator: This is from #54 "The average change in sea ice area since 1978 during the summer is a reduction of 2 million square kilometers, or 2*10^12 square meters. That means the average additional energy received in the arctic summer due to global warming induce melt back is 2.2*10^21 Joules, or about a third of my rough estimate." I need to see how Tom Curtis calculated the original 2.2E21 Joules. I see how he got from 2.2 down to 1.7 in #56.
    0 0
  16. In the absence of Tom's workings - I did a quick calculation of heat absorbed in the Arctic each year as follows: The decline in ice volume since 1979 is dramatically illustrated by this PIOMAS graph here: http://www.skepticalscience.com/Chatter_box_March_26_2011.html The trend loss is -3.5E3 km3/decade Which is 3.5E11 m3/year = 3.5E14 kG/year. Latent heat of ice melt is 334kJ/kG, therefore 3.5E14 x 334000 = 1.17E20 Joules/year. This compares with 1E20 Joules/year for the period 2004-08 in Dr Trenberth's energy budget attributable to arctic ice loss.
    0 0
  17. Ken Lambert @66: 1) You forgot to compensate for the lower density of ice, which is 917 kg/m^3 which reduces your figure to 1.07*10^20 Joules per year. 2) You forgot to include loss of ice from the Greenland ice shelf, which is around 250 gigatonnes per year, which requires 0.835*10^20 Joules per year to melt. 3) You forgot the annual average increase in arctic (>80 degrees North) temperatures of 2 degrees over 30 odd years. The area of the increase is 3.8*10^12 m^2, and assuming an average depth of 100 meters warmed, with a specific heat of 3.93 KJ/Kg, represents 4.3*10^20 J per annum. 4) You forgot to include melted permafrost (which I can't quantify). 5) You forgot to include increased heat taken to the ocean depths by the thermo-haline conveyor (which again I can't quantify). 6) You forgot to include reduced seasonal snow cover (which again I can't quantify). 7) You forgot to included any reduction in heat transport from the tropics due to the reduced temperature gradient between tropics and arctic (which again I can't quantify). Once you have factored in all these factors, perhaps then you can make a sensible comparison to Flanner's estimated increase in forcing due to loss of sea ice.
    0 0
  18. Tom Curtis, You are quick to reply to my full and clear calculation Tom, but you have so far failed to show how you calculated the 2.2E21 Joules as I have requested in #64 and #65. I was showing the heat attributable to "Arctic ice loss" and comparing with Dr Trenberth's 1E20 Joules/year number. My quick number only considered ice loss as clearly shown in the calculation and is within 20% of Dr Trenberth's number showing that the ball park is right. Don't try to make it something else. Show me how you got to 2.2E21 Joules in your original calculation at #54. Why can't you show that?
    0 0
  19. Ken Lambert @68, over the last few days I have been busy taking my mother to medical appointments and the emergency ward of a hospital (amongst other things). Forgive me if I did not respond immediately to your request to reiterate what I have already clearly stated in 54 and 56 above.
    0 0
  20. @ Tom Best wishes for your mother's speedy recovery; my prayers are with you both.
    0 0
  21. Ton Curtis #69 Sorry to hear of your mother's illness. I travelled the same path 5 years ago. Your item #3 above is incorrect too. Using your areas and depths, the heat absorbed in warming 3.8E12 m2 of Seawater 100m deep by 2 degC in 30 years is: 3.8E12 (area m2) x 100 (depth m) x 1025 (density in kG/m3)x 3.85E3 (specific heat in J/kG-degC)) x 2 (degrees C) = 2.999E21 Joules. But this is over 30 years - so divide by 30 to get the per annum number. 2.999E21 / 30 = 0.999E20 Joules/year. Close enough to 1.0E20 Joules/year. Your number is 4.3E20 Joules/year - only 4.3 times the actual number.
    0 0
  22. DB @ KL, thanks for your good wishes.
    0 0
  23. Ken Lambert @68, in reviewing my calculations I noticed I did not adjust the atmospheric absorption for my error regarding angles in 54. Rather than pursue that line of calculations, I have recalculated the increase in incoming energy over the arctic summer due to the change in ice area between the early 1980's and the late 2010's. I have proceeded as follows: 1) For each half hour of the 21/5/2011, I calculated the minimum solar altituded at 75 degrees North and 0 degrees East using azimuth and altitude calculator to which you have previously linked. I then compared those values to a selection of values calculated for 20/7/2011 to ensure those of 21/5/2011 are smaller (they are). As previously discussed, these dates are chosen because they lie thirty days on either side of the summer solstice. Thus, for sixty days of the summer, the altitude will be higher than these values, and for the remaining 30 days, not much lower. Taking these values, therefore, represents a conservative estimate of the mean summer values. Having determined the minimum altitude for each half hour, I then rounded down to the nearest whole degree. 2) For each half hour, and using the result of (1), I then calculated the albedo of sea water for water incident at that angle using the Fresnel equations, the effective path length through the atmosphere as a multiple of the height of the atmosphere, and the effective surface area over which light striking one meter squared perpendicular to the light would spread on the surface (in square meters). The later two are calculated using the formula =1/(SIN(RADIANS(D55))), where the radians function converts degrees to radians, and the sin function gives the sine of an angle expressed in radians. 3) Using values for cloud albedo and atmospheric absorption taken from Trenberth's chart (in 54 above), I then calculated incident radiation at the surface in watts/m^2 for each half hour of the day using the formula: I = S * (1-C) * (1-(L*A)/area where I equals the incident radiance, S equals the TSI, C equals the cloud albedo, L equals the path length of the light where the height of the atmosphere = 1, A equals the mean atmospheric absorption , and area equals the area over which light that passes through one square meter perpendicular to the light path at the top of the atmosphere will pass. Where this formula returned a negative value, I used 0. To ensure the value was conservative, I used the TSI at aphelion, which is 1321 W/m^2 {{=IF((($D$52*(1-$G$52)*((1-($I$52*F55))/G55)))<0;0;(($D$52*(1-$G$52)*((1-($I$52*F55))/G55))))}} 3a)As a check against whether this constitutes a conservative estimate, I calculated the mean incident radiation over a day using the above method, which was 127 w/m^2. For comparison the following map shows the annual average surface solar energy including the effects of clouds and atmospheric absorption: As you can see, the average over the whole year including six months of darkness, is nearly 100 w/m^2, so my estimate for the summer months of 127 W/m^2 is certainly conservative. 4) From the half hourly values obtained in (3), I calculated the additional energy absorbed by ocean surface exposed by melting sea ice as the difference between the albedo (0.9) of the sea ice and the albedo of the ocean given the angle of incidence, multiplied by the effective surface radiation (as calculated in 3). Taking the mean of that value, the average additional power absorbed by the ocean is 97 W/m^2. 5) Using that value, I calculate the total additional energy absorbed as 7.57 x 10^8 Joules per meter squared over a notional 90 day summer, or 1.51 x 10^21 Joules over the whole 2 million square km of additional ice cap melted over the period 1979-2011. This is a reduction from my 1.7*10^21 estimate in 56, but is now (at last) error free so far as I can determine, and still a very conservative estimate. So conservative, in fact, that it assumes zero insolation for 9.5 hours of the day in the arctic summer. But it is still a sufficiently large figure to show that you are significantly underestimating the forcing effect of arctic melt back, and that there is no basis from considerations of incoming energy to think Flanner is incorrect about overall forcing.
    0 0
  24. Tom Crtis #73 Did you divide your 1.51E21 Joules by 32 years (1979-2011) to get the annual extra energy absorbed in Joules/year to compare with Dr Trenberth's number of 1E20 Joules/year? If you do that, you get 0.49E20 Joules/year - very conservative but in the ballpark?
    0 0
  25. Ken Lambert @73, during the summer months of 2010, there was (more than) 2 million square kilometers less ice than during equivalent summers thirty years ago. The sunlight falling on water that would have fallen on ice in 2010 did not heat the water over the intervening years. It only heated it in 2010. Therefore there is need to divide the 1.51*10^21 Joules by 32. That is the additional amount of energy each summer that would not have been absorbed except for the reduced sea ice area.
    0 0
  26. Tom Curtis #75 You say: "Therefore there is need to divide the 1.51*10^21 Joules by 32. That is the additional amount of energy each summer that would not have been absorbed except for the reduced sea ice area." That is precisely my point. The annual (or per summer) increase in heat absorbed by your calculation is therefore 0.49E20 Joules/year. This compares with Dr Trenberth's 1E20 Joules/year for Arctic Sea Ice comtribution to the global heat imbalance budget of 145E20 Joules/year (equal to 0.9W/sq.m globally)
    0 0
  27. Ken Lambert @76, if the additional melt had proceeded smoothly over the years (which is not true), then the arctic ocean would have absorbed 4.7*10^19 Joules more in the summer of 80 than in the summer of 79; and 9.4 more Joules in the summer of 81 than in the summer of 79, and so on. However, in the summer of 2010 it absorbed more than 1.51*10^21 joules more than it absorbed in the summer of 79. If you were to calculate the average additional energy flux in the years between 1979 and 2010, the figure would be 7.55*10^20 assuming (incorrectly) an even progression) or perhaps half that given that the loss of summer sea ice extent between the early 1980's and 2006 was only about 1 million square kilometers. That is only 3 to 4 times Trenberth's figure, but Trenberth did not calculate the average amount of energy absorbed in annual (not seasonal) ice melt over 1979, but only over 2004 to mid 2008, over which period there was an average of around 1.8 million square kilometers of additional ice lost relative to 1979. Hence the additional amount of energy absorbed in that period is conservatively estimated as 1.8/2*1.51*10^21 = 1.359*10^21. As it happens, Flanner did his calculations on the average over the same period, so I should probably accept 1.35*10^21 as my conservative estimate rather than the figure I have been using which includes an additional two seasons of extreme ice melt.
    0 0
  28. Ken Lambert @77:
    You say: "Therefore there is need to divide the 1.51*10^21 Joules by 32. That is the additional amount of energy each summer that would not have been absorbed except for the reduced sea ice area." That is precisely my point.
    Sorry, that was a typo. I intended to write, "Therefore there is no need to divide the 1.51*10^21 Joules by 32."
    0 0
  29. Tom Curtis #77, #78 "That is only 3 to 4 times Trenberth's figure, but Trenberth did not calculate the average amount of energy absorbed in annual (not seasonal) ice melt over 1979, but only over 2004 to mid 2008, over which period there was an average of around 1.8 million square kilometers of additional ice lost relative to 1979." That is your error. You are taking the ice melt area 'relative to 1979' which means that you have 30 or 32 years of heat gain (energy) in your calculated number of Joules. A Watt is a Joule/sec so if you use forcings (energy flux) in Watts you must introduce the unit of time. ie Joules/year - which is what Dr Trenberth is calculating.
    0 0
  30. Ken Lambert @79, no I am not - and that is a ridiculous accusation. I have taken a conservative estimate of the difference of ice coverage between circa 1979 and circa 2010. I have taken a conservative estimate of the energy flux in that area measured in Watts per square meter. I have multiplied the energy gain measured in Watts per square meter (= Joules per second per square meter) and multiplied it by 60 (60 seconds in a minute), then by 60 again (60 minutes in an hour), then by 24 (24 hours in a day) and then by 90 (three months at 30 days per month). I have then multiplied by the total area. Now you suggest that 60*60*24*90 Watts is "30 to 32 years of heat gain". Absurd!
    0 0
  31. Tom Curtis #78 - #1 "I have then multiplied by the total area.' Yes, but that is the total area lost relative to 1979. You need to look at the total area in 2010, relative to the total area in 2009 to ascertain the ice lost and the *annual* heat gain. And 2009 relative to 2008, 2008 to 2007 and so on...
    0 0
  32. Ken Lambert @81, if your read the OP about Flanner, you will sea that, "A new paper by Flanner et al in Nature Geosciences tries to estimate the so called ‘cryosphere albedo feedback’ since 1979." (My emphasis.) It's right there in the first sentence. Therefore if we want to do a plausibility check on Flanner (which is technically what this exercise is), we need to compare the change in summer incoming energy flux from 1979 to 2008. That is, by a very conservative approximation, 1.35*10^21 Joules. If we extent the comparison period to 2010, the change is 1.51*10^21 Joules, again very conservatively estimated. What is more, even the original post by Sphaerica from which this debate sprung is clearly considering the change in arctic forcing between the 1978-2000 average and the present, ie, effectively 2010. So why you should suddenly be interested in the mean annual change in the change in the ice albedo forcing during the Arctic summer rather than, as we have been discussing, the mean annual change in the ice albedo forcing during the arctic summer is almost entirely mystifying. It does not even make much sense as mere passing curiousity. After all, as revealed by Piomas, the total ice volume has not been recovering each winter. The Ice does not need to melt back from the March of 1979 position each year. Therefore the change of the change is not a predictor of how extensive the ice melt will be each summer. This is a genuine feedback situation, with each summers melt making each successive summer's melt easier, and likely to be more extensive. (Note, likely, not guaranteed - there are other factors here.)
    0 0
  33. Nice try Tom, You are forgetting that if we look at Dr Trenberth's 0.9E20 Joules/year (rounded up to 1E20 Joules in his Table) based on the 2004-08 period, and assume the same rate of heat energy accumulation for 31 years (1979 - 2010) then you will get 28E20 Joules as the total energy absorbed. And that is for sea ice melt alone. In the same 31 year period you are calculating 15.1E20 Joules - roughly half the Trenberth cumulative figure. In that period (31 years) assuming that Trenberth's global imbalance was something between 0.5 and 0.9W/sq.m (say 0.7W/sq.m average) or 112E20 Joules/year for 31 years, then the Earth would have accumulated 31 x 112 = 3472E20 Joules of extra heat energy. Your number of 15.1/3472 = 0.004 which is 0.4% of the Earth's uptake, and Trenberth's number 28/3472 = 0.008 or 0.8% of the total Earth's uptake in 31 years. This makes my original point quite well. The 4.4% of the globe surface above the Arctic circle actually accounts for 0.4% to 0.8% of the global heat energy imbalance absorbed based on your and Trenberth's figures.
    0 0
  34. Ken Lambert @83, if you multiply the TSI measured in Watts/meter squared by a number of factors representing atmospheric absorption, cloud and surface albedo, atmospheric absorption, and the extended surface covered by the incoming light due to the low angle of incidence; then further multiply by time factors of 60 and 60 and 24 and 90, it is not mathematically possible that what you have calculated is the cumulative energy flux over thirty years. And lest there be any doubt over what time period the incoming energy has been calculated, here is the relevant formula from my spread sheet, which calculates the energy input per meter squared from effective change in radiance absorbed by the surface as a result of sea ice melt: =I105*60*60*24*90 Put in the simplest terms, 60*60*24*90 =/= 60*60*24*365.25*32; 11688 does not equal 90. Nor is it a possible mathematical confusion that they are the same. I perfectly understand that you are getting desperate, defending as you are, the in defensible. But resorting to such ridiculous tactics as pretending to the confusion you apparently espouse only succeeds in making you look the complete fool. At this stage I cannot be any clearer about my method. As this is already a repeat of this information, there can be no basis for your confusion other than a pointless rhetorical strategy. Should you persist in this ( -snip- ) strategy, I will request that the moderators take notice of your obvious trolling.
    0 0
    Moderator Response:

    [Dikran Marsupial] Bold tags (hopefully) fixed.

    [DB] Inflammatory term snipped.

  35. Tom Curtis #84 "I perfectly understand that you are getting desperate, defending as you are, the in defensible. But resorting to such ridiculous tactics as pretending to the confusion you apparently espouse only succeeds in making you look the complete fool." and "Should you persist in this ( -snip- ) strategy, I will request that the moderators take notice of your obvious trolling." ( -Snip- ) If Moderator DM knows anything about the subject - he will no doubt inform you of that - I simply can't get through to you.
    0 0
    Moderator Response: [DB] Personal remarks snipped.
  36. KL @85, plainly we are at an impasse. I have answered all your objections, and it would pay you to reread attentively what I have written in 77 above (which deals completely with all that is valid in your current objection). Failing that, I have nothing more to say to you. I will no longer feed the troll.
    0 0
  37. Tom, just read this aghain and see if you can understand it. The numbers are form Dr Trenberth's papers. "In the same 31 year period you are calculating 15.1E20 Joules - roughly half the Trenberth cumulative figure. In that period (31 years) assuming that Trenberth's global imbalance was something between 0.5 and 0.9W/sq.m (say 0.7W/sq.m average) or 112E20 Joules/year for 31 years, then the Earth would have accumulated 31 x 112 = 3472E20 Joules of extra heat energy."
    0 0
  38. Ken Lambert @87, Just one last time: Taking the data on historical sea ice extent I listed the summer sea ice extent from 1979 to 2008 (the limit of the data). I then took the difference between the 1979 extent and that of each year, and used it to calculate the difference in summer incoming energy flux between that year and 1979. From this, I determined both the average over the period, and the cumulative total for the period, but by summing the values, and by multiplying the mean by 30. The results: Mean difference between 1979 and target year: 0.445 million km^2 Mean additional energy flux compared to 1979: 3.37*10^20 Joules cumulative additional energy flux compared to 1979: 1.01*10^22 Joules Mean additional energy flux for the 2004-2008 mean compared to to 1979: 1.39*10^21 Joules cumulative additional energy flux for the 2004-2008 mean compared to 1979: 6.97*10^21 Joules. Very clearly from your calculation, the value you determine in the quoted section of 87 is the cumulative additional energy in ice melt over the period 1979-2010. That is comparable to the cumulative additional energy flux compared to 1979, or 1.01*10^22 Joules. In contrast, the 1.51*10^21 Joule figure I calculated is comparable to the Mean additional energy flux for the 2004-2008 mean compared to to 1979, or 1.39*10^21 Joules. It differs slightly because it is calculated for an approximate average of the years 2006-2010 rather than 2004-2010, and also because it is compared to an approximate average of 1979-2003 (which has slightly more ice than 1979 itself). I do not know how I could possibly be clearer than I have been in this post. Therefore if you persist with the absurdity that the difference in energy flux over a season is the difference in energy flux over 32 years, there is no further basis for debate between us.
    0 0
  39. You are getting closer to the Trenberth ice melt figure Tom, so that is a result of sorts. Good to see you multiplying yearly numbers by 30 to get a cumulative result. Trenberth's ice melt figure is 28E20 Joules of accumulated heat in the Arctic in 31 years. This gets somewhere near your number of ""cumulative additional energy flux for the 2004-2008 mean compared to 1979: 6.97*10^21 Joules."" ie 69.7E20 Joules. Let's average the two numbers to get some mean figure halfway between your and Trenberth's number ie: (28 + 70)/2 = 49E20 Joules in 31 years. The rough estimate of extra heat energy the Earth would have accumulated in 31 years of purported AGW is 31 x 112 = 3472E20 Joules. Therefore 49/3472 = 0.014 or 1.4% of the total warming from the Arctic which is 3% to 4.4% of the Earth's surface (depending on which latitude circle you wish - 75 deg or 66 deg). Even if you **double** the number to about 100E20 Joules for inside the Arctic circle at 66 degrees N, the proportion is still only 2.8% of accumulated heat from 4.4% of the Earths surface area. Seems like the warming problem is somewhere else.
    0 0
  40. Ken Lambert @89: First, the energy required for Arctic sea ice melt is not the only form in which energy has accumulated in the Arctic. Your persistence in treating it as though it were only underlines how desperate you are to deflate the figures beyond all reason. Second, the appropriate comparison for determining the significance of arctic sea ice melt as a forcing mechanism is between Flanner's calculated forcing which, adjusted for the relevant temperature increase, is NH forcing * temperature increase since 1979-1983 *0.5 (to average globally, or 0.63*0.43*0.5 = 0.135 W/m^2. Of that, just over half is due to snow melt, and just under half, say 0.06 W/m^2 is due to sea ice melt, or 6.7% of the total globally averaged forcing. Note, that is not the total arctic forcing, but only that due to sea ice melt. This comparison is particularly appropriate as both studies consider the same time frame. Third, even more informative is if you consider the rate at which the sea ice albedo is increasing. Over the 30 years from 1979 to 2008, the increase in incoming flux absorbed by the Arctic ocean due to additional sea melt has been increasing by 15% per year. If this continues, as seems likely, in ten years the arctic ice albedo feedback will add an additional 0.18 Watts/meter^2 or 20% to globally averaged energy imbalance. It is not likely to get much larger than that because it will run out of pole to melt. (Snow albedo will continue to drive increases in feedbacks for sometime, however.) However, that is a substantial effect and represents a substantial increase in warming rates above model predictions.
    0 0
  41. You still don't get it Tom. The Arctic cannot absorb any more heat than falls upon it at its Sun angles of incidence and minimum albedo. Let us assume that there is NO summer Arctic ice at all. Unless heat is transported to the Arctic from elsewhere on the planet, the 4.4% of the Earth's surface cannot absorb more heat than any 4.4% patch of open ocean at a lower ice free latitude. I doubled an average cumulative number to 100E20 Joules which is in close agreement with your maximum number viz "That is comparable to the cumulative additional energy flux compared to 1979, or 1.01*10^22 Joules." That is 101E20 Joules. Even at that level to rephrase my prior point: "Even if you **double** the number to about 100E20 Joules for inside the Arctic circle at 66 degrees N, the proportion is still only 2.8% of accumulated heat from 4.4% of the Earths surface area over the last 31 years of official AGW"
    0 0
  42. Ken, "Unless heat is transported to the Arctic from elsewhere on the planet ..." Until the last couple of decades, this was the *only* way for heat to affect the Arctic substantially - it's the major source of the heat that has melted the ice so far.
    0 0
  43. 91, Ken Lambert, Sunlight reaching the surface of the earth equates to about an average of 184 W/m2. For 4.4% of the earth's surface, this equates to 184 * .044 = 8.096 W/m2. If the albedo change is from ice (.9 albedo) to open water (.1 albedo), or a change in absorption of 0.8, then 8.096 W/m2 * 0.8 = 6.4768 W/m2. If this change only applies to 3 months out of the year (1/4), that's 6.4768 W/m2 / 4 = 1.6192 W/m2. This does not multiply the number by any factor to account for the fact that the area is under 20-24 hours of high-incidence insolation per day. A forcing of 1.6192 W/m2 is close to one half of the 3.7 W/m2 forcing caused directly by CO2, which would itself cause 1˚C of climate change, and a total of 3˚C with feedbacks. Since those same feedbacks operate regardless of the forcing, we can assume a warming rate of 3˚C / 3.7 W/m2. For our high conservative estimate of 1.6192 W/m2, this translates to an additional warming of 1.3˚C. One could argue that the change in albedo from sea ice (.7 albedo) to open water would be only 0.6, and that the entire Arctic will never (?) melt for an entire 3 month span, so let's make another estimate of only 3% of the earth's surface, and an albedo change of only 0.6, giving 184 W/m2 * 0.03 (%surface) * 0.6 albedo * (1/4 yr) * 3˚C / 3.7 W/m2 = 0.67˚C So with a very conservative estimate, 0.67˚C is still very far from inconsequential when it is being added to other warming that is already at dangerous levels. [Admittedly, this is sort of double counting, since this feedback is already included in the estimated 3˚C of warming from the original 3.7 W/m2 of doubled CO2 forcing. But the point is still the same. This value is not insignificant.] Oh, and please certainly check my math, and my logic. I certainly could have made an error in there.
    0 0
  44. Adelady If that be the case then you have missed the point of this whole exchange between Tom Curtis and me. It is about the extra heat absorbed from the Sun in the Arctic due to decreased albedo from reduced ice coverage. Heat transported from elsewhere is an internal effect - not an external forcing. ie. it is warmer in the Arctic but cooler where the heat originated giving no net overall warming.
    0 0
  45. sphaerica According to #73 the Arctic averages about 50 W/sq.m so you had better start by dividing everything by 3.
    0 0
  46. Ken Lambert @95, the annual average for the arctic is indeed just over 50 w/m^2, so Sphaerica ought indeed to divide by three. But then he ought also to multiply by four to eliminate the seasonal parameter he introduced, seeing as how he would be using an annual average. Why is it, I wonder, that you never notice errors or adjustments that favour your argument, but always notice any regardless of their merit, that are not favourable to your argument?
    0 0
  47. Ken Lambert @91, in fact I do "get it", but you continue to ignore the relevant facts which allow me to get more than you will allow yourself to understand. Consider the cumulative incoming additional energy flux from ice albedo effects relative to 1979 for successive five year periods from 1979 to 2008: 1979-1983: -7.40E+020 Joules 1984-1988: -4.18E+020 Joules 1989-1993: 8.24E+020 Joules 1994-1998: 1.41E+021 Joules 1999-2003: 2.06E+021 Joules 2004-2008: 6.97E+021 Joules If you pay attention you will notice that for the first 10 years, the value is negative. In fact, for eleven of the first eighteen years between 1979 and 2008, the ice albedo effect was a negative feedback relative to 1979 levels (though a positive feedback if compared to 1950 levels). The reason for this is that 1979 set a new record for summer minimum ice extent, so natural variation took the ice extent above that record in a significant number of the following years. The most important consequence of that for this debate is that the cumulative increase in incoming flux relative to 1979 levels (ie, your chosen comparison period) does not become positive until 1995. In other words, the doubled figure which will only be "...2.8% of accumulated heat from 4.4% of the Earths surface area over the last 31 years of official AGW" will in fact only be accumulated energy over something less than 16 years. Further more, for most of those 16 years, the change in the summer accumulated energy flux was only small, with a 6*10^20 Joule increase in the 5 year accumulation. But the last five year period shows a 4.91*10^21 increase over the preceding years. That is nearly half the accumulated value for the thirty years in just the last five years! In fact 2007 alone accumulated more energy (2.54E+021 Joules) than any five year interval ending prior to 2005, and indeed, more than the 10 years from 1989-1998. 2008 (2.05E+021 Joules) is not far behind, and accumulated just 0.5% less energy than the five years from 1999-2003. Clearly the ice albedo effect was not such a big deal 20 odd years ago, but then again, nobody said it was. It is a big deal now. Thirty years accumulation at the average rate of the five years from 2004-2008 would accumulate 4.182*10^22 Joules. By your calculation that you say I don't get, that means it would constitute 5.6% of the Earth's accumulated energy. And that is with a figure very conservatively estimated, which ignores the additional energy gain in any season outside of summer, and in which three years of the five year average come from before the drastic 2007 reduction in summer sea ice. So what I get, but you plainly do not is that the ice albedo effect has gone from "ho hum" 15 years ago to a game breaker today. No matter what contortions you try, and no matter how much you want to include the low values of 30 years ago in your comparisons to mask the high values today, I will not forget this fact. And as clearly indicated in my point three @90 above, all indications indicate that it is going to get worse. In ten years time the ice albedo effect is likely to add 0.18 Watts/meter squared to the global energy imbalance (bringing its total effect relative to 1979 up to 0.24 Watts/meter squared. At that point, the 4.4% of the Earth you think is so trivial will be causing 22% of the total global warming. And that is significant.
    0 0
  48. 95, Ken, As Tom already pointed out, the annual average insolation in the Arctic is greatly influenced by the seasons, such as the 24 hour long sunless days through most of the winter. As I already said, the season we're talking about is at peak insolation when hours of daylight would be higher. Using the annual average is clearly wrong. This is a fairly obvious factor, and demonstrates a distinct lack of thought on your part. I also already used very conservative numbers for many other items, such as the change in albedo. Again, the impact to the climate of increasing summer Arctic ice melt will be anywhere from 0.67˚C to 1.3˚C. All other arguments are moot unless I've made a (real) mistake in my calculations. The question at hand has been whether or not the melting of summer ice in the Arctic will have any impact on climate. The proposal was that the increased positive albedo feedback would be significant. The argument was that the Arctic only covers 4.4% of the globe, so the feedback cannot be significant. The numbers show that the positive feedback is more than merely significant, but downright scary. Case closed.
    0 0
  49. @Sphaerica #93 You are doing it the same style as with RW1 in other posts. Don't provide your own calculation. I know that you are making a personal effort to help those people to understand, but they simply don't want to understand and the final result is negative. They present their own calculations and considerations, they tend to be more tight when they are criticizing one obvious mistake in the rival's, they tend to be sloppy when they have to introduce "their evidence" to contrast the post or the so-called "climate science". I mean they need all those numbers to pluck everything opposing their intended conclusions. The technique that Ken Lambert has used here is much more coarse and by following the path he proposes you are helping him to disguise his technique which includes criticism developed in the fringes of a reality-check calculation on part of one of the chosen rivals, taking what can be played down and/or declare a personal achievement(A), declaring the results out of scope or negligible (B) and distorting the line of argumentation just to jump to their chosen playfield using a variety of sub-techniques such as, but not limited to, telling that the rivals don't know what their talking about(C), affirming the they have the *real* (*=little cherubims) epistemological path to a proper answer -the twist starts there- (D) to finally -by using verbal lidocaine or the technique rod fishers use to wear out a fish- throwing a subdued admonition that point to dismiss methods and morals of the rival and start his own song starting with "I" (E) (Examples here) Sphaerica, this technique is not counteracted by an endless exchange of comments where one part continue to do bonafide calculations and reasonings and the other just try to constantly sneak their technique. You may think that you are doing well, and that can be true, but look what you are talking about and you will find that you where brought to a terrain chosen by them. The fact is that we'll probably have a couple of troubling months in front of us, as Washington & Cooke's book will be soon released and the publicity, be it little or be it huge, will drive here a lot of infuriated "skeptics" that will subscribe in dozens and attack in pack, so the episodes involving some Paul these days will be ten-folded. Those people will be counting on the toes and fros that I'm criticizing and you might be providing a culture medium if you and others spread to thin and continue to use reality checks as front row science and disregard counteracting the technique they use. Not only it is a huge waste of effort but it also promotes the idea of a sloppy climate science, exactly what the (so-called) "skeptics" pretend. From here: "I am glad your calculation agrees with mine that the effect of arctic ice melt is trivial (2.8% increase in arctic forcings since 1978)". A "What about the effects on the other 95.6% of the Earth's surface, like the 70% occupied by the oceans where we still can't find the absorbed heat". B From here: "What is your point in calculating the incoming and ignoring the outgoing?" C "Surely the whole discussion of AGW is about the *net* warming effects. One might as well suggest that we only look at possible changes incoming flux on *any* part of the Earth, while ignoring the changes in outgoing flux". D ("outgoing flux" and "cellar door", don't they sound charming?) From here: "Tom, wilfully leaving out relevant information of which you are aware simply is a distortion of the case to suit a particular bias". E
    0 0
  50. 93, Alec Cowan,
    I know that you are making a personal effort to help those people to understand...
    Actually, no, not really. I mean, if a light bulb happens to go off over their head, fine, but no, that's not the point. I know the odds are one in a billion (and what I mostly want to do with someone like RW1 is to at least get him to stop posting his own gibberish and confusing others). I post comments mostly for the lurkers, for the thousands of people who only read and don't post comments. Some of those are as close-minded as the person posting (Ken, RW1), and out of reach. Some have made up their minds, but aren't as close-minded as it seems, and when the light goes on for them, even if it only plants the seed of doubt in their own position, something has been accomplished. Others are more on the fence, or even trusting of the science, but can begin to doubt the science if the trickery and distractions aren't laid bare for them. I well remember the days when I myself was mislead by "skeptic" arguments, and it took a lot of work and hours (by me) to realize that they were all smoke and mirrors. So I see nothing wrong with being up front, providing calculations, admitting to errors when I make them, and letting a conversation drag on for way, way longer than it should (a la RW1), because the point is not to "win the argument." The point is, instead, to demonstrate fallacious arguments, unsubstantiated claims, and an obstinate unwillingness to think and reason, although not to the person posting, but rather to others who are reading both sides of the debate. People with arbitrary or incoherent positions don't have to "admit defeat" to be exposed.
    0 0

Prev  1  2  3  4  Next

You need to be logged in to post a comment. Login via the left margin or if you're new, register here.


The Consensus Project Website

THE ESCALATOR

(free to republish)


© Copyright 2024 John Cook
Home | Translations | About Us | Privacy | Contact Us