Climate Science Glossary

Term Lookup

Enter a term in the search box to find its definition.

Settings

Use the controls in the far right panel to increase or decrease the number of terms automatically displayed (or to completely turn that feature off).

Term Lookup

Settings


All IPCC definitions taken from Climate Change 2007: The Physical Science Basis. Working Group I Contribution to the Fourth Assessment Report of the Intergovernmental Panel on Climate Change, Annex I, Glossary, pp. 941-954. Cambridge University Press.

Home Arguments Software Resources Comments The Consensus Project Translations About Support

Bluesky Facebook LinkedIn Mastodon MeWe

Twitter YouTube RSS Posts RSS Comments Email Subscribe


Climate's changed before
It's the sun
It's not bad
There is no consensus
It's cooling
Models are unreliable
Temp record is unreliable
Animals and plants can adapt
It hasn't warmed since 1998
Antarctica is gaining ice
View All Arguments...


Username
Password
New? Register here
Forgot your password?

Latest Posts

Archives

Sea Level Hockey Stick

Posted on 23 June 2011 by dana1981

A paper recently published in the Proceedings of the National Academy of Sciences by Kemp et al. (2011) has assembled new sea level reconstructions for the past 2,100 years based on sediment from the US Atlantic coast. They found that recent sea level rise is the fastest over the last 2100 years:

Kemp et al. sea level data

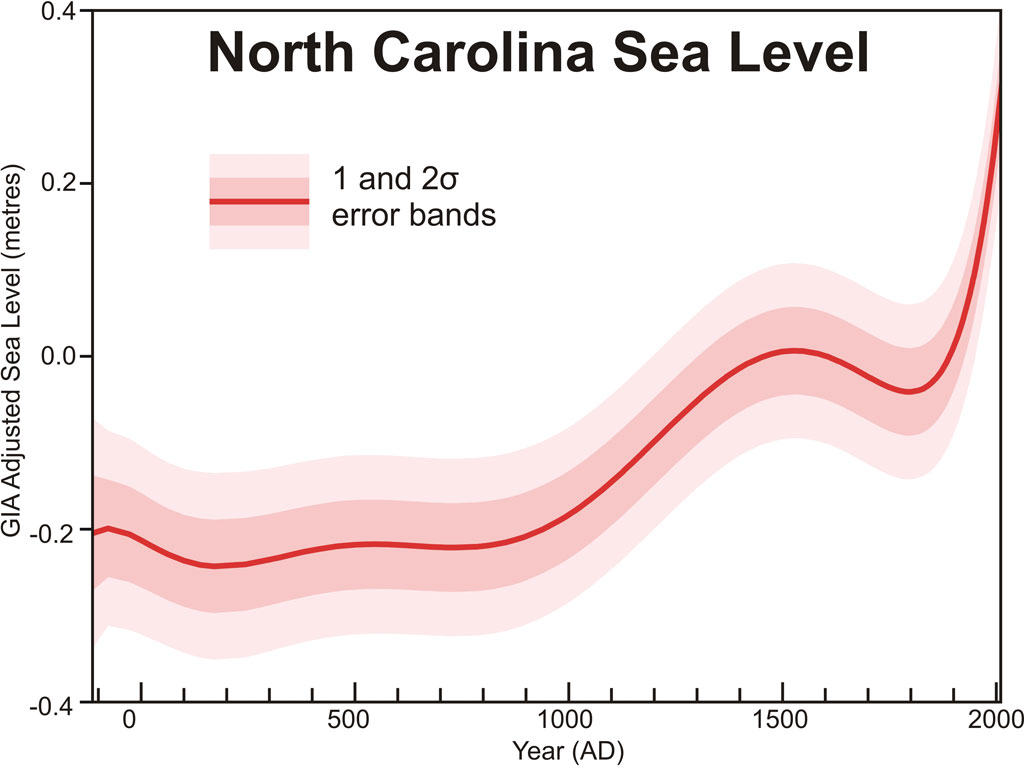
Figure 1: Sea level reconstruction by Kemp et al. (2011) using sediment from salt marshes in North Carolina.  This figure has also been added to the high resolution graphics page.

Among the co-authors of this paper are some heavy hitters in climate research: Michael Mann, Martin Vermeer, and Stefan Rahmstorf.  The reconstruction is based on microfossils of foraminifera found in sediment from the US Atlantic coast."  Rahmstorf explains the study methodology at RealClimate.  The authors summarize their findings:

"Sea level was stable from at least BC 100 until AD 950. Sea level then increased for 400 y at a rate of 0.6 mm/y, followed by a further period of stable, or slightly falling, sea level that persisted until the late 19th century. Since then, sea level has risen at an average rate of 2.1 mm/y, representing the steepest century-scale increase of the past two millennia. This rate was initiated between AD 1865 and 1892. Using an extended semiempirical modeling approach, we show that these sea-level changes are consistent with global temperature for at least the past millennium."

In short, there was little change in their sea level reconstruction from 100 BC to 950 AD.  During the Medieval Warm Period and a bit beyond, sea level rose, as one would expect.  Into the Little Ice Age, sea level fell slightly, until just over a century ago, when sea level rise began to accelerate rapidly.  Rahmstorf, Vermeer, and Mann used a semi-empirical model to analyze the connection of the sea level data with climate, essentially assuming that the hotter it gets, the faster sea level rises.  Rahmstorf describes their conclusions:

"According to this model, the rise after about 1000 AD is due to the warm medieval temperatures and the stable sea level after 1400 AD is a consequence of the cooler “Little Ice Age” period. Then follows a steep rise associated with modern global warming. Modern tide gauge and satellite measurements indicate that sea level rise has accelerated further within the 20th Century."

"...the model fit to the new proxy data is highly consistent with the fit we obtained in 2009 to the tide gauge data. Hence it implies almost the same future projections as in our 2009 paper (75-190 cm by 2100)."

The authors note that their reconstruction is consistent with local tide gauge measurements, and also compared the North Carolina results to data gathered from nearby Massachusetts:

"The Massachusetts data agree with the North Carolina reconstruction, except for higher sea level between AD 700 and 1000 (although the uncertainty ranges overlap)."

And they compared their results to a number of other sea level reconstructions (Figure 2).

"For North Carolina, we estimate that the deviation in sea-level rise from the global mean due to ocean circulation changes is between 0 and +5 cm. This estimate was based on the IPCC AR4 model ensemble for a 21st century global warming of ∼3°C, in which sea level rises globally by 22–48 cm."

"IPCC AR4 showed that local sea-level trends differed by up to 2 mm/y from the global mean over AD 1955–2003, which implies deviations of up to ±10 cm at some locations (but ±5 cm along most coastlines) as the sum of forced and unforced effects.  This analysis suggests that our data can be expected to track global mean sea level within about ±10 cm over the past two millennia, within the uncertainty band shown for our analysis."


Kemp comparisons

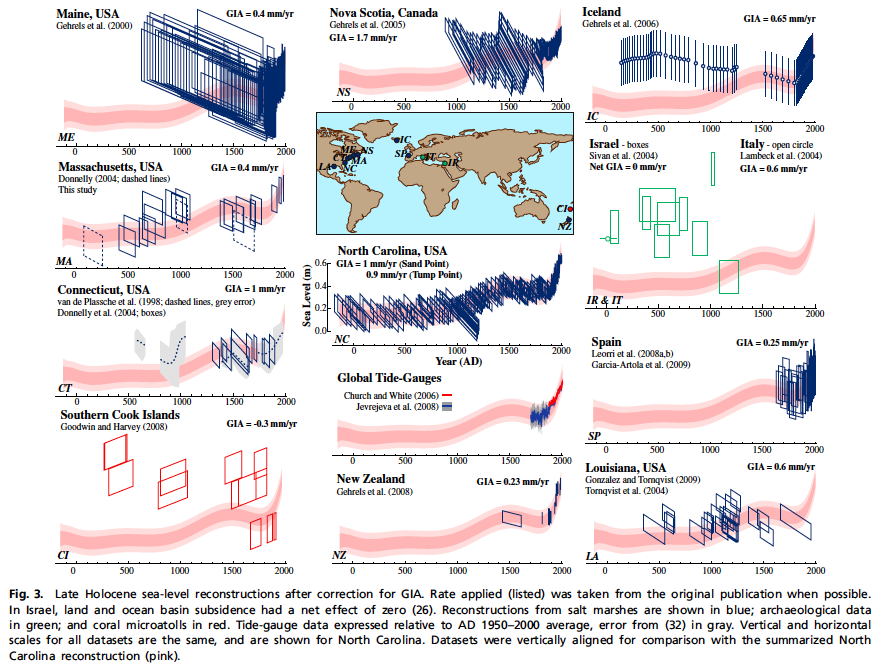
Figure 2: Comparison of various sea level reconstructions to Kemp et al. (2011).  The study's North Carolina reconstruction is shown in pink in every panel, and the other reconstructions for comparison are shown in blue, green, or red.

This sea level reconstruction is yet another member of the ever-growing hockey team (see other members here, here, and here) supporting the conclusion that the current rate of warming is greater than at any other time in the past two millenia.

0 0

Printable Version  |  Link to this page

Comments

Prev  1  2  3  Next

Comments 51 to 100 out of 131:

  1. #50, What is so bizarre about that? The ocean basins themselves must be shrinking because of the enormous amount of eroded material that is transported daily into the oceans by all major rivers. So the question is valid. The volume of the silt should be compared to the volume of melted glaciers, before we call the idea bizarre, but who can find the figures?
    0 0
    Response:

    [DB] Argus, is this a Poe?

  2. While Rahmstorf is convinced that his findings represent global changes, Schroter and Latif are not. http://www.spiegel.de/international/world/0,1518,769687,00.html
    0 0
    Response:

    [DB] Perhaps in your quote-mining efforts you could read Latif's whole quote:

    Satellite images offer proof, though, that sea levels have risen significantly in recent decades. And this development occurred exactly at the same time as industrialization and the rise in air temperature.  It would be "hard to argue" that that could be accidental, Latif says, thus siding with Rahmstorf.

    Emphasis added.

  3. Are you countering with your own quote mining? Recent decades is a far cry from 2000 years. "What happened in time periods of 300 and 400 years is highly contentious," No emphasis needed.
    0 0
    Response:

    [DB] You continue to twist Latif's comments out of context to fulfill your goal of fostering doubt by conflating dissent over minutia into broad overall disagreement.  Latif in the article clearly agrees with Rahmstorf for the overall period of the study (calling it a strength) and that the blade of the SLR hockey stick is not accidental.  Latif and Rahmstorf differ in interpretation of details: that's science. 

    Schröter, OTOH, is arguing for a presence of continental drift being a player over the 2000 period of the study without presenting supportive evidence.

    At least you are consistent with your narrative.

  4. Here we have a paper that has used tidal gauge observations on sea level rise. Its findings are supported by previous papers used as references: tidal gauge observations
    0 0
  5. Shorter Camburn @54, "Look, Squirrel!!". EricR @53, come on, you misrepresented Latif. Maybe it was unintentional, but please do not try and detract from that. And then you add another quote to try and float another red herring..."Look squirrel!".
    0 0
  6. Curiously, mispresenting Latif seems to be habit forming. Readers are advised to take all future posts concerning Latif with a very large grain of sea salt.
    0 0
  7. From Camburn's link in 54: "The current sea level trend of about 1.7 mm/y" The current sea level trend is about 3 mm/y. The trend has increased over the 20th century; you can't just use the 20th century average without taking the acceleration into account.
    0 0
  8. #51, Thanks for the link to Poe's law, I didn't know about that! I suppose you are sarcastic, but I simply wanted to compare the effects of erosion and melting on the sea level. "From the Yellow River, over 1.6 billion tons of sediment flows into the ocean each year." (en.wikipedia.org) "552 billion tons lost from the Greenland ice sheet in 2007." (answers.com) "In fluid mechanics, displacement occurs when an object is immersed in a fluid, pushing it out of the way and taking its place." (en.wikipedia.org) So, 1.6 billion tons of sediment from one river. What could be the total amount in the world? 160 billion tons maybe? It would replace about 50 billion tons of sea water. It would still be considerably less than the water from Greenland ice, but at least it is in the same league. I welcome better figures and better calculations!
    0 0
    Response:

    [DB] Having been Poe'd before, I was genuinely curious.

    Dunno about that answers.com number you quote.  Greenland ice mass loss increased from some 200+ billion tons in 2009 to about 600 billion tons in 2010.  See here.  And that is only part of the glacial melt picture every year.

  9. Archemeaies will be turning in his bathtub :(
    0 0
  10. Argus - Keep in mind that sediment, being essentially ground rocks, will have a much higher density than water; therefore it will require much more sediment than water to equal the same volume. Sedimentation may have increased due to anthropogenic activities (farmland erosion). I don't know how those numbers, though. However, I will note that contrary to increased erosion via land use, waterway control aka levees, damns, etc., have reduced the sedimentation levels at river deltas around the world. This is part of the water problems in New Orleans - which is really sad, I love that city. Waterway control has reduced delta deposition over the last century or so, causing increased subsidence of the delta around New Orleans and increased storm risk. Alexandria in Egypt has some of the same issues. This reduction in river sedimentation should decrease the rate of sea level rise. But I wouldn't claim strong changes in either direction without more data.
    0 0
  11. Argus@51, good question: According to this Skeptical Science blog post the world's rivers are dumping 28 billion tonnes of sediment into the ocean, which is about five percent of the weight lost by melting Greenland ice . Remember that the sediment has a grain density of about 2.5 times that of water, so the volume it displaces is only about 2 percent of the volume added to the oceans by Greenland ice melt. A significant fraction of the world's water is stored in man-made reservoirs, which, according to this newspaper article, has reduced sea-level rise by 30 millimetres. Considerable sediment is also being held back by dams, which diminishes the amount getting to the sea.
    0 0
  12. Good info well found Andy S. So the upshot of it is that the volume of water increase through melting / thermal expansion is at least two order of magnitude greater than the volume decrease through sedimentation. I think we can safely say that sea level rise is not an artefact of sedimentation changes...
    0 0
  13. Argus, This really isn't worth the time it takes to type it, but if sedimentation were any factor in sea level rise, it would be an ongoing one, uninterrupted from the beginning of time. You'd see a steady sea level rise throughout all of recorded history. Or do you have some reason to believe that climate change accelerates sedimentation?
    0 0
  14. From RealClimate's post on the paper: "These data are valid for North Carolina, where they are also in agreement with a local tide gauge (green)(Fig. 2 in the paper). But they also agree with another proxy data set from Massachusetts. Sea level changes along the US Atlantic coast do not need to fully coincide with global mean sea level, however. Even though the level rises uniformly if I fill water into my bath tub, the ocean has a number of mechanisms by which local sea level can deviate from global sea level. One of these mechanisms can also occur in the tub: the water can “slosh around”, in the oceans on multidecadal time scales. And there are some other factors as well, like changing ocean currents or changes in the gravitational field (due to melting continental ice). In the paper these factors are estimated and it is concluded that the North Carolina curve should be within about 10 cm of global mean sea level." Also, Stefan (an author on the paper) writes this in reply to this comment: "[Response: That is discussed in great detail in the paper, but also in the post above. We estimate that the NC data should track the global mean sea level to within +/- 10 cm (on the time scales we resolve), and so far nobody has challenged this estimate. Specifically, Jens Schröter, quoted in the Spiegel article, has confirmed to me that he also finds this a reasonable estimate. -Stefan] [My bolding]
    0 0
  15. 62, skywatcher, Yes, but you have not yet proven that fish are not simply getting fatter (and so displacing more water), no doubt a result of all of the greenie fishing restrictions being placed on the poor, struggling fishermen throughout the world. If scientists would just study this, they'd certainly see that climate change has nothing to do with rising sea levels. It is, in fact, fatter fish which in turn displace more water, and this is, in turn, due to a chronic under-fishing problem which should be corrected immediately, before the problem reaches catastrophic proportions.
    0 0
  16. Also note that sediment loading depresses the crust.
    0 0
  17. Sphaerica, from what I have read about fish and fish stocks (both getting smaller - which would probably also impinge on fish-stock used in cooking, but that's going too far off-topic), the so-called skeptics would have a hard time trying to claim that fish are actually getting fatter and displacing more water, thereby causing sea-level rise - and a rise in seal levels too, obviously, who would also get fatter and displace even more water ! But I won't hold my breath.
    0 0
  18. 67, JMurphy, But you are forgetting the positive feedback, whereby the increased gravitational pull of the fattened fish has drawn the moon closer to the earth in its orbit. This, in turn, increases the tidal forces of the moon on the oceans, which accounts for the supposed "reduced fish population" paradox (as it is called in the literature). No, I'm afraid you're going to have to do better, if you want to refute the Ichthyan Displacement Anomaly theory of sea level rise.
    0 0
  19. #65 Sphaerica, maybe some of your distant relatives, the deep sea benthic Gromia sphaerica have been getting much fatter in recent years and displacing more water. Can't rule it out, right? We'd best do some serious sphaerica harvesting before sea levels flood the major cities. :) I'll get me coat...
    0 0
  20. Argus @58, over the geological long term, sediment is carried back out of the ocean either by subduction or by uplift which has turned former marine deposits into the Alps (for example). If it where not, over the long term the continents would have entirely disappeared under the sea by erosion, whereas over the 600 million years for which it can be determined they have remained approximately constant in total area (although having drifted around significantly, and formed a super continent twice). The survival of continents shows that over the long term net displacement of water by geological processes including erosion is zero. Having said that, the net displacement over any short period (ie, several millions of years) could be either slightly positive or negative. Currently Africa is moving north replacing shallow Mediterranian water with deep Antarctic Ocean water. Australia is also moving North, replacing shallow water with deep water. India continues to move North, enlarging the Indian Ocean, and I believe that South American continues to move towards North America, collapsing the the Caribbean. Meanwhile the Horn of Africa is separating from Africa, thus reducing the Indian Ocean. All these motions are at a rate of mm per year, but because of the large shorelines involved, all would result a greater displacement of sea water then the net displacement by sedimentation and subduction. What is the net effect? I don't know except that given historical sea water stands (ancient beaches etc) it is very close to zero, and well within the error bars of Kemp et al.
    0 0
  21. DB #48 "[DB] Your final linked graphic you have posted here repeatedly. And just as repeatedly, it has been pointed out the issues with conflating regional data to global data" Surely quotation of the North Carolina Sea Level which is the subject of this thread is also a case of "conflating regional data to global data".
    0 0
  22. While there is no doubt that sea level is rising, isn’t production of a hockey stick more dependent on the scale shown on the graph than the speed of SLR? As President Reagan noted “You aint seen nothing yet!” Just wait until the melting of polar ice sheets really gets underway. On 22 June the ABC reported http://mpegmedia.abc.net.au/rn/podcast/2011/06/bst_20110622_0636.mp3 temperatures in northern Greenland reached +30C which, if true, is astonishing evidence of Arctic amplification. Hansen et al 2011 predict that rising Arctic temperature will result in decadal doubling of ice loss from the Greenland ice sheet. If realised, it can be expected that present rate of loss ~250 Gt/annum will increase to loss of ~130,000 Gt in 2100 with most of that loss occurring after 2060. Now that will produce an indisputable hockey stick!
    0 0
  23. Ken Lambert - 'Surely quotation of the North Carolina Sea Level which is the subject of this thread is also a case of "conflating regional data to global data". ' Not if it's properly corrected for local isostatic rebound adjustments. Unlike absolute temperatures, sea levels have very little variance around the world. Do you have any specific issues with the adjustment and calibration procedures included in Kemp et al 2011? As in particulars you can identify as errors? I've asked that question on several blogs, with no answer so far. --- Incidentally, this very paper is currently a hot topic on both JoNova and WTF'sUST. With predictable insults about data availability, North Carolina sedimentation rates, and basic handwaving, and absolutely no concrete addressing of the techniques described in the paper. Oh, and a lot of Ad Hominem attacks on Michael Mann being involved, even though he's the 4th author of 6...
    0 0
  24. KR: Proxy switch at 1,000 AD. The reason for the proxy switch is the data didn't match. That is just one item. And there are large differences in sea level world wide. Even differences in sea level rise rate. Regional is regional. One can gloss regional to try and make it global but the dogs tail isn't wagging.
    0 0
    Response:

    [DB] "Proxy switch at 1,000 AD."

    What proxy was switched for what, specifically?

    "The reason for the proxy switch is the data didn't match."

    In what way?  Are you implying fraud on the part of the authors?

    "And there are large differences in sea level world wide."

    No, not really.

    "Even differences in sea level rise rate."

    Yes, for very-well-documented, non-handwaving reasons.  One can even try and liken it to the tail wagging the dog all one likes, but that just demonstrates you have no argument supported by the science.

  25. Regional is regional. One can gloss regional to try and make it global but the dogs tail isn't wagging.
    Correlation within 10CM error bounds. On the one hand we have mathematics ... On the other hand, Camburn's perpetually wagging tongue that proclaims his bias trumps analysis ... no matter how often he's been shown to be full of it. Tch, tch.
    0 0
  26. Ok......10cm error bounds. Sea level is rising at approx 2.3mm per year. So with normal stats, 10CM error bar....that means that sea level could stay flat somewhere for approx 90 years and be within the error bars. Yep....this regional rate is certainly global. I am actually surprised that anyone is trying to project this regional rise to a global scale. As I said, this tail doesn't wag.
    0 0
    Response:

    [DB] "that means that sea level could stay flat somewhere for approx 90 years and be within the error bars."

    And by what physical processes would that be happening under?  Given the SLR already documented to be in the pipeline?

    You grasp at leprechaun straws.

  27. If you made some effort to understand the link between regional and global sealevel, you would make more sense. Hint the "10cm error bar" doesnt mean what you think it does.
    0 0
  28. Sphaerica @49, Perhaps you didn’t get the point. The initial point was to compare tidal measurements on the E & S coasts of the US, with global temperature. That is, get a broader surface sample of readings. Then compare the filtered results to see if there is any significant correlation. And from the graph, it was found that the station data was pretty close to the trend line, and did not have the changes ( i.e amplitude and/or phase), noted on the global temperature plot. That just might give a indication of temp & sea levels not being correlated that well. ( -Previously posted linked graphic snipped- ) The second was a matter of interest, as to NH temperature being correlated to long term temperature records. Since the issue of conflating regional data to global data came up, here is a updated chart comparing long term European data with HadCRUT NH & global data. It would appear there are strong correlations between the temperatures, but not with the CO2, similar to the tidal data. ( -Previously posted linked graphic snipped- ) And I will agree, there can be problems with conflating information, one has to be careful on what your doing. So one can make the case that a correlation between sea level an global temperatures is about as bad as between global temperature and CO2. Perhaps you could "cobble" something better, to convince me otherwise?
    0 0
    Response:

    [DB] Links to graphics you had previously linked to in your comment at 48 earlier snipped.  Please just refer back to the earlier post with a link to it.  Repeating yourself doesn't gain you extra credit.

  29. #39 : "@okatiniko. What do you mean? without any clear signal...? Can it be any clearer? " The signal is very clear after 1900, but there is nothing conspicuous associated with the supposed anthropogenic component after the 60's. This is very usual in all proxy-based reconstructions : they don't show anything clearly associated with the rise of anthropogenic forcings, only with the exit from LIA in the XIXth century - or maybe simply correlated with the advent of modern instrumental methods, allowing the proper calibration of data. There may be explanations for that, but perhaps not of the kind you'd like to hear.
    0 0
    Response:

    [DB] "There may be explanations for that, but perhaps not of the kind you'd like to hear."

    If, as I suspect, those "explanations" run afoul of the Comments Policy, then you would be correct.

  30. We can check it with the Interactive Sea Level Time Series Wizard of the CU Sea Level Research Group. Sand Point (A): 35.87N 75.64W - sea level rise (1993-2011): 0.0496 mm/year Tump Point (B): 34.99N 76.36W - sea level rise (1993-2011): 0.1049 mm/year These are satellite data, so sea level rise at the Atlantic coast of North Carolina is specified relative to the true geoid here. You can see current local rate (for the last two decades) is negligible. On the other hand if you check nearby tide gauges in the region, some show quite substantial rates of sea level rise for the same period, like the one at Hampton Roads (5.6 mm/year, close to Norfolk, Virginia). These rates are not measured relative to the geoid, but to local coastal elevation, therefore the difference is due to land subsidence. This rate is much higher than the (GIA related) secular rate specified by Kemp 2011 (0.9-1 mm/year). Recent acceleration of subsidence on the coastal plain is most likely due to groundwater depletion (sediment compactification occurs as pressure in coastal groundwater table is decreased by overexploitation). There is also a high local variability in this rate, because it depends on both nearby drilling history and structure of local layers at depth. Unfortunately Kemp at al. do not even try to address this effect. You can check the background in this USGS report: USGS - science for a changing world Professional Paper 1773, First posted November 8, 2010 Groundwater Resources Program Groundwater Availability in the Atlantic Coastal Plain of North and South Carolina Edited by Bruce G. Campbell and Alissa L. Coes This interpretation is consistent with the fact the bulk of local sea level rise acceleration (relative to coastal elevation) happened in the late 19th century, when industrial scale drilling for groundwater became feasible. It means Kemp at al. possibly detected a local signal unrelated to global sea level change, but caused by recent local anthropogenic effects on coastal elevation.
    0 0
  31. "[DB] "There may be explanations for that, but perhaps not of the kind you'd like to hear." If, as I suspect, those "explanations" run afoul of the Comments Policy, then you would be correct." if comments policy forbids references to respectable, peer reviewed (but "disturbing") papers , yes.
    0 0
    Moderator Response:

    [Dikran Marsupial] Judging by the abstract it looks off-topic for this thread. If you want to discuss it, pick a more appropriate thread.

    [DB] For those interested, follow the links kindly provided by Pauls below.  The RC discussion of the irredeemable issues with the von Storch paper are especially interesting.  It is interesting (but tiresome) that some still trot out debunked and even rebunked papers in a transparent effort to dissemble and sow doubt.

  32. #60 KR, and #61 Andy S, I did remember that sediments are heavier than water, I generously allowed for that: "160 billion tons maybe? It would replace about 50 billion tons of sea water." But my figure of 160 was probably too big. #70 and #63, - evening out over the geological long term, yes, but we may be in a phase now, where new mountain ranges are not forming, but where extensive farming opens up vast fields so that soil is blown inte the sea (as in southern Sweden). Also, the desert area increase (e.g. Sahara) results in more sand being blown into the ocean, as in this satellite photo. I am not trying to explain away measured sea level rise by erosion; I am merely saying it should be taken into consideration as a contributing factor.
    0 0
  33. Sphaerica, I have to admit that your posts regarding the fatter fish displacing more water left me in stitches. It was a welcome relief, slightly OT, but entertaining. I have to ask, with the sediment flowing downhill, and the fatter fish sinking, would that not cause the Earth to spin faster?
    0 0
  34. Argus @82, some maths: a) Length of the Somalian Coast Line: 3,025,000 Meters b) Length of the Kenyan Coastline: 536,000 Meters c) Length of the Tanzanian Coastline: 1,424,000 Meters d) Combined Length = a + b + c = 4,985,000 Meters e) Average Depth of the Ocean: 3,790 Meters f) Median Tectonic Motion of East African Rift: 0.002 Meters per annum. g) Approximate Median displacement of the Indian Ocean by the East African Rift = d * e * f = 37,786,300 Cubic Meters per Annum. h) Minimum Density of Sandstone: 2.2 ton per cubic meter i) Minimum mass of displacing rock form East African Rifting = g * h = 83,129,860 tons j) Annual Sediment Load deposited by the worlds rivers: 15.5*10^9 tons k) Ratio of deposited mass to mass of displacing rock in East African Rifting = j/i =~= 186.5 l) Maximum water displacement by deposited sediment = k * g =~= 7*10^9 Cubic Meters per Annum m) Surface Area of the Earth's oceans: 3.6*10^20 meters squared. n) Volume of a 1mm increase in sea level = 0.001*m= 3.6*10^17 meters cubed o) Ratio of maximum water displacement due to sedimentation to the volume increase from a 1 mm increase in sea level = l/n = 1.95*10^-8 or approximately 2 millionth of a percent. Please by all means check my maths as I am notorious for errors in that area, but this simple reality check suggests there is no significant impact on ocean volume by sedimentation.
    0 0
  35. To add (very little) to what Tom says, there is also the point that sediment doesn't just sit at the bottom of the ocean, it gets compressed into rock and then gets subducted under continental plates. I suspect the rates of sedimentation and subduction are roughly in equilibrium on geological, in which case sedimentation would only cause a rise in sea level if there was a change in sedimentation rates. If there was a good reason to think sedimentation was an significant issue, you can be sure it would be taken into account in the adjustments made to the raw data.
    0 0
  36. Methinks that some around here, and presumably on certain well-known blogs really don't like hockey sticks showing up in different kinds of palaeoclimate records...
    0 0
  37. 81, okatiniko - I realise this ha been declared OT but thought I'd make you aware of some developments since that 2004 paper. This is a comment on the paper published in 2006 pointing out errors in their methodology. Further discussion here.
    0 0
  38. #86 ... and also, on the other hand, that many commentators on this site seem to get genuinely happy for every new hockey stick that shows up!
    0 0
    Moderator Response:

    [DB] I'm extremely certain that every single regular poster here would like nothing more than for a "silver bullet" to be found that makes the entire problem of the radiative physics of our fossil fuel emissions "go away".  But being human, there is a natural tendency towards elation when we have solid scientific data showing the dissembling of the denialist movement to be exactly what it is: a house of cards built on shadows and myths.

    [Dikran Marsupial] Proof that every cloud has a silver lining, even if it is only one atom thick! ;o)
  39. Tom Curtis #84 BP#80 BP seems to me making good unanswered points. This whole SLR debate should be reframed as a VOWIO (volume of water in oceans) debate. Because that is the real measure of warming via thermal expansion and ice melt. I did some numbers a while ago on sediments and biomass - and they were one or two orders of magnitude smaller than the 2-3mm/year of SLR. When dot-cloud radar scanners can penetrate 3700m of seawater and measure the bottom to an accuracy of 0.1mm, we could determine if the bathtub is growing or shrinking in volume. If the bottom was rising 1-2mm per year - there is your SLR.
    0 0
  40. Tom Curtis #84 Sediments are a very small contributor globally - less than 0.2mm/annum by my rather old sum extrapolating the Yangtze River flow. "Please by all means check my maths as I am notorious for errors in that area, but this simple reality check suggests there is no significant impact on ocean volume by sedimentation" I am not going to check your sums this time Tom, but I do wonder why you present such an array of number facts and then cast doubt on your own sums which are supposed to make your point.
    0 0
    Moderator Response: [Dikran Marsupial] Please stick to discussing the science, rather than comments regarding the motives of the participants. As this is an area where you have tended to sail rather too close to the wind with respect to the comments policy, it would be well worth refraining from such comments entirely. As it happens, explicitly stating any uncertainties in ones argument is standard operating procedure in the sciences. "If a man will begin with certainties, he shall end in doubts: but if he will be content to begin with doubts, he shall end in certainties" - Francis Bacon
  41. Ken Lambert @90, "I am not going to check your sums this time Tom, but I do wonder why you present such an array of number facts and then cast doubt on your own sums which are supposed to make your point." Because, KL, unlike you I would rather arrive at the truth than make a point. That is why I can admit my errors, while you give every evidence of being incapable of doing so.
    0 0
  42. Ken Lambert @ 89, says "When dot-cloud radar scanners can penetrate 3700m of seawater and measure the bottom to an accuracy of 0.1mm, we could determine if the bathtub is growing or shrinking in volume. If the bottom was rising 1-2mm per year - there is your SLR.". That was my point at the end of #48. There is still a lot we have little knowledge of, including sea floor topography.
    0 0
  43. "When dot-cloud radar scanners can penetrate 3700m of seawater and measure the bottom to an accuracy of 0.1mm, we could determine if the bathtub is growing or shrinking in volume. If the bottom was rising 1-2mm per year - there is your SLR." Surely they jest? What a lovely red herring. Occam's razor applies here, and some would rather have us debate how many angels can dance on a pin head, rather than face the fact that the global sea levels are rising in step with increasing temperatures as they have in the past (and here I mean over statistically significant periods of time). This paper has obviously causing "skeptics" and those in denial about AGW some cognitive dissonance and their posts here show that. Posts such as the one I quoted above are trolling and baiting, and nothing to so with the paper being discussed. It is also a perfect example of how someone in clearly denial can rationlize what they so dearly wish to believe. That is not science either. They are also examples of fabricating doubt, confusion and exaggerating uncertainty, claiming that "we do not know everything so we know nothing" all tricks routinely plied by the "skeptic" and denialist misinformation machine. Can we please get back on track folks.
    0 0
  44. The only process that has a measurable effect on ocean basin volume is GIA (Glacial Isostatic Adjustment). Currently volume of ocean basins is increasing at a 100 km3/year rate, because vast continental areas that were once covered with miles of ice, having got rid of this weight, started rising. It can only happen if mantle material (which behaves as a high viscosity fluid) is sucked in from below the oceans to support rising rock. That is, ocean basins next to previous ice sheets (like the Laurentide and Fennoscandian one) are getting progressively deeper. All other processes like plate tectonics or sedimentation operate on much longer time scales and their contribution is negligible to millennial rates of ocean basin volume change. Anyway, this GIA thing only gives a -0.3 mm/year contribution to sea level rise. As for ocean water volume changes, relative sea level measurements at continental margins (tide gauges) are not representative, because continental margins themselves are sinking on average. There are two reasons for that. One is still GIA, because sea level is some 120-140 m higher now than it was twenty thousand years ago. This additional weight of seawater is slowly pushing continental margins down (relative to the true geoid). The other one is ground water depletion which (through decreasing pressure in water table) induces sinking of sedimental layers in many coastal regions. Therefore part of sea level rise as measured by tide gauges is in fact (coastal) land level decrease. Volume of sea water can change in two ways. One is steric when water mass is unchanged and only its volume changes due to decreasing (or increasing) density, mainly because of changes in heat content. In this respect sea level behaves as a thermometer. Not a terribly good one though, because volumetric thermal expansion coefficient of seawater depends heavily on both temperature and pressure, so the addition of the same amount of heat can produce quite different sea level changes depending on which part of the ocean absorbed it. As volumetric thermal expansion coefficient is increasing with both temperature and pressure, while water temperature decreases with depth, there is a layer at about 1000 m below the surface where absorption of heat has the least effect on sea level. Expansion due to the same amount of heat absorbed increases both below and above this level (the former because of increasing pressure, the latter because of increasing temperature). The other way to change sea water volume is to change its mass, that is, to add some more water to the oceans or subtract it from them (and store it elsewhere). The main processes here is melting of land based ice (or snow accumulation), water storage in reservoirs (negative contribution) and groundwater depletion. These processes do not have much effect on heat content of the climate system. The last two has simply none, while melting ice uses almost a hundred times less heat to produce the same sea level change as (steric effect of) heat absorption by water. ( -Snip- )
    0 0
    Response:

    [DB] Off-topic unsupported conclusions snipped.

  45. Camburn@74 It is right there in the OP: "IPCC AR4 showed that local sea-level trends differed by up to 2 mm/y from the global mean over AD 1955–2003, which implies deviations of up to ±10 cm at some locations (but ±5 cm along most coastlines) as the sum of forced and unforced effects. This analysis suggests that our data can be expected to track global mean sea level within about ±10 cm over the past two millennia, within the uncertainty band shown for our analysis." So if I am understanding it correctly, this regional proxy is average when compared to global proxies. Not everyone can be a unique snowflake! On the Bell Curve someone has to be average.
    0 0
  46. BP, I commend your obfuscation efforts @80. On the surface of it, and ignoring your unsubstantiated hypotheses and musings, you may (or may not) have a out about the GIA correction. Can we look forward to you writing up and submitting a formal rebuttal to the journal, or are you simply here to grandstand? But before that, perhaps we should show what they actually say in the paper: "A constant rate of subsidence (with no error) was subtracted from the Sand Point (1.0 mm/y) and Tump Point (0.9 mm/y) records. These rates were estimated from a US Atlantic coast database of late Holocene (last 2000 y) sea-level index points (13, 15). Use of a constant rate is appropriate for this time period given Earth’s rate of visco-elastic response (14). The resulting records are termed “GIA-adjusted,” expressed relative to mean sea level from AD 1400–1800 and visually summarized by an envelope (Fig. 2C)." So a constant correction was applied to all the data, and just as if a temperature sites has a systematic bias, that systematic bias/offset does not affect the trend.
    0 0
    Moderator Response: [Dikran Marsupial] Please can we all dial back the tone of the discussion a notch or two, and keep things on a constructive a level as possible.
  47. BP @94, "Anyway, this GIA thing only gives a -0.3 mm/year contribution to sea level rise." Well there you have it folks, BP agrees with the University of Colorado, and refutes the ridiculous assertions being made here.
    0 0
  48. #96 Albatross at 02:27 AM on 25 June, 2011 So a constant correction was applied to all the data, and just as if a temperature sites has a systematic bias, that systematic bias/offset does not affect the trend. But groundwater extraction rate in the North Carolina Central Coastal Plain was not constant during the last two thousand years. From the USGS report: "As of 2004, large volumes of groundwater being pumped in the CCPCUA ([North Carolina] Central Coastal Plain Capacity Use Area) had affected groundwater levels and flow regimes (State of North Carolina, 2004) in the aquifers and confining units underlying the area. As the simulated groundwater flow budget analysis indicates, groundwater continues to be removed from storage in many of the hydrogeologic units, and groundwater level declines continue to occur. Until these reductions in groundwater storage are lowered or stopped, groundwater availability will continue to decline in this area." For example PSMSL station DUCK PIER OUTSIDE is not too far (less than 30 km) from Sand Point (where secular coastal land subsidence rate is said to be 1 mm/year). If you calculate rate of sea level change relative to the tide gauge station there between the end of 1992 and beginning of 2010, it turns out to be 4.86 mm/year. On the other hand satellite data at the same location and for the same time period show 1.16 mm/year. It means land subsidence rate at Duck Pier is 3.7 mm/year during the last two decades, almost four times the secular rate due to GIA alone. The additional 2.7 mm/year is probably caused by decreasing pressure in the groundwater table adjacent to the coast. And this (clearly anthropogenic, but local) phenomenon is a new one, caused by excessive drilling and pumping in the region (which, unlike fast increase in global atmospheric CO2, started in the late 19th century indeed). Is it obfuscation, really? Can we look forward to you writing up and submitting a formal rebuttal to the journal, or are you simply here to grandstand? You can't, it's not my job. There are guys who get a salary for that. And I am really surprised this issue has not come up in the peer review process. It is more than obvious. BTW, you are free to submit a letter to PNAS, I have no claims :)
    0 0
  49. The objections to this paper on WUWT (Willis Eschenbach column) are primarily complaints that insufficient data was published along with the paper, in particular the look-up table of depth versus species ratios for the ~200 calibration samples, and that (unspecified) sections of the math were lacking to the point of not enabling proper review. I noted that establishing species ratios vs. depth is pretty standard practice in foraminifera studies, and asked whether they needed the paper to also contain multi-semester courses in GIA, foraminifera identification, tidal gauges, radioisotope dating, and perhaps a private tutor and a masseuse to help them through the material.../sarcasm I expect impolite responses... What's most interesting to me is that this paper was written by six authors, with Michael Mann as the fourth - contributing, but not the lead author - it's Kemp et al 2011. Yet the skeptic blogs are ranting about the "Mann" paper - he appears to be a favorite target for Ad hominem attacks. Logical fallacies, of course, but an easy target for that audience.
    0 0
  50. BP @96, Yes, extraction has not been constant. But your entire premise rests on your presumption that the water extraction along the coastal plain has had a marked impact on the study sites. The data suggest otherwise, from the RC post: "These data are valid for North Carolina, where they are also in agreement with a local tide gauge (Fig. 2 in the paper). But they also agree with another proxy data set from Massachusetts." Sea level evolution in North Carolina from proxy data (blue curve with uncertainty range). Local land subsidence is already removed. The green curve shows a reconstruction based on tide gauges from around the world (Jevrejeva et al. 2006, 2008). The red curve shows results from a simple model connecting global temperature with sea level. You said earlier "Recent acceleration of subsidence on the coastal plain is most likely due to groundwater depletion (sediment compactification occurs as pressure in coastal groundwater table is decreased by overexploitation). There is also a high local variability in this rate, because it depends on both nearby drilling history and structure of local layers at depth." So you are arguing what ifs then. You also admit that impacts depend on the nearby drilling history. As shown in Fig B2 in the document you referred us to, there are no continuous borehole sites near the study sites, nor are there any observational wells. At this point I would suggest that you go to RealClimate and engage the authors there with your hypotheses. And please do not offer up excuses why you might not do that. I for one am interested in what they say about your claims.
    0 0

Prev  1  2  3  Next

You need to be logged in to post a comment. Login via the left margin or if you're new, register here.


The Consensus Project Website

THE ESCALATOR

(free to republish)


© Copyright 2024 John Cook
Home | Translations | About Us | Privacy | Contact Us