Climate Science Glossary

Term Lookup

Enter a term in the search box to find its definition.

Settings

Use the controls in the far right panel to increase or decrease the number of terms automatically displayed (or to completely turn that feature off).

Term Lookup

Settings


All IPCC definitions taken from Climate Change 2007: The Physical Science Basis. Working Group I Contribution to the Fourth Assessment Report of the Intergovernmental Panel on Climate Change, Annex I, Glossary, pp. 941-954. Cambridge University Press.

Home Arguments Software Resources Comments The Consensus Project Translations About Support

Twitter Facebook YouTube Mastodon MeWe

RSS Posts RSS Comments Email Subscribe


Climate's changed before
It's the sun
It's not bad
There is no consensus
It's cooling
Models are unreliable
Temp record is unreliable
Animals and plants can adapt
It hasn't warmed since 1998
Antarctica is gaining ice
View All Arguments...


Username
Password
New? Register here
Forgot your password?

Latest Posts

Archives

Sea Level Hockey Stick

Posted on 23 June 2011 by dana1981

A paper recently published in the Proceedings of the National Academy of Sciences by Kemp et al. (2011) has assembled new sea level reconstructions for the past 2,100 years based on sediment from the US Atlantic coast. They found that recent sea level rise is the fastest over the last 2100 years:

Kemp et al. sea level data

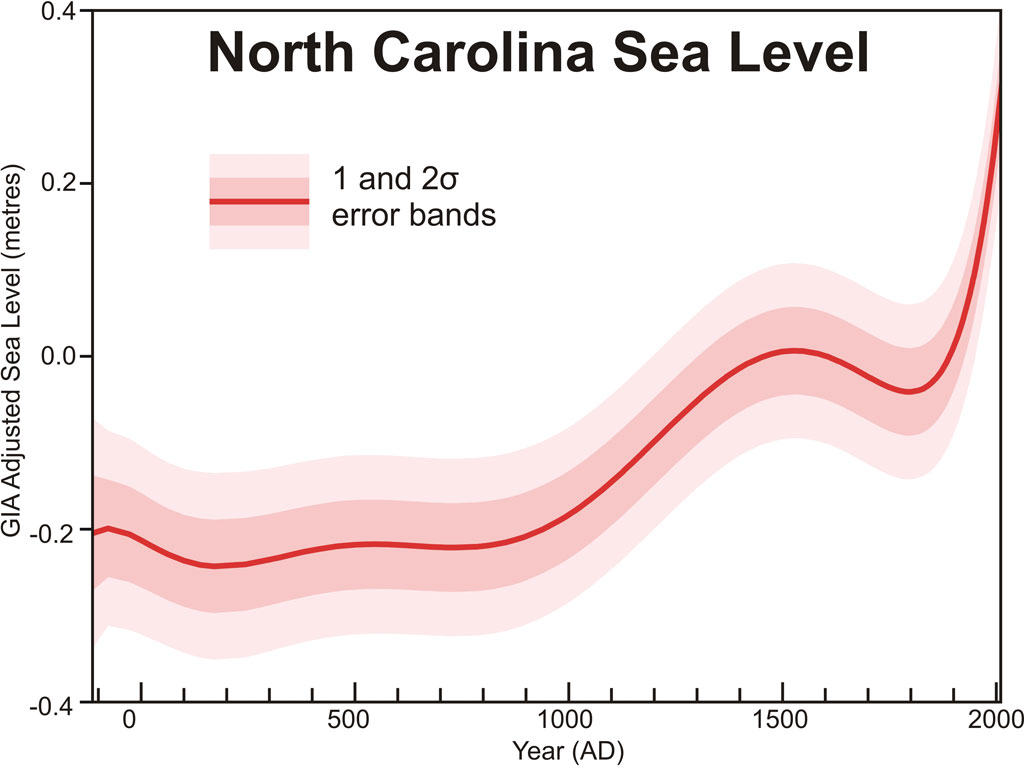
Figure 1: Sea level reconstruction by Kemp et al. (2011) using sediment from salt marshes in North Carolina.  This figure has also been added to the high resolution graphics page.

Among the co-authors of this paper are some heavy hitters in climate research: Michael Mann, Martin Vermeer, and Stefan Rahmstorf.  The reconstruction is based on microfossils of foraminifera found in sediment from the US Atlantic coast."  Rahmstorf explains the study methodology at RealClimate.  The authors summarize their findings:

"Sea level was stable from at least BC 100 until AD 950. Sea level then increased for 400 y at a rate of 0.6 mm/y, followed by a further period of stable, or slightly falling, sea level that persisted until the late 19th century. Since then, sea level has risen at an average rate of 2.1 mm/y, representing the steepest century-scale increase of the past two millennia. This rate was initiated between AD 1865 and 1892. Using an extended semiempirical modeling approach, we show that these sea-level changes are consistent with global temperature for at least the past millennium."

In short, there was little change in their sea level reconstruction from 100 BC to 950 AD.  During the Medieval Warm Period and a bit beyond, sea level rose, as one would expect.  Into the Little Ice Age, sea level fell slightly, until just over a century ago, when sea level rise began to accelerate rapidly.  Rahmstorf, Vermeer, and Mann used a semi-empirical model to analyze the connection of the sea level data with climate, essentially assuming that the hotter it gets, the faster sea level rises.  Rahmstorf describes their conclusions:

"According to this model, the rise after about 1000 AD is due to the warm medieval temperatures and the stable sea level after 1400 AD is a consequence of the cooler “Little Ice Age” period. Then follows a steep rise associated with modern global warming. Modern tide gauge and satellite measurements indicate that sea level rise has accelerated further within the 20th Century."

"...the model fit to the new proxy data is highly consistent with the fit we obtained in 2009 to the tide gauge data. Hence it implies almost the same future projections as in our 2009 paper (75-190 cm by 2100)."

The authors note that their reconstruction is consistent with local tide gauge measurements, and also compared the North Carolina results to data gathered from nearby Massachusetts:

"The Massachusetts data agree with the North Carolina reconstruction, except for higher sea level between AD 700 and 1000 (although the uncertainty ranges overlap)."

And they compared their results to a number of other sea level reconstructions (Figure 2).

"For North Carolina, we estimate that the deviation in sea-level rise from the global mean due to ocean circulation changes is between 0 and +5 cm. This estimate was based on the IPCC AR4 model ensemble for a 21st century global warming of ∼3°C, in which sea level rises globally by 22–48 cm."

"IPCC AR4 showed that local sea-level trends differed by up to 2 mm/y from the global mean over AD 1955–2003, which implies deviations of up to ±10 cm at some locations (but ±5 cm along most coastlines) as the sum of forced and unforced effects.  This analysis suggests that our data can be expected to track global mean sea level within about ±10 cm over the past two millennia, within the uncertainty band shown for our analysis."


Kemp comparisons

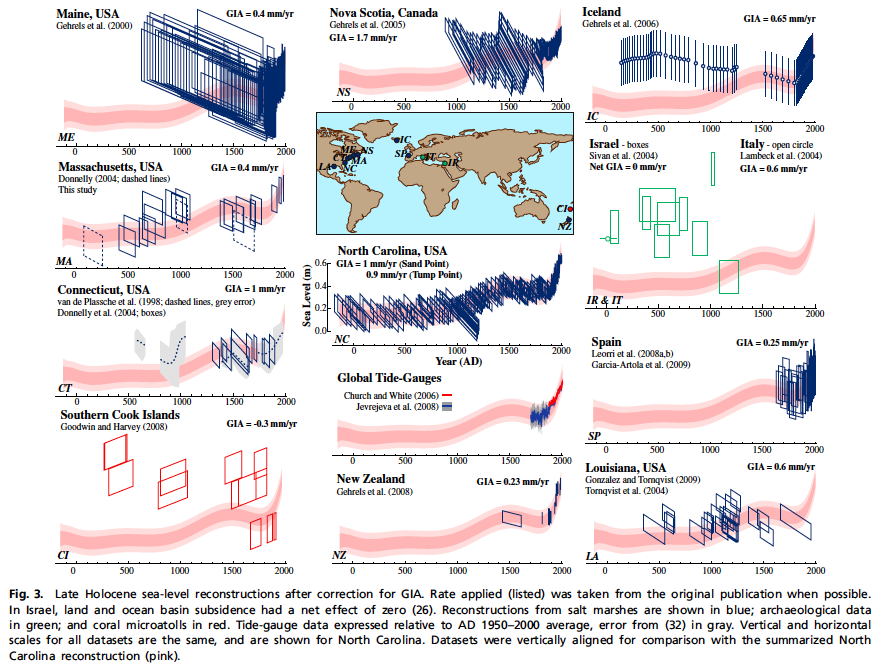
Figure 2: Comparison of various sea level reconstructions to Kemp et al. (2011).  The study's North Carolina reconstruction is shown in pink in every panel, and the other reconstructions for comparison are shown in blue, green, or red.

This sea level reconstruction is yet another member of the ever-growing hockey team (see other members here, here, and here) supporting the conclusion that the current rate of warming is greater than at any other time in the past two millenia.

0 0

Printable Version  |  Link to this page

Comments

1  2  3  Next

Comments 1 to 50 out of 131:

  1. Sea level rose in North Carolina. This does not represent global sea level.
    0 0
    Response:

    [dana1981] In the future, please read a post before commenting on it.  The relation to global sea level is discussed in the post.

  2. I imagine you think it's important to compare these results with data from elsewhere, then, Camburn. Hmmm, I wonder what that last graphic in the post is, if it's not just that?
    0 0
  3. Camburn - Sea level rose quickly in North Carolina due to local isostatic rebound (dropping coastline), which was one of the reasons this location was chosen. A descending coastline in an area of heavy sedimentation accumulated more mud, giving thicker sections for each time point, allowing sufficient foraminifera collections for reasonable analysis. The foraminifera species distribution ratios are quite sensitive to depth, permitting estimations of what depth each time point corresponded to. Applying an inverse isostatic rebound correction allows extracting the sea level independent of coast level, which is reasonable to assume is a global sea level barring problems with the isostatic correction. I believe those uncertainties are a major part of the uncertainty bars in this paper. So, yes, Camburn - as the moderator pointed out, it's worth reading a post, and possibly the references thereof, before commenting.
    0 0
  4. I did read it and the references. From the references, we have a range on -0.3 to +1.7mm/year. So North Carolina is rising at .9mm/year. It is cold where I live today. I do not deduce that it is cold everywhere from a regional deduction.
    0 0
    Response:

    [dana1981] Please see the quote immediately above Figure 2

  5. "This analysis suggests that our data can be expected to track global mean sea level within about ±10 cm over the past two millennia, within the uncertainty band shown for our analysis." The analysis suggests, but does not confirm. It is a regional analysis, not a global analysis. To suggest that a single data point would statistically show a global average is out of the realm of stats.
    0 0
  6. Camburn "The analysis suggests, but does not confirm. It is a regional analysis, not a global analysis. To suggest that a single data point would statistically show a global average is out of the realm of stats." I will make sure to quote, attribute the quote and qualify it as coming from a "skeptic" whenever I run into this kind of suggestion from another skeptic, which is bound to happen sooner or later (likely sooner).
    0 0
  7. Philippe: Feel very free to quote me. If the skeptic is educated, then he would understand regional does not make global.
    0 0
  8. @Camburn, You are probably familiar with the difference between looking to something with the naked eye or with a microscope. The first one offers you a non detailed view of a large area while the second offers you a detailed view of a small area. What is presented in this work is a 'microscopic' study of a small area in North Carolina and they compared these results with other 'macroscopic' studies from around the world. "To suggest that a single data point would statistically show a global average is out of the realm of stats" is correct but that is NOT what the autors of the article did!
    0 0
  9. "To suggest that a single data point would statistically show a global average is out of the realm of stats." However, it does, over the period of time for which overlapping data is available. Gee, imagine that. It is a reasonable supposition that the correlation will extend into the past, which is all they claim. Meanwhile, I foresee a future where teams of researchers look for similar sites around the globe and perform a similar exercise. And when these efforts extend the window of overlapping data further into the past and confirm that they fit the NC data within a reasonable error bounds, Cameron will state "to suggest a dozen points would statistically show a global average is out of the realm of stats". And later 50 points ... And still later 100 points ...
    0 0
  10. dhogaza: Nope. Show me 100 points that are from different grids and we can talk. As far as this study, it is trying to extrapolate more from one single point than is justifiable. ( -Snip- ). So, nothing new.
    0 0
    Response:

    [DB] Insinuations of academic fraud snipped.  Please re-read the Comments Policy as well.  Future comments will be expected to adhere and conform to the policy.  Posting here in this forum is a privilege, not a right.

  11. Camburn, can you please do some effort to read the article (its free) and the comments?
    0 0
  12. As far as this study, it is trying to extrapolate more from one single point than is justifiable.
    They establish the correlation exists. Perhaps you might educate us as to why we'd expect the correlation to suddenly stop correlating for those years for which there's no overlapping data? Geologically we're talking about a short timespan here, it's not like the continents have been whizzing around the planet over the last couple of millenia.
    0 0
  13. Inference of sealevel from single point is very different from inference of global temperature from a single point. Ignoring tectonic effects, there is an absolute relationship between global level rise and a local sea level rise - not so for temperature. The problem with a global inference of sealevel is quantifying local tectonic change which the paper believes is well-constrained.
    0 0
  14. More inconvenient findings for the "skeptics" and those in denial, and yet another "Hockey Stick". Interesting how the site reflects the MWP and LIA, yet "skeptics" wish us to believe that the results are not applicable to a larger context. The larger context being that something unprecedented in the last 2000 years is unfolding before their very eyes. And I also find it quite ironical that 'skeptics' who abuse the GISP2 record, are now whining about the findings from this study, especially when the study's authors did place their findings in a global context and demonstrated that their data are consistent with global sea level reconstructions made by Church and White (2006) and Jevrejeva et al. (2008). But I understand that they have to imagine every kind of excuse to dismiss the paper's inconvenient findings. But doing so is not 'skepticism' it is denial.
    0 0
  15. can you elaborate on how the site shows the MWP and LIA.
    0 0
    Response:

    [DB] Please read the OP above, paying particular attention to Figure 2.

  16. Can anyone elaborate on the correlation between the rate from the Southern Cook Islands and North Caronlina? Being it seems North Carolina can all of a sudden become global....yet....sea level rise is negative in the Southern Cooks and positive in North Carolina. Tell me again how this paper is global in nature?
    0 0
  17. Ok.....the correlation to world wide global sea level was bothering me. Here is what Prof. Konrad Steffen says about sea level rise "In addition, as a result of the gravitational pull from the spinning Earth, if you add the equivalent of one metre of sea level rise to the oceans in the Northern Hemisphere, it will translate to about 1.6 metres sea level rise in the Southern Hemisphere, and only about 40 cm in the Northern Hemisphere. He is the director of CIRES and should be an authority on sea level rise etc. IF the North Carolina data were anything but a local phenominum.....the sea level SHOULD be rising quit fast in the Southern Cook Islands. It isn't. This paper has to do with sea level and hydrology, an area that I have studied intently for 20 years. No I am not a Prof as Prof Steffen is, but this paper still shows nothing at all globally.
    0 0
  18. "Getting a regional resolution is of course much more complex and that is why I usually avoid discussing regional sea level in public, as we do not have good answers yet. There will be regions where sea level is going down even though just a few hundred kilometres away the water will be rising." Prof Steffen This paper is a regional paper. A good paper for the region. As far as globally, nope.
    0 0
  19. Camburn: Southern Cook Islands is one of the reconstructions they calibrated against. Please read the post and study the diagrams.
    0 0
  20. You will note however, that Prof Steffen was quite capable of relating global level to local levels. Really big differences over short distances are difficult but they are due to tectonic effects not present in North Carolina. You will also note that the paper did compare their results to other sealevel proxies.
    0 0
  21. scaddenp: North Carolina is an area that is sinking so to make the statement that tetonics is not an issue with North Carolina is false.
    0 0
  22. Sorry, I should be clearer. The tectonic effect is regional GIA adjustment. Rather different to say my local area where Malrborough Sounds on one side a fault are dropping 4mm/year while 50km away, on another fault, the range goes up at close 5mm/year. Relating coastal sealevel predictions to globalin that setting is tough. Estimating GIA?, not so much. (Actually I am not so sure about their GIA adjustment.The basis for it depends on an estimate of crustal rheological parameters that I am not so sure about, but that's another story - more data coming. It wont effect the shape of their curve.)
    0 0
  23. Camburn - IF the North Carolina data were anything but a local phenominum.....the sea level SHOULD be rising quit fast in the Southern Cook Islands. It isn't Why? Sea level rise isn't globally uniform, (for a myriad of reasons) so why do you expect a higher rate there?
    0 0
  24. Rob: The sea level rise in the Southern Hemisphere should be greater than what is observed in the Northern Hemisphere. Per Prof Steffan. I am not disputing the sea level rise/fall in North Carolina. What I am disputing is to use it as a global metric. This is a regional phenominum. Just as it is a regional phenominum that it is cold and wet where I live. The paper is trying to stretch one location to global. It doesn't wash. It would be like saying because the sea level is falling on the coast of Alaska that overall sea level is falling. That doesn't wash either. Both are regional events.
    0 0
  25. Camburn @various, the continent of North America is tilting up in the north and down in the south as shown by these local sea level rise plots: As you can see, the more southerly the location, the greater the fall in sea level, while Pointe-au Pere in Quebec is rising slightly, and Churchill on Hudson Bay is rising rapidly. The accepted reason for this is that land previously depressed by the weight of ice in the last glacial is rebounding to a more stable position. The same phenomenon can be seen in Britain, and in Europe more generally: Given that this is the cause of local changes of sea level in North Carolina, then the rate of the isostatic adjustment is highly unlikely to have suddenly changes in the last 100 years, or the last 500. Consequently, we should expect a reconstruction adjusted for Isostatic Rebound to show an approximately level sea level at the site over long intervals, as indeed can be seen in the reconstruction. Conversely, if the hockey stick shape of the reconstruction is an artifact, the Isostatic Rebound must have rapidly accelerated and de-accelerated at intervals over the last two thousand years to miraculously reproduce a sea level rise in the MWP, a fall in the LIA, and a very rapid rise over the industrial period. Indeed, if the "blade" of the graph is an artifact, as you are implying, the Isostatic Rebound must have accelerated to approximately double its current value around 200 years ago, and then suddenly de-accelerated to its current value just in time for the instillation of GPS monitoring. While possible, such suppositions are ad hoc and a clear attempt to evade evidence rather than be guided by it.
    0 0
  26. camburn- can you actually link us to what you are quoting? This seems at variance with the calculations by other researchers (eg Clark, Mitrovica) in the field.
    0 0
  27. "The paper is trying to stretch one location to global. It doesn't wash. It would be like saying because the sea level is falling on the coast of Alaska that overall sea level is falling. That doesn't wash either. Both are regional events." That might be a point if they hadn't bothered to check for correlation with other reconstructions, including your pet Southern Cook Islands (I'm sure your next gambit will be to scream that "data corrections to correct for known geological and oceanographic differences are evidence of fraud!!!!" I made similar points earlier, and you ignored them. Just as well. Play the fool, but you won't fool us.
    0 0
  28. There is nothing inherently unscientific about measuring sea level at one point and extrapolating to the entire globe. Or even for measuring temperature at one point and extrapolating to the entire globe. But when doing such an extrapolation two issues arise: 1) if you have other points, then why limit yourself to just one (perhaps the other points are poor quality). The article does discuss what sea level is doing at other points. 2) what is the typical variation from region to region. If the regional variation is typically less than 10cm, then a 40 cm rise at one point is highly likely to reflect a global sea level rise. For temperature regional variations for multi-decade trends are of the order of a couple degrees. Therefore you won't accurately measure global temperature increase of under 1 degree by just one point as the regional variation is bigger than the trend your are trying to measure. If the earth spiralled towards the sun in the next 100 years and temperatures went up by 50 degrees globally, then I am quite sure the temperature trend at just one point is highly likely to reflect this trend reasonably accurately (i.e. to within a degree or two).
    0 0
  29. "I am not disputing the sea level rise/fall in North Carolina. What I am disputing is to use it as a global metric. This is a regional phenominum. Just as it is a regional phenominum that it is cold and wet where I live." Actually, your regional weather phenominum (sic: phenomenom is better known to me) tends to be driven by global stuff like, oh, ENSO. So it's not necessarily difficult to tie your regional weather experience to global phenomena...
    0 0
  30. dhogaza: I don't have to play the fool, in this instance the comments trying to tie this to global from one location are doing a great job. The next time I am confronted with someone telling me that regional weather is not global, I am going to refer them to this link.
    0 0
  31. "The next time I am confronted with someone telling me that regional weather is not global, I am going to refer them to this link." The ocean is not the atmosphere, and steric expansion of the ocean is unrelated to weather. So, go ahead and make that equality, and if you do, be assured you're playing the fool, again. ( -Snip- )
    0 0
    Response:

    [DB] Please, everyone, dial the emotions down a notch.

  32. Well, we did try to a/ explain that sea level was different from temperature. Is this fundamental physics not obvious? Similarly CO2 at Mauna Loa is a local measurement but its pretty good proxy for average global CO2 when suitably corrected. The temperature at Mauna Loa however it not a good proxy for global temperature. b/ point out that the paper was drawing its conclusion after comparison with other proxy records. (Just like you would check Mauna Loa Co2 levels against other stations).
    0 0
  33. Anyone reading this far into this thread will easily see the selective interpretation of the study that forms the basis of this post on the part of some. You all have patiently, robustly and succinctly provided easy-to-follow feedback and guidance. When that endangers ones internal narrative and worldview than one can either bow to the inevitable and change...or one can maintain that the sky is green and lowflying bacon is a public endangerment. Not a choice most would agree with, but a choice nonetheless.
    0 0
  34. And here is the clinker: http://www.dailymail.co.uk/sciencetech/article-1066712/Uncovered-lost-beach-Romans-got-toehold-Britain.html Archelogical evidence recently discovered showing the sea level in Southern England approx 2,000 years ago. Being North Carolina is all of a sudden a proxy for worldwide sea level, the port 2 miles inland on a isostatic falling area indicates that the Romans had ships that sailed on land, or the beginning of the graph for North Carolina is wrong. Being there was a proxy switch at approx 1,000 AD, the earlier levels are probably wrong as I find it hard to concieve that the variation in sea level at that time could have been over 5.5 meters from Kent, England to North Carolina.
    0 0
    Response:

    [DB] It is hard to conceive that you actually read articles in their entirety.  From your linked article:

    "Over the centuries, the channel silted up"

    It is patently obvious the narrative you seek to maintain.  If you can find peer-reviewed sources to cite that support that narrative, fine.  But I would suggest reading them in their entirety to ensure that they actually say what you think they say.

  35. DB: Yes, over the years the channel silted up. But you have to look at the current level of the harbor. Google maps will show you that where the port was unearthed is above current sea level. As an aside, I looked for the comments thing as I was going to try to learn how to post url's with a link as some seem able to do. I can't seem to find that area on the site, maybe I am tired and blind right now.
    0 0
    Response:

    [DB] See here.  I well understand the tired and blind thing.

  36. Camburn @34 Silt has filled what was a shallow harbour 2000 years ago. Exactly where in this article is there anything to about changes of sea level?
    0 0
  37. Thank you DB. I appreciate your help.
    0 0
    Response:

    [DB] Anytime.

  38. yes, another "hockey stick" starting around 1900, and without any clear signal associated to a rising anthropogenic influence after 1960 !!! and another hockey stick relying of ill-known (and unverified independently) reconstruction methods, very likely smoothing the natural variance.
    0 0
  39. @okatiniko. What do you mean? without any clear signal...? Can it be any clearer? Do you have some studies that prove your point about the illknown reconstruction methods?
    0 0
  40. Camburn @37:
    "A recently uncovered Roman structure at Richborough , England, which has been estimated to be a dock dating back to the 14th century, has turned history on its head, by proving that at the height of medieval Sandwichs power and wealth as a port, boats were still mooring at Richborough. According to a report in The Guardian, this discovery is unique because according to the conventional history of the site, Richborough had been completely filled with silt 800 years earlier, the once magnificent Roman fort and large town left abandoned and desolate. The medieval dock was neatly constructed by joining up double-decker-bus-sized lumps of Roman walls which tumbled and slid down from the ramparts of the fort further up the slope. It is built on the shingled Roman shore, one of the key sites in the Roman invasion of Britain in 43 AD, and can be securely dated to the 14th century, since the construction technique is identical to the medieval town walls of nearby Sandwich."
    (From here So, as I understand this, a Roman beach (hence above the low tide mark) sunk low enough that a medieval dock (hence with footings below the low tide mark), which in turn sunk low enough that it to was covered by silt (and hence lay below the water level) and this is taken by you as evidence the coast in that region was not sinking, but rising? I just want to be clear on this.
    0 0
  41. This seems to be wondering off track somewhat here. Lets see if I have it clear. We have various historical records like fish farms, harbours etc. which help construct past sea level. While these show sealevel hasnt changed a lot of last 2-3000 years, they don't rule out the possibility that there were large fluctuations between these points. One thing about sealevel, unlike temperature, is that without volcanic/instrusive activity or faulting, you cant get wild fluctuations in sealevel in one part of world and not in others. In this sense, any high-resolution record is as good as an other. The point in this paper is that in the best records in terms of resolution, accuracy of timing and depth, there are not wild changes and current sealevel rates are extraordinary compared to the last 2000 years.
    0 0
  42. The issue of sea level rise is a tricky one. I tend to think of it in two simple parts. 1. The total volume of water in the bath. 2. The volume of the bathtub. The volume of the water is defined by its mass and its temperature. Add mass - more volume. Add temperature - more volume and visa versa. The volume of the bathtub is influenced by the movement of the seabed, silting, rivers and dams and coastlines etc. Both volumes interacting together will determine the level of water measured on the side of the tub. However only the total volume of water is a direct measure of global warming via ice melt and thermal expansion. Therefore the volume of the tub must be accurately known for sea level changes to be an accurate measure of warming.
    0 0
  43. Ken, do you actually have any evidence to suggest that the volume of the ocean basins (your 'bathtub') is changing in such a way as to provide the illusion of a rising sealevel? Of course you also have to account for why thermal expansion and observed ice mass loss are not contributing to the total volume of water in the bath as well... Otherwise your conjectures are nothing more than wild guesses, especially if, as I suspect, the increase in water volume is happening at a much higher rate than any change in the shape / volume of the basins.
    0 0
  44. 43, skywatcher, Yes, but Ken's conjectures add "serious" doubt to the equation. Who knows what sort of tectonic shifts are happening in the unreachable ocean depths? Who could know? While one might be able to prove that the volume of the water is increasing, one would never be able to prove that the volume of the tub isn't decreasing. ( -Snip- )
    0 0
    Response:

    [DB] Let's focus on the science, not the person.

  45. I have a request - if anyone is up to it; because, having tried, I'm not. We have the hockey team ... to me they are sufficiently similar that I'm inclined to attribute a common underlying phenomena. However, folks then come along and say one is caused by plate tectonics, another by sun-cycles, another by natural climate variations, that one is only local, another by my great aunts bath time... So, would it be possible to itemise the opposing hockey team? Seems like there's only one star player on the AGW team but many in the opposition. Team-AGW is bound to loose unless, of course, the opposing players get in each others way.
    0 0
  46. Camburn - You say you've read the paper; what particulars in the compensation for regional vs. global adjustments in the Results and Discussion section do you have issues with? You've complained, but not detailed why. Kemp et al show what they did at considerable length. In other words - what parts of the global/regional compensation and calibration do you think Kemp et al did wrong? Complaints about regional sea level changes elsewhere are, as others have noted, not valid objections to a calibrated and compensated data set.
    0 0
  47. Ken Lambert - Ocean area is about ~3.6×10^8 km^2, with an average depth of 3790 meters. Sub-meter changes in sea level will not change ocean volume appreciably - well below the 2-3 digits of sea level rise rate accuracy; I believe they can safely be ignored until we look at meter+ total rises. In fact, to the extent that sea level rise increases the total volume available (via slope of shoreline transitions) this would decrease the observed rate of sea level rise with thermal and melt volume change, reducing the "hockey stick" slopes - meaning the problem could only be worse than the current paper shows. Your objection, Ken, is not valid - more of a red herring.
    0 0
  48. Some time ago I started looking at sea levels, using tidal gauge info, to see how it correlated to temperature. The So. & East coast of the US was chosen, since that seemed to have the least seismic activity, including uplift. I would have preferred the East coast of S. America, but the data records were not as good as US records. Looking at the records, noted in the figure below: US SE Tidal records Seven stations were selected, to form a composite anomaly. These included Galveston, Pensacola, Key West, Charleston, Baltimore, Atlantic City & New York. The composite was filtered with a 10 yr. Fourier filter, and compared to a Least Sq. Trend line: US SE Composite Tidal Anomaly It was noted that, after ~1915, the trend line held fairly close to the filtered composite, in spite of increasing CO2. The HadCRUT3 global anomaly was also included as a comparison. An addition, some long term records were evaluated, comparing temperature to CO2. These were from stations that began recording prior to 1800: Central England – 1659-2010 Debilt Netherlands – 1706 – 2010 UPPSALA (LÄN)Swed. – 1722-2010 BERLIN (TEMPELHOF), Ger – 1701-2010 PARIS (14E PARC MONTSOURIS) Fr, 1757-2010 GENEVE (NASA), Switz. – 1753-2010 BASEL (BINNINGEN) Swiz.- 1755-2010 PRAHA (KLEM.-RUZYNE) Czech – 1775-2010 STOCKH (GML-LAN) Sw – 1756-2010 BUDAPEST (Hungary) – 1780-2009 HOHENPEISSENBERG, Ger – 1781-2010 MUNCHEN, (RIEM FLUGHAFEN ), Ger – 1781-2010 EDINBURGH (SCOTLAND), GB- 1785- 1993 WROCLAW (SOUTH WEST), Pol – 1792-2010 CEL & Debilt were from: CEL Link Debilt Link The rest were from the Rimfrost site: Rimfrost Link The anomaly of each site was computed (1969-1999 base) & a composite average was formed for each year. The data set was then filtered with a 50 yr. Fourier Convolution filter, and compared to the CO2 Mauna Loa & Law Dome (DE08 & De08-2) ice core data. The result is shown below: NH Temp vs. CO2 Since all the long term temperature data was taken from central & western Europe, the HadCRUT3_NH anomaly was also included. A few items noted were: On a long term basis, there was little CO2 change, while Europe went through some temperature swings, comparable to the present. While the Ave14 & HadCRUT3_NH seem to follow each other (especially the post 1900 rise, 1940 dip & subsequent rise), CO2 seems to have little correlation. Ave14 seems to lead the HadCRUT3_NH curve by about 10 years, so we may be in for a NH dip, or are already in it. One final point, while the land surface can be measured for uplift, what is the sea floor surface doing?
    0 0
    Response:

    [DB] Your final linked graphic you have posted here repeatedly.  And just as repeatedly, it has been pointed out the issues with conflating regional data to global data.

  49. 48, JBob, What does a temperature versus CO2 graph possibly have to do with sea level rise, especially one containing such a cobbled together "NH" temperature estimate? Beyond this... exactly why should anyone trust your homespun science over all of the more thorough and complete data that is available? And, last but not least, why do you continue to be wedded to the false logic that temperature increases must mirror CO2 increases, or that a failure to do so says anything whatsoever of value in reference to climate science? Your inability to get past that logical hurdle is preventing you from properly understanding the science. I would suggest that you shelve it, and move on with studying other things until you've learned enough to understand exactly why your premise is flawed. As long as you cling to it, you will be unable to advance your understanding of climate science, where we're all heading, and why.
    0 0
  50. 48, JBob,
    One final point, while the land surface can be measured for uplift, what is the sea floor surface doing?
    42, Ken,
    Therefore the volume of the tub must be accurately known for sea level changes to be an accurate measure of warming.
    You've got to be kidding me. Is this really going to become a serious "skeptical" argument for doubting sea level rise? That the ocean basins themselves may be shrinking? This is just getting too bizarre for words.
    0 0

1  2  3  Next

You need to be logged in to post a comment. Login via the left margin or if you're new, register here.


The Consensus Project Website

THE ESCALATOR

(free to republish)


© Copyright 2024 John Cook
Home | Translations | About Us | Privacy | Contact Us