Pre-1940 Warming Causes and Logic
Posted on 21 March 2011 by dana1981
We've previously examined the mid-century cooling, but another common "skeptic" argument is that the early 20th Century warming proves that the current global warming could be natural. Although there was a significant increase in global temperature in the early 20th Century, the rate of warming from 1910 to 1940 was lower than the rate of warming from 1975 to 2005, at about 1.3 vs. 1.8°C per century, respectively. That being said, it's worth taking a look at what caused the early century warming. Several different factors contributed.
Carbon Dioxide
Although humans were not burning very large amounts of fossil fuels or emitting large amounts of carbon dioxide (CO2) in the early 20th Century, relative to the late century, CO2 emissions were non-negligible and did play a role in the early century warming.
From 1900 to 1940, atmospheric CO2 levels increased from approximately 295 to 310 parts per million by volume (ppmv). The equilibrium temperature change caused by this increase in CO2 is the climate sensitivity (λ) multiplied by the radiative forcing, which is approximately 5.35 times the natural log of the change in CO2 (Myhre 1998):
The best estimate for the climate sensitivity parameter is 0.8 (Wm-2K-1). Thus at equilibrium, this CO2 change would be expected to cause a 0.22°C increase in the average global surface air temperature.
Meehl et al. (2004) plots the estimated anthropogenic contribution to temperature change in Figure 1 below. Most of the anthropogenic influence comes from CO2.

Figure 1: Climate model results from anthropogenic forcings compared to observations (black line). The red line is the average of the four-member ensemble. The pink shading is the model range. The blue line is the ensemble mean and the light blue shading is the ensemble range.
As you can see, the best estimate of the anthropogenic contribution to the 1910-1940 warming is approximately 0.1 to 0.15°C. This is smaller than the value we calculated above because the planet is not immediately in equilibrium. Much of the energy imbalance goes into the oceans, causing what's known as the "ocean lag" due to the thermal inertia of the oceans. The same lag effect applies to natural forcings.
Solar
The solar radiative forcing is the change in total solar irradiance (TSI) in Watts per square meter (Wm-2) divided by 4 to account for spherical geometry, and multiplied by 0.7 to account for planetary albedo (Meehl 2002). The albedo factor is due to the fact that the planet reflects approximately 30% of the incoming solar radiation. As with CO2, we calculate the equilibrium temperature change by multiplying the radiative forcing by the climate sensitivity parameter.
Wang, Lean, and Sheeley (2005) compared a flux transport model with geomagnetic activity and cosmogenic isotope records and to derive a reconstruction of TSI since 1713 (Figure 2).

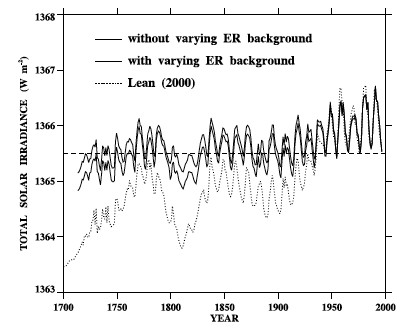
Figure 2: Total Solar Irradiance from 1713 to 1996 (Wang 2005)
As you can see, in the early 20th Century, from about 1900 to 1940 there was an increase in TSI from about 1365.5 to 1366 Wm-2, which we can plug into the formula above. However, previous studies have estimated a TSI change as large as 2 Wm-2, so we'll estimate the change at 1 Wm-2. We then only need the solar climate sensitivity parameter.
The climate response to different radiative forcings is similar, but not identical. This is known as the "efficacy" of a radiative forcing. According to various studies of the direct solar forcing efficacy (from TSI alone), as summarized by the IPCC (Figure 3), it is likely smaller than the CO2 efficacy.

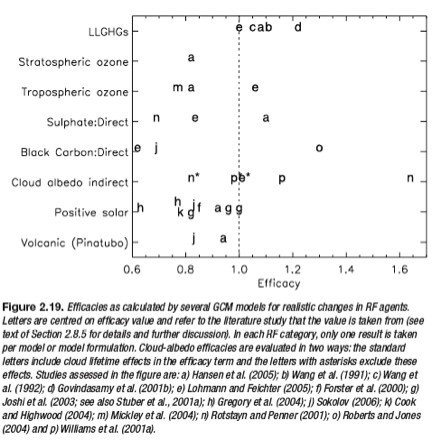
Figure 3: Efficacies of various radiative forcings as calculated in numerous different studies (IPCC 2007)
However, since there may be indirect solar effects not accounted for in the direct solar radiative forcing calculation, we'll conservatively estimate the solar climate sensitivity parameter as equal to the CO2 climate sensitivity of 0.8 (Wm-2K-1). Thus at equilibrium, the solar change would be expected to cause a 0.15°C increase in the average global surface air temperature. Simlar to the anthropogenic contribution, the best estimate of the solar contribution to the 1910-1940 warming in Meehl (2004) is approximately 0.1 to 0.15°C (Figure 4).

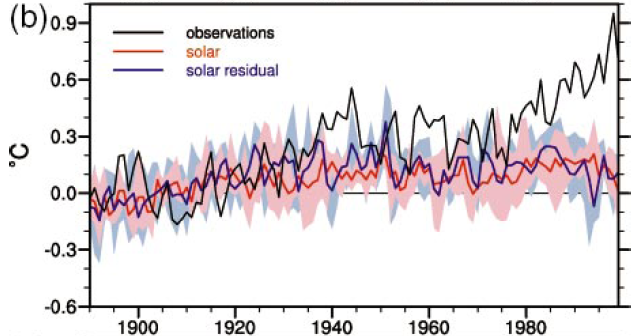
Figure 4: Climate model results from the solar forcing compared to observations (black line).
Other Forcings
CO2 and the Sun played the largest roles in the early century warming, but other factors played a part as well. For example, human aerosol emissions caused a slight cooling, ozone and other greenhouse gases caused a slight warming, low volcanic activity resulted in a slight warming, and natural cycles like the Atlantic Multidecadal Oscillation (AMO) may have contributed to the warming as well (Tett et al 2002). Meehl (2004) plots the net natural contribution to the warming in Figure 5.

Figure 5: Climate model results from all natural forcings compared to observations (black line).
Conclusion
The "skeptic" logic behind this argument is usually that if the early 20th Century warming was as large as the late century warming, and was natural, then the current warming could be natural as well.
Ultimately while natural forcings can account for much of the early 20th Century warming, humans played a role as well. Additionally, the early century warming wasn't as large or rapid as the late century warming, to which these natural factors did not contribute in any significant amount.
But more importantly, we don't assume that the current warming is caused by humans because it's "unprecedented" or faster and larger than previous natural warming events. We know the current warming is anthropogenic because that's what the physical evidence tells us.
NOTE: this post is also the Advanced rebuttal to "It warmed before 1940 when CO2 was low"

Arguments


Fresh water makes methane hydrate. It is methane emmissions we need to stop not CO 2.
Andrea Silverthorne
And STILL not accounting for the oceanic interdecadal variability, which is a good explanation for the 1940 blip and for part of the 2000's blip as well and this is what the current climate models are not accounting for. The models you cite do not reproduce this blip, and it definitely is a problem. It is NOT just about external forcing You should already be aware of that. Also, using linear relationships for temperature changes (delta T = lambda x delta F) is a gross oversimplification because we KNOW climate is nonlinear (and so are feedbacks). Just because the models do reproduce the last 30 years with the supposed sensitivity combined with human factors doesn't mean they would "know" what actually has happened.
[DB] There is no robust evidence (AFAIK) showing that oceanic cycles affect the global land+sea temperatures, as Tamino thoroughly shows (here and here for starters).

What's your reference for this? Are you referring to Swanson and Tsonis 2009?
DB, To be fair in your response to Protestant you claimed that Tamino showed that the AMO does not affect the global land-sea temperatures but that's not an accurate statement. Tamino's analysis there isn't great and I had a long drawn out "discussion" with him in the comments section if you'll notice. We agreed to disagree. A better discussion of the AMO is probably here: http://rankexploits.com/musings/2011/the-atlantic-multidecadal-oscillation-and-modern-warming/ and subsequently in the comments. All in all the AMO probably did contribute more to the mid century warmth than people give it credit but that was in addition to the other factors mentioned by Dana. Together they created the 1940s warming.
[DB] Robert, I accede to your judgement on this matter of the AMO. In that the referenced links above also considered other oceanic cycles (and other exogenous factors) that Tamino has studied, like the PDO, my comment was more dealing with overall picture. I have read & re-read your exchanges with Tamino & respect very much both of your opinions. I will also re-read the Rank Exploits post again.
Out of laziness I only referenced a few of the many Tamino posts on cycles. A search of the Open Mind site will reveal those; the rest can be found at the Archives (except for January and February 2010 posts).
You are courteous as always. Either way though, for me its not a big issue. I think that the 1940s are mostly irrelevant to the climate change we are dealing with now anyways. Explaining the 1940s warming using models just needs a little bit more fine tuning, i.e. ramp up one parameter versus another for example. I've often wondered how it is that modelers and some of my colleagues think that factors do not change how much they can contribute through time... i.e. maybe the reason the 1940s are not as well explained using models is because they rely on the response of the planet to be constant through time to a given factor (solar for example) when it very well may not be.
Either way, I agree that your response to protestant was probably the best approach because it deals with more than just the one factor. Better than just one like the one I *cherry-picked* as my pet project haha...
It seems that most proxies start climbing at the beginning of the XXth century and even before, and have achieved most of their growth by the 70's. When I compare with Fig 5., doesn't it seem to imply that this growth is essentially natural and not anthropic ?
[DB] You have interpreted the meaning of Fig 5 backwards. Look at it again.
Natural forcings simply do not explain the rise in temperatures we physically have measured to occur. Period.
Over at WUWT they recently highlighted a paper that suggest TSI may be even smaller than you are assuming here. Maunder Minimum to present would be something like 0.33-0.66 W/M2. I think that would mean solar forcing for the period you're interested in here is ~1/3 what you are suggesting. Which seems problematic for your calculations.
That will only work if magnetic variation is the primary driver of total solar irradiation, and from the language used in the paper this seems to be largely speculative.
Now I am curious to see where you are going with this. Are you arguing that neither CO2 nor the sun drives our climate?
DB#9, Marcus#11 : my question wasn't about the post-70 instrumental rise, but about the "hockey-stick" shape of all proxy curves, that start rising much before the 70's. Does it mean, yes, or not, that the pre-70 rise of proxies temperature reconstructions can only be natural and NOT anthropogenic, and if not, what can it be ?
[DB] Now I must ask you if you have actually read the source post for this thread. Pre-1940 warming is multi-factorial, per the referenced forcings. Do not conflate that somehow into "all proxies"; simply waving your arms in strawman fashion will not overturn the hockey stick shape of multiple temperature reconstructions. Keep in mind what Tamino had to say about hockeystick reconstructions in his guest post over at Real Climate:
"The truth is that whichever version of PCA you use, the hockey-stick shaped PC is one of the statistically significant patterns. There’s a reason for that: the hockey-stick shaped pattern is in the data, and it’s not just noise it’s signal."
"The hockey stick is so thoroughly imprinted on the actual data that what’s truly impressive is how many things you have to get rid of to eliminate it. There’s a scientific term for results which are so strong and so resistant to changes in data and methods: robust."
Peer-reviewed reconstructions and studies have consistently shown a multifactorial warming of the globe, with the graphed data taking the shape of a hockey stick. That natural factors post-1970 or so do not explain the rise in temperatures measured since then does not also mean the converse: that only natural factors explain the rise before it. That is a strawman and wrong.
If the solar forcing was less important in the early 20th century, does it mean that that warming was more due to GHG?
Dana, are we talking of the equilibrium warming, or of the ACTUAL warming in 1970 (taking into account the relaxation time towards equilibrium ?)
I don't see any significant anthropic temperature change before 1970 in your figure 1, so can you clarify this point ? where is the 0.64 °C anthropic warming in models ?
DB :
"Keep in mind what Tamino had to say about hockeystick reconstructions in his guest post over at Real Climate:
"The truth is that whichever version of PCA you use, the hockey-stick shaped PC is one of the statistically significant patterns. There’s a reason for that: the hockey-stick shaped pattern is in the data, and it’s not just noise it’s signal."
"The hockey stick is so thoroughly imprinted on the actual data that what’s truly impressive is how many things you have to get rid of to eliminate it. There’s a scientific term for results which are so strong and so resistant to changes in data and methods: robust.""
I understand that it is statistically significant and robust. BUT I asked if it was ANTHROPIC. You say that it "does not also mean the converse: that only natural factors explain the rise before it", but again, I see on Fig 1 that anthropic changes of temperature were almost zero before 1960, and that natural changes closely match observations before this date. If this doesn't mean that only natural factors explain the pre-1960 warming, what does it mean? i'm sorry , I may miss something really important, but I don't get your point at all.
Put in other words : can you give me the amplitude of the NATURAL component and of the ANTHROPIC component of the warming, between 1900 and 1960 ? you seem all to think that everything is perfectly clear, so I expect a simple answer to this simple question.
The CRU and Hadley SST indicate the 1910 to 1945 warming to be greater than the recent warming.
The figures in the article answer your question. Pre-1970, the roughly 0.3°C warming is approximately half natural and half anthropogenic.
ClimateWatcher:
The two hypotheses tend to contradict each other. If one maximizes the solar effect, this leaves little room for PDO/AMO warming in the early 20th century, thus little room for such an influence in the recent period - and we know the solar influence has been flat or negative (given the last decade) in the recent period.
If one minimizes the solar effect, this allows for some other forcing to explain the early century warming. Assuming anthropogenic attribution is precise, let's arbitrarily assign the rest to PDO/AMO. But then one has to explain why cooling in mid-century was very modest. If solar variation has little influence, and PDO/AMO "forcing" is significant, what kept temperatures up? If most of the early century warming was PDO/AMO, where was the same magnitude of cooling? And why hasn't it cooled in the last decade? Why has global mean temperature shot up over the last 100+ years through complete ocean cycles?
The magnitude of solar forcing does indeed have a fair amount of uncertainty. It's interesting to see contrarians start to move away from solar variation, which presumably has something to do with a very deep recent solar minimum, which has failed to reduce global mean temperature as hypothesized. But then they're back to trying to explain MWP/LIA. Fred Singer would not approve.
The PDO/AMO indexes correspond with ENSO variation. In the late 70's, we had a transition from more la Ninas to more el Ninos. Much of the short-term trend over that period can be explained by that transition (similar to the early 1940's activity), but nothing more, and we've had a transition back since then, but strong warming over the entire period.
We are using different periods,
but certainly for SST data you can compare
the greater warming rate of 1910-1945 (0.41C),
with the slightly lesser warming rate from 1975-2010 (0.39C)
GISS land/sst of course does indicate a lesser Early Twentieth Century warming than contemporary, but the CRU, missing from your chart, does not.
CW #23 - The planet is made up of both land and oceans. Please stop cherrypicking whichever is most convenient for you to make your incorrect argument.
The point is the peer-reviewed work (GRL I think) not that it shows up on WUWT, deal with it on that basis.
13 IanC
The point would be that changes in TSI do seem to be too small to account for climate variability in the way we seem to understand it. What can I say, I'm trying to look at the science. There has been a constant revision of our understanding of TSI variation. Somebody can correct this if inaccurate, estimates of changes in TSI from MM to present have undergone constant revision. 3-6 W/M2 in the late 1990's. 1-2 W/M2 more recently. And now this paper is suggesting it's ~1/3 of that amount (0.33-0.66 W/M2). I think if your going to use the word speculative then you should put it into context. The short history of this science is one of constant revision as I've outlined, I don't see that this is any more speculative than the other. I think the unique approach is to say magnetitic variation is the sourse of other solar variations, I guess we have to wait and see whether that is accepted.
"Now I am curious to see where you are going with this. Are you arguing that neither CO2 nor the sun drives our climate?"
It does seem curious. I don't think one has to jump all the way to the idea that CO2 or the sun don't drive our climate but I think it's worth considering that of our understanding of the subject is missing something important. Ian if that work is accurate how would you interpret it?
"HR and Kooti - it's entirely possible that less than 0.15°C of the early 20th century warming is due to solar effects. I don't see that as problematic"
That seems a little cavalier. Do you accept that what Kooiti says is accurate? As he points out those estimates of solar variability you are using are already out of date even ignoring the new paper I pointed out. You write an article that says roughly half the warming is from solar then suggest even if this is not true it really doesn't matter. I don't get that.
I've got a few separate technical questions.
1) What was the magnitude of warming from 1910-1940, you didn't state it? I'm assuming you think it's 0.3oC (half from CO2, half from solar) but this graph, from the climate graphics page, puts it around 0.5oC. Maybe those extra 0.2oC don't really matter as well?
2) Are you assuming the earth came to equillibrium in this period? Is past articles you have suggested that we may have only realised 33% of the warming associated with the post-1950 forcing. Yet here all warming has been accounted for from the forcing in these 40 short years. Can you explain this discrepancy?
Dana's chart (taken from my post) does include Cru. Cru=Hadley which is HadCrut (Land/ocean).
Before you speak. Think.
in other words : do the proxies show something unusual associated with the anthropogenic component, or not ?
Really a stunning statement , in my sense : I do not any field of science where this would be qualified as a "pretty stark difference" given the number of different factors that can interfere and the complexity of the system - usually the qualitative difference are measured by a number of sigma above the natural variability (Signal to Noise ratio).
A few things Gilles-first of all, proxies don't cover nearly as much of the planet's surface as direct measurement of temperature does-so that automatically makes direct measurement preferable over proxies. 2nd, we already know that proxies which rely on dendrochronology have proven very unreliable post-1960, due to drought conditions in many of the proxy sites causing a reduction in tree-ring size that makes it look like cooling-so again, this makes direct temperature measurements more reliable than proxies, & direct temperature measurements show a *massive* increase
in the rate of global temperature rise.
Its not a stunning statement at all, Gilles, only to people like yourself who refuse to accept the link between GHG's & Global Warming. Funny how Signal to Noise ratio never stops Denialists like yourself from claiming cooling trends over time periods as short as 3-5 years (even when plotting the data shows no such thing). In each case, I'm relying on over 400 data points (about 420 months) to draw my graph-that does a huge amount to reduce the signal to noise ratio-& what we're clearly left with is a *much* faster rate of warming in the period of 1980-2010 as compared to the period of 1910-1940, in *spite* of a lack of an obvious forcing for the 1980-2010 warming period (in fact, solar forcings are declining during that period). So come on, Gilles, stop your hand waving & tell us-what's causing this rapid warming if solar forcings are in decline?
I see that the "hockey stick" of proxy reconstruction is pretty well defined before 1960 - so just forget about the post-1960 data, and please give me an answer to my simple (again) question : if the shape of proxy reconstruction before 1960 is "reliable" , was it mainly controlled by anthropogenic influence or by natural ones?
there is a second question : if proxies have "prove to be very unreliable" post-1960, how do you prove they were reliable before 1900 ?
concerning the " *much* faster rate of warming in the period of 1980-2010 as compared to the period of 1910-1940", it is not by repeating it constantly that it will become true : I still do not know any field of science where two measurements (as precise as they may be) giving a slope of respectively 0.12 and 0.17 °C/decade would be qualified as "very different". We're talking of an approximate indicator (the average surface temperature has *no* clear physical meaning in any equation of physics) of a highly complex and non linear system with ill-known cycles , not of a precise measurement of fine structure constant by high accuracy laboratory measurements. and the 0.12 °C /decade was also "much higher" than the previous centuries, if I believe in "very reliable" proxies before 1900. So how do you explain this "much higher value" of 1900-1940 slope with respect to the previous time intervals ?
Why do you think I should know the answer? believing we should answer any question at any moment is a religious attitude (religions explain also everything !) , not a scientific one. Can you answer the question of what has caused the rapid warming between 1900 and 1940, compared to previous epochs?
to your question, "how do you prove they were reliable before 1900 ?"
This is getting somewhat off-topic, but still has something to do with temperature. But when discussing 'proof' in an uncertain science, it is much more reasonable to use terms like 'degrees of certainty' or 'confidence'. There is no way to 'prove' that tree rings are exact matches for temperature, but the degree of confidence is given to dendro-proxies by how well they match up with other proxies. Does that mean that the entire sequence is definitely correct for that particular Briffa proxy? No. That is why you see the larger error bars around the warm periods.
I found this review paper to be helpful in understanding the issues surrounding divergence.
The reason why I feel the paper is particularly speculative is because the authors' argument is essentially this: other reconstructions of TSI disagree, and since we feel that the sun is as quiet as it can be can, the condition at MM should be similar to the present day. I don't see the authors addressing why this estimation is necessarily better than the others, nor do they address why the other reconstructions disagree. There must be some different physics that goes behind those constructs, so can those differences be ignored altogether as I think the authors are doing? But as you said, we probably have to wait to see what the conclusions are in a few years.
Now to answer your question. If the theory is indeed correct, it doesn't affect our understanding of CO2 as a greenhouse gas. The implication will be that the climate is more sensitive to forcing changes than we know. It will also remove any hopes that the sun will enter another MM-like phase and bring in another little ice age to counteract the effects of anthropogenic CO2. In addition, the change in the solar forcing is by no means large enough to suggest that there is some unaccounted for process going on to cause the 1900-1940 warming.
This divergence talk should be in a divergence thread, but I will respond to this last comment and then let it go. No, I do not think it is very uncertain to use them as evidence for past temperature. I think specifically Briffa's proxy for estimating temperature over specific time scales is somewhat uncertain. But it doesn't matter what I think, and that's the good news. The experts are very aware of this issue and are working to come to an agreement. The bad news is that until that is done, there will considerable disagreement on how to inform the public of this uncertainty, while portraying the best possible answers to certain questions. Other than Richard Alley and the late Steven Schneider, most climate scientists aren't experts in this regard. Dendro people are dendro experts. There are certain choices made in charts that reasonable people can disagree on how to display. This is definitely the case with multiproxy reconstructions. If you want to discuss those options, please do it in a relevant thread.
I think you should keep in mind that 1) not all tree ring records show divergence. It is geographically limited. 2) temperature records have been reconstructed from other proxy data as well.
I found this link helpful:
http://www.skepticalscience.com/Tree-ring-proxies-divergence-problem.htm
Figure 2d of Meehl et al 2004 will give you the answer: mostly natural, small anthropogenic contribution. The same thing cannot be said for post 1960.
So you're saying that if you look at the following curve , before 1960, i.e. by hiding the post-1960 part (I could wipe off the last half century if you have no finger to do it), then, the shape is perfectly natural and can be produced only by natural variability ?
is it right ?
There is no such thing as a "natural shape". The shape does not tell us whether it is natural or not. That can only be obtained via understanding of the underlying physics and forcings that are involved. That is precisely what the scientific literature does (and what this post discusses).