


 Arguments


What this means:
- If a hurricane threatens our coasts this summer and fall, you can come here for the coverage you trust.
- We’ll be here to help you understand what’s happening with FEMA, NOAA, and other agencies under the Trump administration.
- We’ll be able to keep more people safe with our alerts to communities in the path of extreme weather — both in English and Spanish.
The support from our audience is beyond our wildest dreams and gives us confidence that our reporting resonates with people in a media landscape increasingly wracked by disinformation. YOU built this, and it’s an honor to create a more activated, climate-aware world alongside our donors.
And this is truly people-powered journalism: The median donation was $50, and 84% of donations were under $100. Our number of sustaining monthly supporters was multiplied by six, which helps us plan our coverage and retain superstar writers. We’re so grateful to everyone who has signed on as a sustaining donor. Will you join them?
Rebutting 33 False Claims About Solar, Wind, and Electric Vehicles - Recap
Posted on 24 June 2025 by BaerbelW
A week ago today, we published a blog post highlighting Sabin Rebuttal #33, which answers the question "What is the effect of hot or cold weather on EVs?". With that blog post, this phase of our effort to turn the report "Rebutting 33 False Claims About Solar, Wind, and Electric Vehicles" into individual rebuttals was done and dusted. In this recap we summarize the happenings and provide some behind-the-scenes glimpses into the tasks needed to pull this off. The report was written by Matthew Eisenson, Jacob Elkin, Andy Fitch, Matthew Ard, Kaya Sittinger & Samuel Lavine and published by the Sabin Center for Climate Change Law at Columbia Law School in 2024.

Climate Adam - Silencing Science: Trump's War on Our Climate
Posted on 23 June 2025 by Guest Author
This video includes personal musings and conclusions of the creator climate scientist Dr. Adam Levy. It is presented to our readers as an informed perspective. Please see video description for references (if any).
Since President Trump took office in January 2025, he's declared war on climate change research. In this video, I speak with three expert scientists, who explain the devastation caused by Trump's attacks on climate researchers, institutions and reports. These assaults aren't just a huge deal in the USA, where they limit our ability to forecast extreme weather disasters. But they'll also affect our ability to be safe from climate extremes the world over - now and in the future.
Support ClimateAdam on patreon: https://patreon.com/climateadam
2025 SkS Weekly Climate Change & Global Warming News Roundup #25
Posted on 22 June 2025 by BaerbelW, Doug Bostrom
Stories we promoted this week, by category:
Climate Science and Research (6 articles)
- Climate Crisis 'Evil Twin' Is Coming for Marine Life Scientists have warned that the planet crossed the global boundary for ocean acidification around the year 2020, according to a new study. Newsweek, Thomas Westerholm, Jun 16, 2025.
- Human influence on climate detectable in the late 19th century A new paper describes how humans were influencing Earth's climate by cooling the stratosphere in the late 19th century. Proceedings of the National Academies of Sciences, Ben Santer et al. , June 16, 2025.
- Study finds planetary waves linked to wild summer weather have tripled since 1950 Phys.org, Seth Borenstein (AP), Jun 17, 2025.
- Why imperfect climate models are more helpful than you think Even flawed models are helping scientists unlock new truths about our changing planet. Yale Climate Connections, Ryan O’Loughlin, Jun 17, 2025.
- Guest post: Why 2024`s global temperatures were unprecedented, but not surprising Human-caused greenhouse gas (GHG) emissions in 2024 continued to drive global warming to record levels. Carbon Brief, Piers Forster and Debbie Rosen, Jun 18, 2025.
- Skeptical Science New Research for Week #25 2025 Our latest listing of research on anthropogenic climate change, how it's changing our lives now, and how we'll deal with the problem we've created. Skeptical Science, Doug Bostrom & Marc Kodack, Jun 19, 2025.
Climate Policy and Politics (6 articles)
- What the Nation Stands to Lose Without climate.gov Council on Strategic Risks, Center for Climate and Security, June 11, 2025.
- How Trump`s assault on science is blinding America to climate change E&E News, Politico, Scott Waldman, Jun 16, 2025.
- The World`s Banks are Still Betting on Fossil Fuel Industry Growth The biggest funders of fossil fuel expansion are U.S. banks that, like those in other countries, are retreating on their climate commitments. Inside Climate News, Georgina Gustin, Jun 17, 2025.
- Voters Are Concerned About Rising Costs and Think Climate Change Will Financially Affect Them This report illustrates a growing split between US voters and leadership of the federal government on how matters of energy and climate are being handled. Data For Progress, Brynne Robbins and Elias Kemp, June 17, 2025.
- Trump cuts to NOAA, NASA 'blinding' farmers to risks, scientists warn TheHill.com, Saul Elbein, Jun 18, 2025.
- NOAA`s climate information portal to go silent The Trump adminstration continues to efficiently generate synthetic ignorance. E&E, Politico, Daniel Cusick, Jun 18, 2025.
Fact brief - Is modern warming just a rebound from the Little Ice Age?
Posted on 21 June 2025 by Sue Bin Park
![]() Skeptical Science is partnering with Gigafact to produce fact briefs — bite-sized fact checks of trending claims. You can submit claims you think need checking via the tipline.
Skeptical Science is partnering with Gigafact to produce fact briefs — bite-sized fact checks of trending claims. You can submit claims you think need checking via the tipline.
Is modern warming just a rebound from the Little Ice Age?
 Global temperatures are warmer today than immediately before the Little Ice Age.
The Little Ice Age was a regional cooling phenomenon caused by internal forcings that mostly moved heat around within Earth’s climate system.
This event affected North America and Europe from 1350 to 1850. While external forcings like volcanic eruptions and decreased solar activity occurred, it was a massive export of Arctic sea ice into the North Atlantic by warm currents that disrupted ocean circulation and triggered prolonged regional cooling.
The end of the Little Ice Age coincided with rising solar output and industrial greenhouse gas emissions. However, since the 1950s, solar activity has declined while global temperatures have increased.
Today’s warming is driven by human emissions, increasing the amount of heat in the system rather than redistributing it.
The late 20th century is the warmest interval in the last 2,000 years for over 98% of the globe.
Go to full rebuttal on Skeptical Science or to the fact brief on Gigafact
This fact brief is responsive to quotes such as this one.
Sources
University of Massachusetts Winter Is Coming: Researchers Uncover the Surprising Cause of the Little Ice Age
Eos The Little Ice Age Wasn’t Global, but Current Climate Change Is
Journal of Geophysical Research Global warming in the context of the Little Ice Age
Salon What climate change deniers get totally wrong about the Little Ice Age
Science Global Signatures and Dynamical Origins of the Little Ice Age and Medieval Climate Anomaly
Nature No evidence for globally coherent warm and cold periods over the preindustrial Common Era
Show your Stripes Day on June 21 2025
Posted on 20 June 2025 by BaerbelW, Doug Bostrom
Every year on 21st June we encourage everyone to participate in "Show your Stripes Day" to start conversations about climate risks and solutions. Springboarding from a crocheted blanket created by fellow University of Reading professor Ellie Highwood, the "warming stripes" graphic was created in 2018 by Prof. Ed Hawkins, who explains the visualization's purpose in this video:
The "warming stripes" have been embraced around the world as a clear and vivid representation of how the climate is changing-- a powerful appeal to urgency in addressing our climate crisis.
From the website of the University of Reading:
What is Show Your Stripes Day?
Show Your Stripes Day is a global moment to share our concern about how the climate is changing and the need for urgent action.
We ask everyone to share the famous “warming stripes”, a powerful visual representation of how temperatures have increased around the world since the industrial revolution. Created by climate scientist Professor Ed Hawkins at the University of Reading, each stripe represents one year. The colours transition from cool blues to warm reds to represent the increases in temperature seen throughout the past 150 years or more.
On 21 June we call on individuals, businesses, and cities around the world to highlight their local climate stripes and share the powerful message they convey.
Why is it important?
Show Your Stripes Day provides a simple, yet impactful way to communicate the reality of climate change. By condensing decades of temperature data into a series of recognisable stripes, it makes understanding global warming accessible to all, from being able to recreate the stripes in schools, to sharing local stripes across social media.
The stripes have also been important for striking up global conversations. In the past, on this day, they have been displayed in a wide range of prominent public spaces, from Times Square, New York, to the While Cliffs of Dover, UK. By displaying the stripes in locations worldwide, people have been inspired to download and share the stripes online and help spread their message.
2024 was the warmest year on record globally. Extreme weather events continue to be seen more frequently around the world. Never has the need to address climate change been more urgent.
Skeptical Science New Research for Week #25 2025
Posted on 19 June 2025 by Doug Bostrom, Marc Kodack
Open access notables
Human influence on climate detectable in the late 19th century, Santer et al., Proceedings of the National Academy of Sciences
When could scientists have first known that fossil fuel burning was significantly altering global climate? We attempt to answer this question by performing a thought experiment with model simulations of historical climate change. We assume that the capability to monitor global-scale changes in atmospheric temperature existed as early as 1860 and that the instruments available in this hypothetical world had the same accuracy as today’s satellite-borne microwave radiometers. We then apply a pattern-based “fingerprint” method to disentangle human and natural effects on climate. A human-caused stratospheric cooling signal would have been identifiable by approximately 1885, before the advent of gas-powered cars. Our results suggest that a discernible human influence on atmospheric temperature has likely existed for over 130 y.
Facebook algorithm’s active role in climate advertisement delivery, Sankaranarayanan et al., Nature Climate Change
Climate advertising on social media can shape attitudes towards climate change. Delivery algorithms, as key actors in the climate communication ecosystem, determine ad audience selection and might introduce demographic bias. Here, we present a two-part study—an observational analysis (n = 253,125) and a field experiment (M = 650)—to investigate algorithmic bias in Facebook’s climate ad dissemination. Our findings provide preliminary evidence that the algorithm’s selection of ad audiences can be explained by factors such as ad content, audience location (US states), gender and age group. Moreover, the cost-effectiveness of contrarian ads is linked with the conservative political alignment of a state, while the cost-effectiveness of advocacy ads correlates with liberal political alignment, higher population and per-capita gross domestic product; ad targeting strategies further modulate these effects. The skew in the distribution of climate ads across US states, age groups and genders reinforces existing climate attitudes.
Political differences in climate change knowledge and their association with climate attitudes, behavior, and policy support, Stockus and Zell, Journal of Environmental Psychology
Liberals are more likely to believe that climate change is a serious matter that requires immediate action than conservatives. Nonetheless, little is known about why this political difference in attitudes occurs. We tested whether liberals have superior knowledge about climate change than conservatives and whether political differences in knowledge are associated with climate attitudes (total N = 649, Prolific). In a U.S. sample, Study 1 found that Democrats had better knowledge about climate change than Republicans. Additionally, there was an indirect association of political party with climate attitudes and support for climate policies through knowledge. Study 2 replicated these findings and found a similar indirect association with climate change mitigation behaviors. Study 3 partially replicated the above effects in the UK. Although limited by use of cross-sectional designs, these data suggest that knowledge about climate change is associated with political differences in climate attitudes, behavior, and policy support.
How media competition fuels the spread of misinformation, Amini et al., Science Advances
Competition among news sources over public opinion can incentivize them to resort to misinformation. Sharing misinformation may lead to a short-term gain in audience engagement but ultimately damages the credibility of the source, resulting in a loss of audience. To understand the rationale behind news sources sharing misinformation, we model the competition between sources as a zero-sum sequential game, where news sources decide whether to share factual information or misinformation. Each source influences individuals based on their credibility, the veracity of the article, and the individual’s characteristics. We analyze this game through the concept of quantal response equilibrium, which accounts for the bounded rationality of human decision-making. The analysis shows that the resulting equilibria reproduce the credibility-opinion distribution of real-world news sources, with hyperpartisan sources spreading the majority of misinformation. Our findings provide insights for policymakers to mitigate the spread of misinformation and promote a more factual information landscape.
From this week's government/NGO section:
[By chance this edition's collection includes a group of reports particularly indicative of general and significant misalignment between priorities of politicians versus the people they serve.]
Climate Change in the American Mind: Politics & Policy, Spring 2025, Leiserowitz et al., Yale University and George Mason University
This report is based on findings from a nationally representative survey. Interview dates: May 1 -12, 2025. Interviews: 1,040 adults (18+), 915 of whom are registered to vote. Average margin of error for registered voters: +/- 3 percentage points at the 95% confidence level. 52% of registered voters think global warming should be a high or very high priority for the president and Congress. 64% of registered voters think developing sources of clean energy should be a high or very high priority for the president and Congress. Majorities of registered voters support a range of policies to reduce carbon pollution and promote clean energy. These include, 88% support federal funding to help farmers improve practices to protect and restore the soil so it absorbs and stores more carbon; 80% support funding more research into renewable energy sources; 75% support regulating carbon dioxide as a pollutant; 71% support tax credits or rebates to encourage people to buy electric appliances, such as heat pumps and induction stoves; 67% support transitioning the U.S. economy from fossil fuels to 100% clean energy by 2050 ; and 63% support requiring fossil fuel companies to pay for the damages caused by global warming.
New Zealand at climate change crossroads, AMI, State and NZI, IAG New Zealand
New Zealanders are expecting more extreme weather events as a result of climate change. They want more to be done to reduce the risks and costs of these events to help keep insurance affordable and available. 90% of New Zealanders anticipate more extreme storms, 89% foresee more frequent and intense flooding, and 88% expect coastal flooding due to rising sea levels. As New Zealanders brace for a future shaped by more frequent and severe climate events, many expect the cost of these events to be reflected in insurance premiums.
Voters Are Concerned About Rising Costs and Think Climate Change Will Financially Affect Them, Brynne Robbins and Elias Kemp, Data for Progress
Voters nearly universally believe that energy and environmental issues are important to address. This holds across party lines: 95% of Democrats, 94% of Independents, and 88% of Republicans indicate that energy and environmental issues are either important or a top priority to them. However, the degree of importance varies significantly with party affiliation. Nearly half (49%) of Democrats say energy and environmental issues are a top priority, while only a third (33%) of Independents and just under a quarter (23%) of Republicans feel the same. When asked whether they believe climate change will have a direct financial impact on them and their family, a majority (58%) of likely voters say it will impact them either greatly or somewhat. Democrats most commonly believe this, with 73% saying that they will be either greatly or somewhat impacted, while only 41% of Republicans believe the same. Just 52% of white voters predict they’ll be impacted, compared with 64% of Black voters and 73% of Latino voters. Women (62%), voters under 45 (66%), and voters with a college degree (60%) also predict greater financial impact.
Two-thirds of Canadians favour developing clean energy over fossil fuels, while 85% wish to maintain or increase federal climate action, Abacus Data, Clean Energy Canada
Two-thirds of Canadians say they would prioritize clean over conventional energy. Specifically, 67% of respondents say that, assuming both were priorities, they would generally favor clean energy projects such as critical minerals, renewable power and transmission, and energy storage. The remaining 33% would prefer conventional fossil fuel projects like oil and gas, including LNG development. Asked how crucial the two energy sectors will be to the Canadian economy over the next decade, 87% say clean energy will be very (45%) or pretty (42%) important, while 83% say fossil fuels will be very (36%) or pretty (47%) important. In other words, the four-point advantage for clean energy increases to nine points among those who see at least one of these sectors as “very important.”
156 articles in 66 journals by 932 contributing authors
Physical science of climate change, effects
Observation-based estimate of Earth’s effective radiative forcing, Van Loon et al., Proceedings of the National Academy of Sciences Open Access 10.1073/pnas.2425445122
The role of aerosol declines in recent warming
Posted on 18 June 2025 by Zeke Hausfather
This is a re-post from The Climate Brink
Over at Carbon Brief I have a new detailed explainer on aerosols. They have a major (but poorly constrained) cooling effect on the climate, masking about 0.5C warming from CO2 and other greenhouse gases that would otherwise have occurred.
However, we are rapidly reducing both aerosol emissions and their resulting climate cooling effect. Global emissions of SO2, the most important aerosol, have fallen by 40% since the mid?2000s. China has cut its SO2 emissions more than 70% over the same period.
This is a good thing; SO2 is a major precursor to PM2.5, which is responsible for millions of deaths from outdoor air pollution worldwide. But reductions to clean the air are quickly unmasking more warming from our past greenhouse gas emissions.
While the Carbon Brief piece goes into quite a bit of detail about how aerosols influence the climate and how emissions have changed over time, I thought readers here would be particularly interested in the novel part of the piece where I estimate the global temperature impact of these recent reductions.
Sabin 33 #33 - What is the effect of hot or cold weather on EVs?
Posted on 17 June 2025 by Ken Rice
On November 1, 2024 we announced the publication of 33 rebuttals based on the report "Rebutting 33 False Claims About Solar, Wind, and Electric Vehicles" written by Matthew Eisenson, Jacob Elkin, Andy Fitch, Matthew Ard, Kaya Sittinger & Samuel Lavine and published by the Sabin Center for Climate Change Law at Columbia Law School in 2024. Below is the blog post version of rebuttal #33 based on Sabin's report.
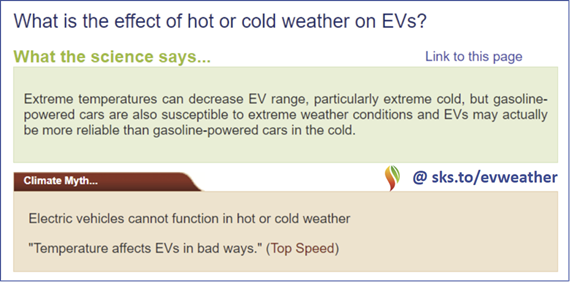
Extreme temperatures can decrease EV range, particularly extreme cold, but this issue is not unique to EVs. According to a 2019 American Automobile Association report, when compared to conditions of 75°F with the HVAC set to Off, a typical EV’s range decreased by 12% at 20°F, and by 4% at 95°F1. When comparing conditions with the HVAC set to Auto, a temperature drop from 72°F to 20°F decreased a typical EV’s range by 41%2, and a temperature rise from 72°F to 95°F decreased range by 17%. However, EV models are increasingly adopting heat pump technology in place of traditional electric resistance heating3, which can minimize the electricity consumption associated with heating an electric vehicle in extreme cold4.
Traditional gasoline-powered cars are likewise susceptible to extreme weather conditions. Fuel economy tests have also shown a decrease in mileage per gallon for conventional gasoline cars due to temperature drops, with mileage roughly 15% lower at 20°F than at 72°F5. As with EVs, decreased fuel efficiency for conventional gasoline cars in extreme weather is partially attributable to increased reliance on HVAC systems. Both EVs and gasoline-powered cars are likewise susceptible to cold temperatures lowering tire pressure6.
Data from a roadside assistance company in Norway suggests that, by one metric, EVs may actually be more reliable than gasoline-powered cars in the cold7. In particular, whereas internal combustion engines sometimes have trouble starting in the cold, this problem appears to be less common for EVs: while 23% of cars in Norway are EVs, only 13% of reported cases involving cars that failed to turn on in the cold were EVs8.
10 ways that Trump’s tax bill would undermine his energy promises
Posted on 16 June 2025 by dana1981
This is a re-post from Yale Climate Connections
President Donald Trump has promised to reduce gas prices, improve energy security, create domestic manufacturing jobs, boost the economy, and ensure that Americans breathe the cleanest air. But by gutting the Inflation Reduction Act, or IRA, Congress’ big new budget bill would undermine all of these objectives – and more.
House Republicans’ top two priorities are to extend the soon-to-expire tax cuts that they passed in 2017, and to minimize the amount that doing so will add to the nation’s over $36 trillion in debt. The massive budget bill they narrowly passed in May is their effort to achieve both.
The Congressional Budget Office estimated that the House bill’s proposed tax cuts would add about $4.5 trillion to the debt over the next decade – more than a 12% increase from today’s levels.
To pay for some of those tax cuts, the House bill would repeal most of the IRA’s climate and clean energy investments. The IRA, passed by Democrats in 2022, committed hundreds of billions of dollars to developing clean energy and fighting climate change.
The Congressional Budget Office estimated that the proposed repeal of climate and clean energy investments would shave $567 billion off the tax bill’s additions to the national debt. But repealing those investments would also come at a cost.
Eight groups have analyzed the specific impacts the tax bill’s IRA repeal would have on Americans. Three – at Princeton, Energy Innovation (a Yale Climate Connections content-sharing partner), and Rhodium Group – evaluated the impacts of the entire bill, while five others – Aurora Energy Research, Resources for the Future, Brattle Group, National Economic Research Associates, and Solar Energy Industries Association – looked specifically at the repeal of the IRA’s clean electricity tax credits.
The results were consistent in finding that Republicans’ proposed IRA repeal would increase household energy bills, imperil a nascent domestic manufacturing boom, raise the risks of power outages, disadvantage artificial intelligence development U.S., and increase pollution at the expense of the health of U.S. residents – all outcomes that undermine Trump’s stated goals.
A number of Republican Senators have expressed discomfort with the handling of clean energy in the House bill and may make significant changes in their version.
2025 SkS Weekly Climate Change & Global Warming News Roundup #24
Posted on 15 June 2025 by BaerbelW, Doug Bostrom
Stories we promoted this week, by category:
Climate Science and Research (8 articles)
- Stefan Rahmstorf - Atlantic ocean circulation: a dangerous tipping point for European climate? IFIMAC on Youtube, Stefan Rahmstorf, May 27, 2025.
- Ocean mud locks up much of the planet’s carbon – we’re digging deep to map these ancient stores Deep down at the bottom of the sea, mud is one of the most important natural archives of Earth’s past – holding clues of shifting climates, coastlines, ocean conditions and carbon storage. The Conversation, Sophie Ward & Zoe Roseby, June 6, 2025.
- When will a vital system of currents in the Atlantic Ocean collapse? Depends on whom you ask. New research suggests the currents that help shape the climate may be weakening more slowly than thought. Grist, Rebecca Egan McCarthy, Jun 09, 2025.
- Ocean acidity crosses vital threshold, study finds TheHill.com Just In, Saul Elbein, Jun 09, 2025.
- The role of aerosol declines in recent warming SO2 declines have contributed ~25% of recent warming and driven recent acceleration. The Climate Brink, Zeke Hausfather, Jun 10, 2025.
- Ocean current `collapse` could trigger `profound cooling` in northern Europe - even with global warming A “collapse” of key Atlantic ocean currents would cause winter temperatures to plunge across northern Europe, overriding the warming driven by human activity, which seems a good reason not to accidentally break the AMOC. Carbon Brief, Cecilia Keating, Jun 11, 2025.
- Skeptical Science New Research for Week #24 2025 A weekly digest of recently published research on matters of human-caused climate change, how we'll fix Earth's climate and/or learn to live with the mess we've made. Skeptical Science, Doug Bostrom & Marc Kodack, Jun 12, 2025.
- New Climate Study Highlights Dire Sea Level Warmings To learn about how polar ice sheets melted during an ancient era, scientists examined fossil coral reefs in the tropics. Inside Climate News, Bob Berwyn, Jun 13, 2025.
Fact brief - Was 1934 the hottest year in the global record?
Posted on 14 June 2025 by Sue Bin Park
![]() Skeptical Science is partnering with Gigafact to produce fact briefs — bite-sized fact checks of trending claims. You can submit claims you think need checking via the tipline.
Skeptical Science is partnering with Gigafact to produce fact briefs — bite-sized fact checks of trending claims. You can submit claims you think need checking via the tipline.
Was 1934 the hottest year in the global record?
1934 was a particularly hot year in the contiguous United States, but not globally exceptional. Worldwide, 1934 was a relatively cooler year and does not stand out in the global record.
The myth began when NASA corrected 6 years of erroneous U.S. temperature data in 2007, shifting 1934 ahead in the U.S. dataset due to earlier calculation errors. Adjustments accounted for factors like time-of-observation bias and weather station changes. Regionally, 1934’s U.S. heat was part of the Dust Bowl, a crisis caused by drought and poor land management.
However, while regional temperature spikes occur naturally, global climate change concerns long-term and worldwide trends.
Global temperatures have risen since the Industrial Revolution, driven by human emissions of greenhouse gases. The ten hottest years on record were between 2015 and 2025. 1934 saw a global temperature anomaly of -0.16 C, while 2024’s record high was 1.28 C above the 20th century average.
Go to full rebuttal on Skeptical Science or to the fact brief on Gigafact
This fact brief is responsive to quotes such as this one.
Sources
National Drought Mitigation Center The Dust Bowl
World Meteorological Organization State of the Global Climate 2024
The Climate Brink Which was warmer: the 1930s or the last 10 years
PolitiFact 1936 in the United States was “much hotter than 2023."
EPA Climate Change Indicators: U.S. and Global Temperature
NASA Evidence


