


 Arguments


Explaining climate change science & rebutting global warming misinformation
Global warming is real and human-caused. It is leading to large-scale climate change. Under the guise of climate "skepticism", the public is bombarded with misinformation that casts doubt on the reality of human-caused global warming. This website gets skeptical about global warming "skepticism".
Our mission is simple: debunk climate misinformation by presenting peer-reviewed science and explaining the techniques of science denial, discourses of climate delay, and climate solutions denial.


Have renewables decreased electricity prices?
Posted on 23 July 2025 by Zeke Hausfather
This is a re-post from The Climate Brink
There is a persistent argument in certain circles that renewable energy is associated with higher costs than fossil fuels, and that states who have build lots of renewables (California is often brought up in this regard) are paying for it in the form of higher electricity prices.
Variable renewable energy – wind and solar – are fundamentally fuel-saving resources. They are effectively zero marginal cost to run when the wind is blowing and the sun is shining, and can reduce the need to run costly gas and coal capacity. As utility scale battery storage scales up, some fossil plants may be fully retired, though much of our current gas capacity will likely remain utilized at lower capacity factors to deal with seasonal variability in renewable output or extended periods of low generation.1
My colleague Andrew has published a number of Climate Brink posts over the past year on how the deployment of renewable energy can lower electricity costs. I thought I would add some empirical evidence: specifically, how the large-scale build out of renewables across the United States has impacted electricity prices over the past 24 years.2
While there have been a number of analyses published showing the relationship between average electricity prices and percentage of renewable generation (including in Andy’s tCB post earlier this year), the approach taken by these is somewhat imperfect. There are many structural factors (e.g. fuel transport costs to Hawaii, wildfire management in California) that result in high baseline state electricity prices somewhat independent of their renewable generation.
A more robust approach is to look at how the change in electricity prices is correlated with the change in renewable generation (as a % of total generation) over time; this better (but still imperfectly) isolates the effects of renewable build-outs vs other factors.
The figure below shows the change in electricity prices between 2001-2024 on the y-axis, and the change in the % generation from utility-scale3 non-hydro renewables4 on the x-axis. There is a reasonably strong negative relationship between the two – states that have added more renewables have seen smaller increases in electricity prices – but it falls a tad short of statistical significance (e.g. we have ~88% confidence in the effect rather than >95% confidence).
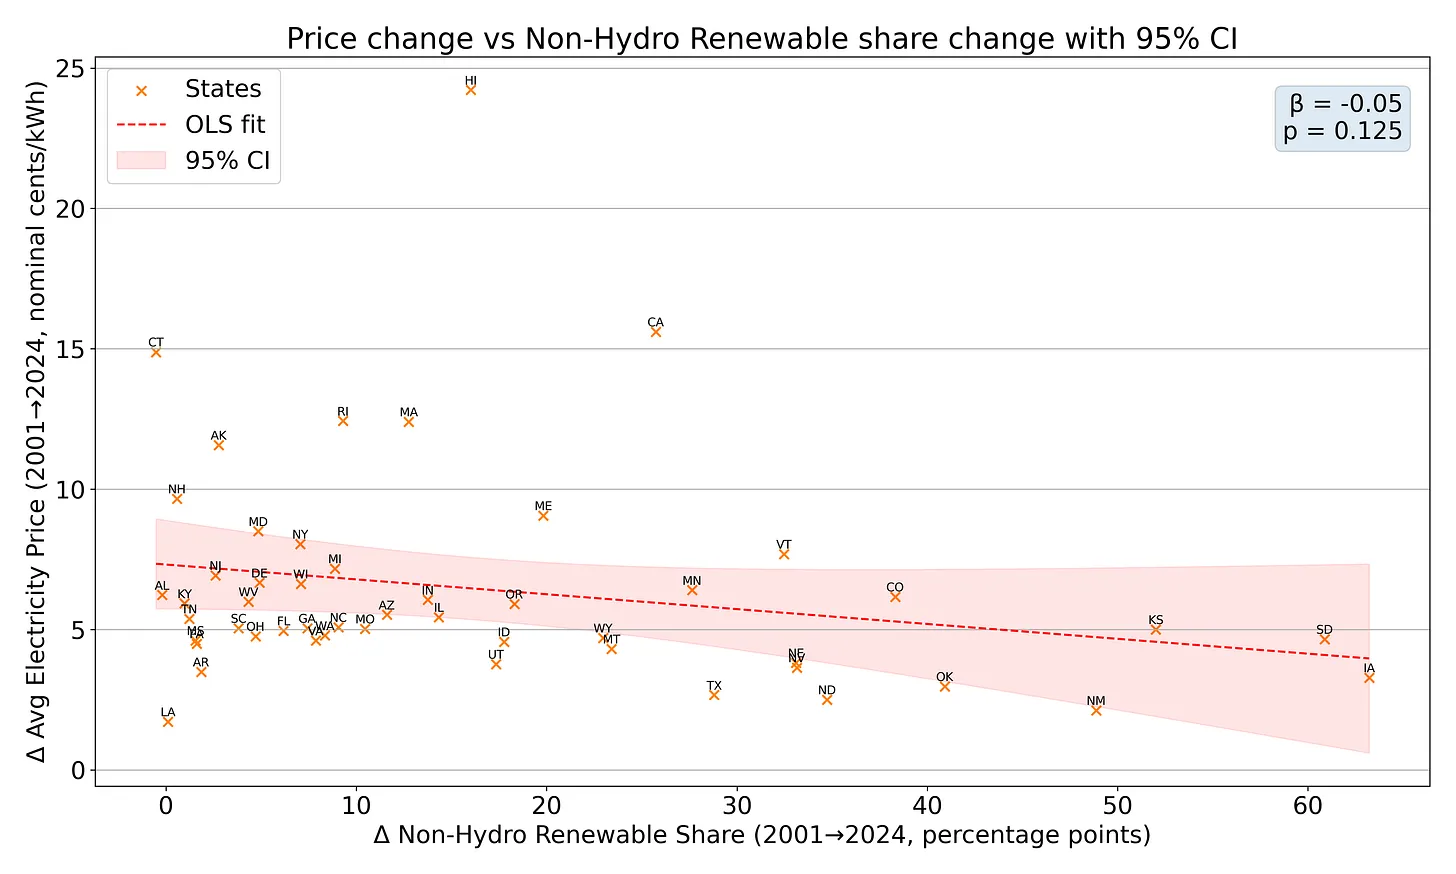
Change in prices by change in non-hydro renewable share, 2001-2024. Data from the US DOE EIA Electric Power Monthly.
A few things stand out as interesting in this figure:
Fact brief - Is climate science a high-paying profession?
Posted on 22 July 2025 by Sue Bin Park
![]() Skeptical Science is partnering with Gigafact to produce fact briefs — bite-sized fact checks of trending claims. You can submit claims you think need checking via the tipline.
Skeptical Science is partnering with Gigafact to produce fact briefs — bite-sized fact checks of trending claims. You can submit claims you think need checking via the tipline.
Is climate science a high-paying profession?
 Climate scientists are paid for their work, but grants primarily fund research expenses, not personal gain. The field offers modest salaries relative to other accessible professions.
Scientific research is expensive and competitive. Grants fund equipment, lab space, travel, data collection, and salaries for entire teams, not single individuals. A $400,000 grant might pay a scientist less than $17,000 annually over three years.
The average yearly salary of a U.S. climate researcher is $90,000 per year, comparable to IT administrators rather than CEOs.
The claim that climate scientists fabricate results for money ignores the accountability and transparency built into grant systems. Funds are awarded based on peer-reviewed proposals, and all spending must be justified and reported.
Such specialists who are “in it for the money” would likely work in more lucrative private sectors like oil or gas industries, whose executives make $20 million per year.
Go to full rebuttal on Skeptical Science or to the fact brief on Gigafact
This fact brief is responsive to quotes such as this one.
Sources
The New York Times The Baseless Claim That Climate Scientists Are ‘Driven’ by Money
Ars Technica If climate scientists are in it for the money, they’re doing it wrong
Global Warming: Man or Myth? Scientists can also wear their citizen hats Taking the Money for Grant(ed) – Part I
ZipRecruiter Climate Scientist Salary
Glassdoor Climate Scientist Salaries
RaiseMe Climate scientists: Salary, career path, job outlook, education and more
Yahoo Finance Here’s How Rich All the Big Oil Executives Are
Climate Adam - How Climate Change Supercharges Deadly Heatwaves
Posted on 21 July 2025 by Guest Author
This video includes personal musings and conclusions of the creator climate scientist Dr. Adam Levy. It is presented to our readers as an informed perspective. Please see video description for references (if any).
As our climate changes and our world heats, that's turbo charging extreme weather disasters - from floods to wildfires. These disasters are claiming lives. And now a group of researchers have studied a recent extreme weather event - a heatwave across Europe - to see just how much more deadly it became, due to climate change. This first of its kind study reveals just how dangerous global warming already is today. But it doesn't need to be this way. Because there's plenty we can do to protect ourselves from the heat - now and in the future.
Support ClimateAdam on patreon: https://patreon.com/climateadam
2025 SkS Weekly Climate Change & Global Warming News Roundup #29
Posted on 20 July 2025 by BaerbelW, Doug Bostrom
Stories we promoted this week, by category:
Climate Policy and Politics (7 articles)
- Dangerous weather predictions will get tougher after these Trump administration actions The decision by the Department of Defense to stop providing data to NOAA is just the latest challenge for the agency this year. USA Today, Dinah Voyles Pulver, July 10, 2025.
- US State Department Fires More Than 1,300 Employees Even while climate change inexorably will win the ''war,'' climate denial has won a major battle in the United States, and the United States thus will go unrepresented as the rest of the world deals with reality. NBC News, NBC News, Jul 12, 2025.
- Why the federal government is making climate data disappear Under Trump, climate denial has given way to something even more dangerous: climate erasure. Grist, Kate Yoder, Jul 14, 2025.
- NASA Pulls Back From Promise to Host Major Climate Change Reports, Citing Legal Loophole Earlier this month, the agency said it would work to re-host information from a federal website that went dark. Now it says it will no longer do so. Inside Climate News, Finya Swai, Jul 15, 2025.
- NASA Website Will Not Provide Previous National Climate Reports An agency spokeswoman had initially stated that NASA would retain earlier assessments online for continuity but instead the information will be hidden from public view. NYT, Rebecca Dzombak, Jul 15, 2025.
- He helped Microsoft build AI to help the climate. Then Microsoft sold it to Big Oil. A former Microsoft project manager reveals how the tech giant is using AI to help Big Oil drill—and how he and his partner are now pushing for change. HEATED, Emily Atkin, Jul 17, 2025.
- `Keeping us hooked on fossil fuels`: how can we negotiate with autocracies on the climate crisis? The bulk of global greenhouse gas emissions come from countries that are not democratic, and many big oil and gas exporters are also authoritarian. The Guardian, Fiona Harvey, Jul 18, 2025.
Climate Science and Research (6 articles)
- Texas floods not caused by cloud seeding or dam release, but likely worsened by climate change Science Feedback, Editor Darrik Burns, July 11, 2025.
- Ocean circulation going South? Some intriguing new measurements of salinity in the oceans around Antarctica have set off reams of sensationalist speculations. Maybe some context is helpful… RealClimate, Gavin Schmidt, Jul 13, 2025.
- NO! The Antarctic Overturning Circulation is NOT REVERSING! The news is BAD enough without that! Just have a Think! on Youtube, Dave Borlace, July 13, 2025.
- ProPublica climate reporter calls Texas floods an 'early warning' of future chaos Abrahm Lustgarten says the undermining of science, and cuts to FEMA and NOAA, at a time when erratic weather is making disasters more common, should be "extraordinarily concerning" to us. NPR Topics: Climate, Tonya Mosley, Jul 16, 2025.
- Skeptical Science New Research for Week #29 2025 Skeptical Science's weekly distillation of freshly published climate research by academics, goverments and NGOS. Skeptical Science, Doug Bostrom & Marc Kodack, Jul 17, 2025.
- Frozen for 12,000 years, this Alpine ice core captures the rise of civilization An ice core records climate and much else for the past 12,000 years, showing how nature and now increasingly humans have changed Earth's environment. ScienceDaily, Desert Research Institute, Jul 17, 2025.
Skeptical Science New Research for Week #29 2025
Posted on 17 July 2025 by Doug Bostrom, Marc Kodack
Open access notables
Climate change has increased the odds of extreme regional forest fire years globally, Abatzoglou et al., Nature Communications
Regions across the globe have experienced devastating fire years in the past decade with far-reaching impacts. Here, we examine the role of antecedent and concurrent climate variability in enabling extreme regional fire years across global forests. These extreme years commonly coincided with extreme (1-in-15-year) fire weather indices (FWI) and featured a four and five-fold increase in the number of large fires and fire carbon emissions, respectively, compared with non-extreme years. Years with such extreme FWI metrics are 88-152% more likely across global forested lands under a contemporary (2011–2040) climate compared to a quasi-preindustrial (1851–1900) climate, with the most pronounced increased risk in temperate and Amazonian forests. Our results show that human-caused climate change is raising the odds of extreme climate-driven fire years across forested regions of the globe, necessitating proactive measures to mitigate risks and adapt to extreme fire years.
The work was supported through grants from the NSF Growing Convergence Research Program (OAI-2019762) to J.T.A. and A.C.C., Department of Interior’s Joint Fire Science Program (21-2-01-1 and 21-2-01-3) to J.T.A., M.S., and E.W.
Wildfires will intensify in the wildland-urban interface under near-term warming, Cunningham et al., Communications Earth & Environment
Dangerous fire weather is increasing under climate change, but there is limited knowledge of how this will affect fire intensity, a critical determinant of the socioecological effects of wildfire. Here, we model relationships between satellite observations of fire radiative power (FRP) and contemporaneous fire weather index, and then we project how FRP is likely to change under near-term warming scenarios. The models project widespread growth in FRP, with increases expected across 88% of fire-prone areas worldwide under 1.5 °C warming. Projected increases in FRP were highest in the Mediterranean biome and Temperate Conifer Forest biome, and increases were twice as large under 2 °C warming compared to 1.5 °C. Disaster-prone areas of the wildland-urban interface saw an average of 3.6 times greater projected increases than non-disaster-prone areas, suggesting wildfire impacts will intensify most in regions already vulnerable to dangerous wildfires. These findings emphasise the urgent need to anticipate changes to fire behaviour and proactively manage wildland-urban ecosystems to reduce future fire intensity.
Flooding Projections Due To Groundwater Emergence Caused by Sea Level Variability, Barnes et al., Earth's Future
Rising groundwater tables due to sea level rise (SLR) pose a critical but understudied threat to low-lying coastal regions. This study uses field observations and dynamic modeling to investigate drivers of groundwater variability and to project flooding risks from emergent groundwater in Imperial Beach, California. Hourly groundwater table data from four monitoring wells (2021–2024) reveal distinct aquifer behaviors across soil types. In transmissive coastal sandy soils, groundwater levels are dominated by ocean tides, with secondary contributions from non-tidal sea level variability and seasonal recharge. In this setting, we calibrated an empirical groundwater model to observations, and forced the model with regional SLR scenarios. We project that groundwater emergence along the low-lying coastal road will begin by the 2060s under intermediate SLR trajectories, and escalate to near-daily flooding by 2100. Over 20% of San Diego County's coastline shares similar transmissive sandy geology and thus similar flooding risk. Results underscore the urgency of integrating groundwater hazards into coastal resilience planning, as current adaptation strategies in Imperial Beach—focused on surface flooding—are insufficient to address infrastructure vulnerabilities from below.
Support for this study was provided by the U.S. National Science Foundation (2113984, 2113987, 2239602, and 2205239) and by the U.S. Army Corps of Engineers (W912HZ1920020)
Implications of states’ dependence on carbon dioxide removal for achieving the Paris temperature goal, Stuart-Smith et al., Climate Policy
Our analysis finds substantial ambiguities in how states plan to meet their climate targets. A feature of this ambiguity is that states expect to rely heavily on novel and conventional CDR options to meet their climate goals, and in some cases, rely on removals delivered in other states’ territories. Pathways that overshoot 1.5°C and use CDR to remove emissions produced in excess of the 1.5°C-aligned carbon budget will result in more severe climate change impacts and higher risks of crossing planetary tipping points. Moreover, states’ disclosed reliance on CDR is highly exposed to risks to its delivery, and non-delivery of planned CDR would raise global temperatures further, worsening impacts of climate change. Our findings provide a basis for enhanced scrutiny of states’ targets. The risks associated with heavy reliance on CDR to meet climate goals indicate that states should prioritize pathways that minimize overshoot and the reliance on CDR to reach net-zero CO2 emissions.
The climate activist’s dilemma: Extreme protests reduce movement support but raise climate concern and intentions, Nylund et al., Journal of Environmental Psychology
Some members of the climate movement advocate for disruptive tactics, including mass civil disobedience, in the effort to pressure governments to address anthropogenic climate change. However, prior research on the “activist's dilemma” suggests that extreme protest actions may reduce public support for a movement. The present research aimed to discover if these findings would replicate within the highly moralised context of climate change, and explore target deservingness as a potential moderator. Across two studies, with Australian psychology students (Study 1; N=178) and a politically representative sample from the United Kingdom (Study 2; N=511), participants perceived climate activists engaging in extreme (vs. moderate) protests to be more immoral, felt less emotional connection and identification with them, and supported the movement less. However, Study 2 found that extreme (vs. moderate) protests also heightened climate concern and intentions to take climate-related actions. These findings highlight a “climate activist’s dilemma”: while extreme tactics may reduce support for the activist groups who engage in such tactics, they may simultaneously raise climate concern and personal intentions to act.
From this week's government/NGO section:
Climate change tripled heat-related deaths in early summer European heatwave, Clarke et al., Imperial College London and the London School of Hygiene & Tropical Medicine
Human-caused climate change intensified the recent European heatwave and increased the number of heat deaths by about 1,500 in 12 European cities. Focusing on ten days of heat from June 23 to July 2, the researchers estimated the death toll using peer-reviewed methods and found climate change nearly tripled the number of heat-related deaths, with fossil fuel use having increased heatwave temperatures up to 4°C across the cities. They warn that heatwave temperatures will keep rising and future death tolls are likely to be higher, until the world largely stops burning oil, gas and coal and reaches net zero emissions.
Statistical Review of World Energy 2025, Energy Institute
Total energy demand increased across all regions, but the growth was far from evenly distributed, reflecting stark regional variations shaped by economic development, climate conditions, and energy policy. North America and Europe exhibited the slowest growth rates at 0.4% and 0.7%, respectively. However, in absolute terms, Africa had the smallest increase in energy demand, at 0.29 EJ their increase in demand was less than 40% of Europe’s increased energy demand (0.73 EJ). The Asia Pacific region drove 65% of the global energy demand increase and is responsible for 47% of total global energy demand. Total renewable energy supply increased by 8%, of which China alone was responsible for more than the rest of the world combined (at 58%). Global growth in electricity demand continues to outpace growth in total energy demand. All regions experienced significant growth in electricity demand in this new age of electricity, with Asia Pacific and the Middle East registering the greatest growth in electricity generation at 5.4% and 5.3%, respectively.
147 articles in 66 journals by 905 contributing authors
Physical science of climate change, effects
Amplified warming accelerates deoxygenation in the Arctic Ocean, Wu et al., Nature Climate Change 10.1038/s41558-025-02376-0
Climate-Driven Stratification Intensifies Internal Wave Cooling on a Shallow Island Reef, Rogers et al., Geophysical Research Letters Open Access 10.1029/2025gl115458
Observational constraints suggest a smaller effective radiative forcing from aerosol–cloud interactions, Park et al., Atmospheric Chemistry and Physics Open Access 10.5194/acp-25-7299-2025
Climate Adam & GeoGirl explain a recent study reconstructing 485-million-year history of Earth's surface temperatur
Posted on 16 July 2025 by Guest Author
The videos include personal musings and conclusions of the creators climate scientist Dr. Adam Levy and geologist Dr. Rachel Phillips. They are presented to our readers as an informed perspective. Please see video descriptions for references (if any).
Adam Levy and Rachel Phillips collaborated on two videos for their respective Youtube channels explaining the study A 485-million-year history of Earth’s surface temperature published by Emily J. Judd and colleagues in 2024.
Today's climate is changing. Fast. But what has happened in our planet's past? Have climate changes taken place long ago? In fact, there have been huge shifts in the planet's climate over the past hundreds of millions of years - from ice ages to temperatures far hotter than today. These have been triggered by everything from the evolution of plants to the asteroid that wiped out the dinosaurs. But throughout all this, there's one familiar variable: carbon dioxide. So what do the past half billion years reveal? And what does that mean for the climate change we're seeing today?
Adam's video:
Rachel's video:
Fact brief - Did CO2 contribute to early 20th century warming?
Posted on 15 July 2025 by Sue Bin Park
![]() Skeptical Science is partnering with Gigafact to produce fact briefs — bite-sized fact checks of trending claims. You can submit claims you think need checking via the tipline.
Skeptical Science is partnering with Gigafact to produce fact briefs — bite-sized fact checks of trending claims. You can submit claims you think need checking via the tipline.
Did CO2 contribute to early 20th century warming?
 Warming from 1920 to 1940 was influenced by both natural dynamics or “forcings” as well as human-caused greenhouse gas emissions such as CO2.
Human-caused CO2 began rising during the Industrial Revolution and contributed to early 20th century warming. At the same time, solar activity rose slightly and volcanic activity was unusually low, adding to warming. Ocean circulation changes also raised regional temperatures in areas like the North Atlantic.
The myth that early warming disproves CO2’s role in climate change ignores that scientists account for all major forcings. Studies estimate that without human emissions, only about half the early 20th-century warming would have occurred.
Since 1975, solar activity has declined and volcanic eruptions have cooled the atmosphere, yet global temperatures have surged alongside the steep rise in greenhouse gas emissions. Only models that include CO2 match observed warming trends. Natural variability alone cannot explain the industrial era increase in global temperatures.
Go to full rebuttal on Skeptical Science or to the fact brief on Gigafact
This fact brief is responsive to quotes such as this one.
Sources
NOAA Climate Change in the Context of Paleoclimate
NASA Carbon Dioxide
Wiley Interdisciplinary Review Climate Change The early 20th century warming: Anomalies, causes, and consequences
NASA The Causes of Climate Change
Update on Texas flooding
Posted on 14 July 2025 by Guest Author
This is a re-post from The Climate Brink by Andrew Dessler
My heart is breaking for the tragedy that’s unfolding in central Texas right now. At present, more than 70 people have died in the flooding in the Texas Hill Country.
Given the widespread interest in this event and numerous requests for comment from the media, I’ve compiled the essential points you need to know here.

The role of climate change
I’ve written about the influence of climate change in intense precipitation events before, and here’s what I said:
Let me emphasize up front that climate change doesn’t cause rain events. Rather, the role of climate change is like steroids for the weather — it injects an extra dose of intensity into existing weather patterns. So the right question is whether climate change has amped up this event.
Warmer air can hold more water vapor — about 7% more for every degree Celsius increase in temperature. Consequently, the air converging into a storm system in a warmer climate carries more water vapor. Since most of the water vapor entering the storm’s updraft will fall out as rain, everything else the same, more water in the air flowing into the storm will lead to more intense rainfall. That’s it. Not terribly complicated.
Obviously, not everything else has to stay the same. Things like the vertical velocity and the temperature profile can both change and that could modify the rate at which intense rainfall is getting more intense. See this paper for a complete discussion of these other factors. Considering all of the factors yields a very similar conclusion.
can we see this in observations? yes!
When it comes to flooding, the rain events we care about are the most intense. And this plot shows the observed frequency of occurrence of these rain events in two periods, the mid-20th century and the late-20th/early-21st century. As you can see, the heaviest events (above 99th percentile) are indeed becoming more intense.
what does the scientific community conclude?
Because of this, the IPCC’s synthesis report concluded:
The frequency and intensity of heavy precipitation events have increased since the 1950s over most land areas for which observational data are sufficient for trend analysis (high confidence), and human-caused climate change is likely the main driver.
They go on to say that:
The projected increase in frequency and intensity of heavy precipitation (high confidence) will increase rain-generated local flooding (medium confidence).

2025 SkS Weekly Climate Change & Global Warming News Roundup #28
Posted on 13 July 2025 by BaerbelW, Doug Bostrom
Stories we promoted this week, by category:
Climate Change Impacts (6 articles)
- DeBriefed 4 July 2025: Trump `megabill` guts clean energy; Europe`s record heat; Scientists discuss `most worrying` tipping points Carbon Brief, Carbon Brief Staff, Jul 04, 2025.
- Devastating flash floods slam Texas Hill Country; Tropical Storm Chantal heads for Carolinas Yale Climate Connections, Jeff Masters and Bob Henson, Jul 05, 2025.
- Update on Texas flooding Andrew Dessler's update on the flooding in Texas The Climate Brink, Andrew Dessler, Jul 07, 2025.
- Experts: Which climate tipping point is the most concerning? Last week, hundreds of scientists, policymakers and journalists flocked to the University of Exeter to attend an international conference on “tipping points”. Carbon Brief, Carbon Brief Staff, Jul 09, 2025.
- London heatwave killed 263 people - with climate crisis to blame for most, study says Study finds around 1,500 of the 2,300 estimated heat deaths in Europe during recent weeks were the result of the climate crisis The Independent News, Jabed Ahmed, Jul 09, 2025.
- I’m a Climate Scientist in Texas. Here’s What the Floods Tell Us Time, Katharine Hayhoe, July 10, 2025.
Climate Policy and Politics (6 articles)
- Chinese Chickens Coming to Roost for Climate Denying Republicans Peter Sinclair teases apart the illogic of the US administration's attitude to energy modernization, and how it leads to a generous geopolitical gift. This is Not Cool, greenman3610, Jul 04, 2025.
- The "green" corporations funding anti-climate groups HEATED reached out to five companies with strong public climate commitments to find out why they're still funding major climate policy obstructors. HEATED, Casey Quinlan, Jul 07, 2025.
- Trump Hires Scientists Who Doubt the Consensus on Climate Change The three scientists joined the administration after it dismissed hundreds of experts who were assessing how global warming is affecting the country. NYT, Maxine Joselow, Jul 08, 2025.
- Recipients of a U.S. Climate Science Fellowship Are Put on Unpaid Leave Researchers in the NOAA program were furloughed because funds to pay them were not available. NYT, Rebecca Dzombak, Jul 09, 2025.
- Abbott says megafloods are "just part of nature." The fossil fuel industry disagrees. In leaked audio from a meeting last month, gas industry representatives acknowledged that extreme weather is getting wackier and more dangerous. HEATED, Emily Sanders, Jul 10, 2025.
- Trump officials axed an online portal for its key climate report. Read it in full here Guardian makes legally mandated gold standard report widely available after administration deleted website The Guardian, Oliver Milman, Jul 10, 2025.
Skeptical Science New Research for Week #28 2025
Posted on 10 July 2025 by Doug Bostrom, Marc Kodack
Open access notables
Americans and policymakers underestimate endorsement for the most popular climate solution narrative, combining personal and political action, Sparkman et al., Communications Earth & Environment
A wide variety of existing narratives describe how we might address climate change. Which of these approaches is popular among the American public? Do the general public and their elected officials accurately perceive which climate solutions are popular? We assess personal endorsement and perceptions of public support in national representative samples of the U.S. public (N = 1500) and local-level U.S. policymakers (N = 500). Proactive narratives, like ones advocating for both personal behavior and policy action, are widely endorsed, but both the public and policymakers greatly underestimate their popularity (a case of pluralistic ignorance), especially for narratives calling for systemic change. Greater endorsement of these narratives corresponded to greater willingness to take personal and political actions and support climate policy. We also find experimental exposure to some climate narratives (N = 2060) may increase participants’ behavioral intentions and policy support, suggesting which narratives are spread in popular media is important to help address climate change.
The work was supported by a National Science Foundation grant, SES-DRMS 2018063 to E.U.W.
The carbon perception gap in actual and ideal carbon footprints across wealth groups, Köchling et al., Nature Communications
Carbon inequality is gaining attention in public discussions surrounding equitable climate policies. It commonly refers to the unequal distribution of individual greenhouse gas emissions, with wealthier individuals contributing disproportionately higher emissions. Little is known about how people perceive the actual carbon footprint distribution across wealth groups and what they would desire as an ideal distribution. Survey data from Germany show awareness of carbon inequality, with respondents recognizing that wealthier individuals emit disproportionately more. Yet, with surprising consensus, all groups, including the wealthy, desired an inverse ideal distribution, with the wealthy having disproportionately smaller carbon footprints. Nonetheless, most perceived their own carbon footprint as far better compared to others in society and within their wealth group. Here, we show a carbon perception gap, particularly among the wealthiest: Collectively, people acknowledge the presence of carbon inequality and desire a more equitable distribution, yet often perceive themselves as already contributing more than others.
Permafrost Thaw Impact on Remaining Carbon Budgets and Emissions Pathways in 2°C and 3°C Global Warming Scenarios, Georgievski et al., Earth's Future
This study focuses on the impact of thawing frozen ground of high northern latitudes, known as permafrost, which contains large amount of soil organic carbon (SOC). As temperatures rise due to climate change, this SOC can be decomposed and released as greenhouse gases (GHG) into atmosphere reinforcing warming. We use climate model experiments with and without permafrost, adapting fossil fuel emissions to simulate different scenarios aimed at limiting GHG concentrations to stabilize global warming to 2°C and 3°C above preindustrial levels. Climate model simulations show that thawing permafrost could release significant amounts of GHG with temporary peaks of about half of present-day annual fossil fuel emissions (∼5 PgC), but at an average rate of less than 0.7 PgC/yr for 3°C, and ∼0.3 PgC/yr for 2°C warming. Thus, by the end of the simulations set for the year 2298, the release of permafrost carbon reduces the amount of carbon available for fossil fuel emissions by ∼13% for 2°C warming level, and by ∼11% for 3°C warming level. These results show how important it is to consider permafrost thaw when acting to reduce emissions.
Rapid increases in satellite-observed ice sheet surface meltwater production, Zheng et al., Nature Climate Change
Surface meltwater production influences the contribution of ice sheets to global sea-level change. Ice-sheet-wide meltwater production has thus far primarily been quantified by regional climate models. Here we present a 31-year (1992–2023) time series of daily satellite-observed surface melt flux for the Greenland and Antarctic ice sheets. The annual meltwater volume in Greenland has significantly increased, with intensified melt in the northern basins dominated by a negative North Atlantic Oscillation and elevated melt flux in western basins driven by the decline in Arctic sea-ice. In East Antarctica, high melt rates since 2000 are attributed to warm air incursions from the Southern Ocean due to anomalous atmospheric circulations associated with a negative Southern Annular Mode and the recovery of the Antarctic ozone hole. This region, previously less prone to surface melt, has become a melt hotspot, potentially leading to meltwater ponding and future ice shelf destabilization.
Rising surface salinity and declining sea ice: A new Southern Ocean state revealed by satellites, Silvano et al., Proceedings of the National Academy of Sciences
For decades, the surface of the polar Southern Ocean (south of 50°S) has been freshening—an expected response to a warming climate. This freshening enhanced upper-ocean stratification, reducing the upward transport of subsurface heat and possibly contributing to sea ice expansion. It also limited the formation of open-ocean polynyas. Using satellite observations, we reveal a marked increase in surface salinity across the circumpolar Southern Ocean since 2015. This shift has weakened upper-ocean stratification, coinciding with a dramatic decline in Antarctic sea ice coverage. Additionally, rising salinity facilitated the reemergence of the Maud Rise polynya in the Weddell Sea, a phenomenon last observed in the mid-1970s. Crucially, we demonstrate that satellites can now monitor these changes in real time, providing essential evidence of the Southern Ocean’s potential transition toward persistently reduced sea ice coverage.
From this week's government/NGO section:
Climate Change in the American Mind: Beliefs & Attitudes, Spring 2025, Leiserowitz et al., Yale University and George Mason University
Americans who think global warming is happening outnumber those who think it is not by a ratio of more than 4 to 1 (69% versus 15%). Compared with Fall 2024, Americans’ level of worry is significantly higher for wildfires (+12 percentage points), rising sea levels (+13 points), and hurricanes (+8 points). Additionally, half or more Americans are at least “a little worried” their local area might be harmed by air pollution (78%), water pollution (77%), diseases carried by mosquitoes and ticks (76%), extreme heat (73%), droughts (73%), agricultural pests and diseases (71%), electricity power outages (71%), wildfires (67%), water shortages (67%), flooding (61%), tornados (60%), rising sea levels (55%), hurricanes (50%), and reduced snowpack (49%). Nearly two-thirds of Americans think that global warming is affecting the weather in the U.S. (64%), and seven in ten or more think it is affecting extreme heat (75%), wildfires (72%), droughts (72%), and flooding (71%). Only 18% of Americans say they hear about global warming in the media “at least once a week,” which is the lowest percentage since the question was added to the survey in 2015.
Google’s Eco-failures. An Environmental Investigation into Alphabet Inc. 2025, Kairos Fellowship
Google’s reported total greenhouse gas emissions increased 1,515% from 2010 to 2024 according to the company’s own published data. While Google reports a decrease in its data center emissions, it is doing so by only reporting “market based emissions,” which use renewable energy purchased elsewhere to obscure real emissions. Google’s only emissions that have shown an absolute decrease since 2019 are its scope 1 emissions, which merely account for 0.31% of Google’s reported total emissions. Google’s aggressive investment in Generative AI and its infrastructure is a major factor behind its climate failings. Google’s Scope 2 emissions, which measure the emissions from energy that Google purchases to power its data centers, have increased by 820% since 2010.
118 articles in 58 journals by 625 contributing authors
Physical science of climate change, effects
Dynamical Systems Methods to Understand Projected Heatwave Intensification, Vakrat & Kushner Kushner, Weather and Climate Extremes Open Access 10.1016/j.wace.2025.100791
Heat Storage Pattern Linked to the Atlantic Meridional Overturning Circulation Slowdown, Ren et al., Geophysical Research Letters Open Access 10.1029/2025gl116801
Observations of climate change, effects
Divergent oxygen trends in ice-covered lakes driven by ice-cover decline and ecological memory, Jansen et al., Proceedings of the National Academy of Sciences Open Access 10.1073/pnas.2426140122
Trump just gave a huge gift to China’s economy
Posted on 9 July 2025 by dana1981
This is a re-post from Yale Climate Connections
On the Fourth of July – America’s 249th birthday – President Donald Trump signed into law a bill that could very well cede the country’s position as the leading global economic superpower to China.
As the nonpartisan energy think tank RMI has argued, the world is in the midst of a transition from the Information Age, which the United States led by dominating the development of new software and information technologies, to the Renewable Age, in which the development and deployment of electric and renewable energy technologies will drive the global economy.
This transition is dominated by insurgent clean technologies, such as solar, wind, electric vehicles, and batteries, whose prices are falling rapidly and whose growth is exponential.
 Transitions to new global economic ages and the countries that led and are poised to lead them. (Image credit: RMI / used with permission)
Chinese manufacturers have invested heavily in those technologies. To help the U.S. economy better compete in the clean tech sector, Democrats passed the Inflation Reduction Act, or IRA, in August 2022. That law included incentives to spur domestic manufacturing of these key clean energy technologies.
And it was working.
The U.S. experienced a clean energy manufacturing boom over the ensuing two years. But Republicans’ new budget reconciliation law, called the “One, Big Beautiful Bill Act,” guts those incentives and pulls the rug out from under nascent domestic clean energy industries.
On America’s birthday, President Donald Trump could not have given the Chinese economy a more generous gift.
Fact brief - Is global warming just due to El Niño?
Posted on 8 July 2025 by Sue Bin Park
![]() Skeptical Science is partnering with Gigafact to produce fact briefs — bite-sized fact checks of trending claims. You can submit claims you think need checking via the tipline.
Skeptical Science is partnering with Gigafact to produce fact briefs — bite-sized fact checks of trending claims. You can submit claims you think need checking via the tipline.
Is global warming just due to El Niño?
El Niño Southern Oscillation is a short-term and cyclical weather phenomenon caused by alternating wind patterns that result in heat exchange between the ocean and the atmosphere; it cannot explain long-term warming.
El Niño originates when westward moving trade winds weaken, allowing warm surface waters to shift east across the tropical Pacific. This reverses the La Niña pattern, where trade winds push warm surface water toward Asia, upwelling cold water off the coast of South America.
During El Niño, heat is transferred from the ocean to the atmosphere, causing warming, while La Niña occurs when heat moves from the atmosphere to the ocean, causing cooling. Energy is moved around the climate system without adding any heat.
In contrast, climate science research indicates human-caused CO2 is the primary driver of today’s warming. Human activities that increase greenhouse concentrations in the atmosphere cause less heat to escape the atmosphere, resulting in additional and non-cyclical warming.
Go to full rebuttal on Skeptical Science or to the fact brief on Gigafact
This fact brief is responsive to quotes such as this one.
Sources
NOAA What is the El Niño–Southern Oscillation (ENSO) in a nutshell?
Journal of Geophysical Research Comment on “Influence of the Southern Oscillation on tropospheric temperature” by J. D. McLean, C. R. de Freitas, and R. M. Carter
The great acceleration debate
Posted on 7 July 2025 by Zeke Hausfather
This is a re-post from the Climate Brink
The publication of an article titled “The World Is Warming Up. And It’s Happening Faster” by the New York Times kicked off a pretty heated debate among climate scientists over the evidence of acceleration and how strong a claim can be made based on the evidence today.
The NYT included the illustrative figure below, which draws simple ordinary least squares trends over three time periods: 1880-1970, 1970-2010, and 2010-present (May 2025). It appears to show a notable acceleration over the past 15 years compared to the rate of warming that characterized the post-1970 “modern warm period” when climate change began to notably take off alongside human emissions of CO2 and other greenhouse gases.

However, 15 years is a relatively short period of time; while the timeseries currently ends just after a weak La Nina event, there are concerns that the strong El Nino of 2023/2024 could bias the trend upward. More broadly, there is a lingering spectre of the hiatus haunting these discussions, when the climate science community arguably over-indexed on short term variability to make too much of an apparent slowdown in global warming between 1998 and 2012.
So, is there real evidence of an acceleration, or are we failing to learn from the past and overhyping short-term variability?
As I discuss below, it is my view that this is structurally different from the debate during the hiatus years; not because the evidence is much stronger in the surface temperature record alone (though arguably it is), but because so many other lines of evidence – climate models, ocean heat content, and changes in earth energy imbalance – also suggest an acceleration.
2025 SkS Weekly Climate Change & Global Warming News Roundup #27
Posted on 6 July 2025 by BaerbelW, Doug Bostrom
Stories we promoted this week, by category:
Climate Change Impacts (4 articles)
- What does climate change mean for agriculture? Less food, and more emissions New research sheds light on how rising temperatures are squeezing farmers and raising prices for consumers. Grist, Frida Garza, Jun 30, 2025.
- How unusual is this UK heat and is climate change to blame? A second spell of UK temperatures well over 30C before the end of June - how unusual is this and how much is climate change to blame? BBC News, Mark Poynting, Jun 30, 2025.
- Climate change has doubled the world's heat waves: How Africa is affected The Conversation, Joyce Kimutai, Jul 02, 2025.
- We didn’t know East Antarctica was melting like this Dr Gilbz on Youtube, Ella Gilbert, July 4, 2025.
Climate Education and Communication (4 articles)
- Stampede in Soho: puppet animals on an epic trek bring wonder and warning to London streets Public art project The Herds is passing through capital on 20,000km journey from Congo Basin to Arctic Circle, inspiring climate action The Guardian, Chris Wiegand, Jun 28, 2025.
- Schools failing in climate education A survey reveals a disconnect between what Canadian parents and kids want to know about climate change vs. how the need is addressed in schools. Brandon Sun, Karen S. Acton, Jun 30, 2025.
- An Important Archive of Congressionally-Mandated Climate Change Reports Just Went Dark Climate scientists are alarmed by the Trump administration’s latest attack on climate change research. Inside Climate News, Lauren Dalban, Jul 01, 2025.
- Key climate change reports removed from US government websites The national climate assessments help state and local governments prepare for the impacts of a warming world. The Guardian, Associated Press, Jul 01, 2025.
Climate Policy and Politics (4 articles)
- Who`s the Fossil Fuel-Backed "Philosopher" Shaping Trump`s Megabill Clean Energy Cuts? Is a bachelor's degree in philosophy sufficent to become an energy policy expert? Desmog explores this question. DeSmog, Sharon Kelly, Jul 01, 2025.
- Trump administration shuts down U.S. website on climate change The U.S. Global Change Research Program’s website, globalchange.gov, was taken down along with information on how global warming is affecting the country. Los Angeles Times, Ian James, Noah Haggerty, Jul 01, 2025.
- Trump uprooted a major climate effort. Scientists are fighting back. The future of the National Climate Assessment is uncertain, so researchers are looking to write an alternative version that could serve as a substitute. E&E News, Chelsea Harvey, Jul 02, 2025.
- Trump`s climate research cuts are unpopular, even with Republicans Recent polling shows that nearly 80% of registered U.S. voters want government agencies to keep researching and sharing global warming data. The administration is dismantling both. Yale Climate Connections, Karin Kirk, Jul 03, 2025.
Skeptical Science New Research for Week #27 2025
Posted on 3 July 2025 by Doug Bostrom, Marc Kodack
Open access notables
The Emergence of Near-Permanent Marine Heatwave State in the Tropical Indian Ocean During 2023–2024, Soumya, International Journal of Climatology
In 2023/24, global mean surface temperatures exceeded 1.5°C above pre-industrial levels, and the Tropical Indian Ocean (TIO) experienced a record-breaking basin mean anomalous warming of 0.88°C. This unprecedented warming in the TIO is linked to the severe and long-lasting marine heatwave (MHW) events ever recorded in the region, reconciling with the ongoing long-term warming and internal climate variabilities. The MHW events of 2023/24 were primarily centred in the Arabian Sea (AS) and southwestern TIO regions, with mean intensities of 0.73°C and 0.89°C, respectively. The prolonged MHW event developed in the AS region in August 2023 and in the southwestern TIO in July 2023 due to increased oceanic heat gain associated with increased insolation and reduced latent heat loss. The MHW event in the AS was sustained throughout the remainder of the year and the following year by subsurface warming due to the convergence of surface winds in the AS and suppressed cooling by vertical processes. In the southwestern TIO, the event intensified and lasted till December 2024, driven by thermocline warming induced by downwelling Rossby waves, triggered by intensified easterlies associated with an anomalously westward extended cold tongue in the equatorial Indian Ocean, linked to the co-occurrence of strong El Niño and extreme equatorial positive Indian Ocean Dipole (PIOD) events. The extreme warming of the TIO during 2023/24 underscores the ongoing impact of climate change on global ocean surface warming.
Glaciers in Western Canada-Conterminous US and Switzerland Experience Unprecedented Mass Loss Over the Last Four Years (2021–2024), Menounos et al., Geophysical Research Letters
Over the period 2021–2024, glaciers in Western Canada and the conterminous US (WCAN-US), and Switzerland respectively lost mass at rates of 22.2 ± 9.0 and 1.5 ± 0.3 Gt yr−1 representing a twofold increase in mass loss compared to the period 2010–2020. Since 2020, total ice volume was depleted by 12% (WCAN-US) and 13% (Switzerland). Meteorological conditions that favored high rates of mass loss included low winter snow accumulation, early-season heat waves, and prolonged warm, dry conditions. High transient snow lines, and impurity loading due to wildfires (WCAN-US) or Saharan dust (Switzerland) darkened glaciers and thereby increased mass loss via greater absorbed shortwave radiation available for melt. This ice-albedo feedback will lead to continued high rates of thinning unless recently exposed dark ice and firn at high elevations is buried by seasonal snowfall. Physical models that simulate impurity deposition and movement through firn and ice are needed to improve future projections of glacier mass change.
Early warning signs of salt marsh drowning indicated by widespread vulnerability from declining belowground plant biomass, Runion et al., Proceedings of the National Academy of Sciences
Intensifying stressors are weakening resilience in ecosystems across the globe. Here, we show that belowground biomass (BGB), a proxy for salt marsh health, has decreased over a large area of coastal marshes since 2014, indicating growing vulnerability to sea-level rise (SLR)-induced drowning. Using observational modeling, we show a shift in plant biomass allocation, away from belowground resources, which are critical for resilience, toward higher aboveground stocks. Marsh drowning is likely underway, and the window for action may be short lived.
From this week's government/NGO section:
Air and greenhouse gas pollution from private jets, 2023, Daneil Sitompul and Dan Rutherford, International Council on Clean Transportation
While there are several high-fidelity emission inventories for commercial aviation, data on greenhouse gas (GHG) and air pollution from general aviation aircraft, notably private jets activity, remain limited. The authors fill this gap by estimating how much, and where, air and GHG pollution was emitted globally by private jets in 2023. The authors used both a top-down and bottom-up emissions inventory for private jet flights using a variety of data sources, including global flight trajectories, airport coordinates, and engine emission databases.
NDCs as levers for prosperity, health and resilience, Denton et al, Climate Crisis Advisory Group
Current Nationally Determined Contributions (NDCs) are not meeting the urgency or scale of the climate crisis. On the present course, they leave the world heading towards 3°C of warming – well beyond the 1.5°C target set in the Paris Agreement. This report positions NDCs as strategic national tools to drive inclusive growth, resilience, and public well-being. The authors present 10 transformative recommendations to help countries embed climate ambition into national development strategies. These are grouped under four themes: driving prosperity and stability, building healthy and resilient communities, ensuring effective and equitable implementation, and accelerating action and ambition. Collectively, they show how NDCs can become levers for green investment, job creation, and systemic reform – offering a pathway from climate risk to shared, sustainable prosperity. Governments must use the NDC cycle as an opportunity not only to ratchet ambition, but to make climate action a cornerstone of economic and social policy.
130 articles in 56 journals by 891 contributing authors
Physical science of climate change, effects
A Wavier Polar Jet Stream Contributed to the Mid-20th Century Winter Warming Hole in the United States, Chalif et al., AGU Advances Open Access 10.1029/2024av001399
A Weakened AMOC Could Cause Southern Ocean Temperature and Sea-Ice Change on Multidecadal Timescales, Diamond et al., Journal of Geophysical Research: Oceans Open Access 10.1029/2024jc022027
Characteristics and mechanisms of summer long-lived heatwaves in Western North America: Perspective from Rossby wave train, Qiang et al., Atmospheric Research 10.1016/j.atmosres.2025.108208
Take advantage of these tax credits before Congress kills them
Posted on 2 July 2025 by Guest Author
This is a re-post from Yale Climate Connections by Samantha Harrington
Republicans in the U.S. Senate are working to pass their version of the budget reconciliation bill before Congress goes on holiday for July 4. As it stands, the bill would terminate most clean energy tax credits long before their original phase-out date in 2032.
The tax credits, which include money back on electric cars, electric appliances, energy efficiency improvements, and more, have a lot of public support. In a December 2024 survey, researchers at the Yale Program on Climate Change Communication, the publisher of this site, found that 91% of liberal Democrats, 70% of moderate or conservative Democrats, 42% of liberal or moderate Republicans, and 28% of conservative Republicans support tax rebates for electric vehicles. A Yale Climate Connections analysis found that red states stood to benefit the most from the law’s incentives to individuals and businesses.
Some hoped that the Senate would save tax credits that the Republican-controlled House of Representatives proposed cutting in their version of the budget bill that passed in May, but that has not been the case for consumer tax credits for EVs or home improvements. That said, senators have not yet voted on the bill, and because the Senate made substantial changes, the bill will need to return to the House before heading to President Donald Trump’s desk for his signature. So there is still time for constituents to let members of Congress know their thoughts about the proposed legislation.
If the Senate version of the bill does become law as-is, the credits won’t expire immediately. For the most part, consumers will have 180 days to take advantage of the credits before they’re fully terminated.
Fact brief - Are human CO2 emissions driving current global warming?
Posted on 1 July 2025 by Sue Bin Park
![]() Skeptical Science is partnering with Gigafact to produce fact briefs — bite-sized fact checks of trending claims. You can submit claims you think need checking via the tipline.
Skeptical Science is partnering with Gigafact to produce fact briefs — bite-sized fact checks of trending claims. You can submit claims you think need checking via the tipline.
Are human CO2 emissions driving current global warming?
While many natural factors influence Earth’s climate, human emissions of heat-trapping carbon dioxide are driving today’s global warming.
Scientists have conducted detailed studies of climate “forcings,” or the factors impacting global temperatures, especially with the past 50 years of satellite data. Long-term natural forcings, such as changes in Earth’s orbit or tectonic movement, take tens of thousands of years. They cannot explain the pace of recent warming.
More immediate, smaller-impact changes occur in shorter-term cycles and cancel out over time. Solar cycles and weather patterns such as El Nino and El Nina manifest as irregular oscillations in temperature graphs.
In contrast, human CO2 emissions have increased by 50% in less than 200 years, from 290 ppm to 430 ppm. Today’s global temperatures are 1.5°C (2.6°F) warmer than the pre-industrial average. The long-term upward trend in today’s temperatures can only be explained by the concurrent human-caused rise in atmospheric CO2.
Go to full rebuttal on Skeptical Science or to the fact brief on Gigafact
This fact brief is responsive to quotes such as this one.
Sources
NASA Carbon Dioxide
NASA Global Temperature
NASA Is current warming natural?
U.S. Global Change Research Program FOURTH NATIONAL CLIMATE ASSESSMENT
What do the latest WMO temperature projections imply for 1.5C?
Posted on 30 June 2025 by Zeke Hausfather
This is a re-post from the Climate Brink
The WMO recently published their WMO Global Annual to Decadal Climate Update that covers the period from 2025 to 2029. This is a regular assessment of near-term dynamic model projections that assess both the forced climate response and short-term natural variability (e.g. ENSO and AMV).
This new update forecasts relatively high global temperatures to likely continue through 2029, with the central estimate form most years similar to what was seen in 2023 and 2024. The figure below shows the 2025-2029 forecast in blue, as well as a “hindcast” of past model performance (green) compared to observations (black).

Despite the central estimate being high, large uncertainties remain; it is hard for these near-term climate projections to firmly rule out temperatures either as low as what was experienced in 2020, or temperatures considerably higher than 2023 and 2024.
If we use the central estimates from the report, however, they would likely imply a crossing date for 1.5C (using the IPCC’s 20-year centered mean approach) that would be earlier than previously expected.
2025 SkS Weekly Climate Change & Global Warming News Roundup #26
Posted on 29 June 2025 by BaerbelW, Doug Bostrom
Stories we promoted this week, by category:
Climate Change Impacts (10 articles)
- Heatwave in England to bring temperatures above 32°C (89.6°F) – study finds climate change made this 100 times more likely Science Feedback, Editor: Darrik Burns, June 20, 2025.
- Wildfires: climate change cause and effect Canadians think about a recent object lesson on climate change. Winnipeg Free Press, David McLaughlin, Jun 21, 2025.
- It's hot. Fossil fuels made it hotter. And it'll still be the coldest summer of your life if Trump's "Big, Beautiful Bill" passes this week. HEATED, Emily Atkin, Jun 23, 2025.
- Most tree species face serious climate threat even under modest warming, study reveals Phys.org - latest science and technology news stories, Spanish National Research Council, Jun 24, 2025.
- Global Climate Risk Index Ranks 188 Countries by Vulnerability and Access to Finance State of the Planet, Columbia Climate School, Jun 25, 2025.
- Can Mongolia`s oldest traditions survive a changing climate? Conservation International is helping herders restore the Mongolian steppe. Climate Change, Will McCarry, Jun 25, 2025.
- Unprecedented June heat along the Northeast urban corridor, brought to you by climate change Cities from Philly to Boston break the 100-degree mark, in some cases way ahead of schedule. Yale Climate Connections, Bob Henson, Jun 25, 2025.
- Global Warming Is Speeding Up and the World Is Feeling the Effects New York Times, Sachi Kitajima Mulkey, Claire Brown and Mira Rojanasakul, Jun 26, 2025.
- `It looks more likely with each day we burn fossil fuels`: polar scientist on Antarctic tipping points Despite working on polar science for the British Antarctic Survey for 20 years, Louise Sime finds the magnitude of potential sea-level rise hard to comprehend The Guardian, Jonathan Watts, Jun 27, 2025.
- A Special `Climate` Visa? People in Tuvalu Are Applying Fast. Nearly half the citizens of the tiny Pacific Island nation have already applied in a lottery for Australian visas amid an existential threat from global warming and sea-level rise. NYT > Science, Max Bearak, Jun 28, 2025.
Skeptical Science New Research for Week #26 2025
Posted on 26 June 2025 by Doug Bostrom, Marc Kodack
Open access notables
Increased sea-level contribution from northwestern Greenland for models that reproduce observations, Badgeley et al., Proceedings of the National Academy of Sciences
The Greenland Ice Sheet has been thinning over the past several decades and is expected to contribute significantly to sea-level rise over the coming century. Ice flow models that make these projections, however, tend to underestimate the amount of mass lost from the ice sheet compared to observations, which complicates adaptation and mitigation planning in coastal regions. Here, we constrain a model of northwestern Greenland with a time series of satellite-derived surface velocity data and time-dependent physics to infer unknown ice properties. The model reproduces observed mass loss over the past 13 y within uncertainty. This model—constrained by more data—leads to about 8 to 17% greater sea-level rise contribution from this region by 2100.
Evidence of Emerging Increasing Trends in Observed Subdaily Heavy Precipitation Frequency in the United States, Mascaro et al., Geophysical Research Letters
The magnitude and frequency of heavy precipitation are expected to increase under warming temperatures caused by climate change. These trends have emerged in observational records but with much larger evidence on a daily rather than a subdaily scale. Here, we quantify long-term changes in heavy precipitation frequency in the United States using hourly observations in 1949–2020 from 332 gauges. We demonstrate that, when analyzed collectively, the frequencies of heavy precipitation at multiple durations from hourly to daily exhibit an increase that cannot be explained by natural climate variability. Upward trends are significant at ∼20%–40% of the gauges throughout the country except for the coastal western and southeastern regions, with higher percentages for longer durations. We also show that the frequency of hourly heavy precipitation has mainly grown after ∼2000, thus explaining the limited evidence of trends at the subdaily scale reported in past studies.
Giuseppe Mascaro thanks funding from the U.S. National Science Foundation (NSF) awards #2212702: “CAS-Climate: A Novel Process-Driven Method for Flood Frequency Analysis Based on Mixed Distributions” and #2221803: “Collaborative Research: CAS—Climate: Improving Nonstationary Intensity-Duration-Frequency Analysis of Extreme Precipitation by Advancing Knowledge on the Generating Mechanisms.”
Battery electric vehicles show the lowest carbon footprints among passenger cars across 1.5–3.0 °C energy decarbonisation pathways, Šimaitis et al., Communications Earth & Environment
Passenger car carbon footprints are highly sensitive to future energy systems, a factor often overlooked in life cycle assessment. We use a time-dependent prospective life cycle assessment to enhance carbon footprints under four 1.5–3.0 °C decarbonisation pathways for electricity, fuel, and hydrogen from an energy-based integrated assessment model. Across 5000 comparative cases, battery electric vehicles consistently have the lowest carbon footprints compared to hybrid, plug-in hybrid, and fuel-cell vehicles. For example, battery electric vehicles show an average 32 to 47% lower footprint than hybrid combustion in 3.0 °C and 1.5 °C climate-compatible futures, respectively. This is driven by greater projected decarbonisation of electricity compared to fossil-dominated fuels and hydrogen. Battery electric vehicles meaningfully retain their advantage for mileages over 100,000 km, even in regions with carbon-intensive electricity since these are anticipated to decarbonise the most. Although our study supports battery electric vehicles as the most reliable climate-mitigation option for passenger cars, reducing their high manufacturing footprint remains important.
Can dissent be meaningfully measured in an overwhelming consensus? A citation network case study in climate change research, Grunert, PLOS Clim ate
In scientific discourse, the prevalence of overwhelming consensus obscures the presence of dissenting views as well as their characteristics. This paper explores the potential to meaningfully measure dissent within the context of such a consensus, using climate change research as a case study. Using citation analysis to explore the dynamics of scientific publications and the reception of dissenting opinions, this project questions whether there may be a methodological framework for quantifying dissent. This study employs analysis of citation networks to assess the visibility and impact of minority viewpoints, as well as the viability of such a study. The findings indicate that because dissent in climate change research is miniscule such measurements are limited. Despite that finding, researchers on the fringe of scientific consensus have an outsized impact on social viewpoints. This project has potential to disrupt the ways researchers critically consider the relevance of dissenting research in their own fields, and to think of ways to embrace the impact of research that expands their fields.
In the face of anti-science politics, silence is not without cost, Editors, Nature
We recognize that not all scientific leaders are in a position to be able to speak out, particularly those in countries where doing so could incur a penalty — or even punishment. That is why our call is to international scientific organizations. Academies in countries where the freedom to dissent is protected should also make their concerns known. All need to be aware that silence is also not without cost.
From this week's government/NGO section:
Information Integrity about Climate Science: A Systematic Review, Elbeyi et al., International Panel on the Information Environment
The human response to the climate crisis is being obstructed and delayed by the production and circulation of misleading information about the nature of climate change and the available solutions. The authors found that powerful actors—including corporations, governments, and political parties—intentionally spread inaccurate or misleading narratives about anthropogenic climate change. These narratives circulate across digital, broadcast, and interpersonal communication channels. The result is a decline in public trust, diminished policy coordination, and a feedback loop between scientific denialism and political inaction.
Bright side of the mine. Solar’s opportunity to reclaim coal’s footprint, Cheng Cheng Wu and Ryan Driskell-Tate, Global Energy Monitor
The authors conducted a worldwide survey of surface coal mines closed in the last five years (since 2020) and those forecasted to close over the next five (by the end of 2030). The first-time analysis shows that over 300 surface coal mines recently out of commission could house around 103 GW of photovoltaic (PV) solar capacity, and upcoming closures of large operations could host an additional 185 GW of solar across 127 sites (see Methodology). These abandoned coal mines are predisposed to renewables siting with grid-adjacent and even pre-cleared acreage. If these potential solar projects came to fruition, the world could build almost 300 GW of solar capacity on mined out lands by the end of 2030. Uptake on that scale is equal to 15% of the solar that has already been built globally and would add enough solar capacity to inch the world one step closer to tripling renewables before the end of the decade.
138 articles in 56 journals by 793 contributing authors
Physical science of climate change, effects
Combined emergent constraints on future extreme precipitation changes, Shiogama et al., Nature Communications Open Access 10.1038/s41467-025-60385-1
Observations of climate change, effects
Climate-induced losses of surface water and total water storage in Northeast Asia, Zhang et al., Communications Earth & Environment Open Access 10.1038/s43247-025-02449-0
Evidence of Emerging Increasing Trends in Observed Subdaily Heavy Precipitation Frequency in the United States, Mascaro et al., Geophysical Research Letters Open Access 10.1029/2024gl114292


