


 Arguments


In 2020, a large group of scientists published a paper in which they used multiple lines of evidence to assess Earth’s climate sensitivity. The lines of evidence they used were the physical processes that determine climate sensitivity, the historical climate record, and the paleoclimate record. The key results were:
Explaining climate change science & rebutting global warming misinformation
Global warming is real and human-caused. It is leading to large-scale climate change. Under the guise of climate "skepticism", the public is bombarded with misinformation that casts doubt on the reality of human-caused global warming. This website gets skeptical about global warming "skepticism".
Our mission is simple: debunk climate misinformation by presenting peer-reviewed science and explaining the techniques of science denial, discourses of climate delay, and climate solutions denial.


Skeptical Science New Research for Week #38 2025
Posted on 18 September 2025 by Doug Bostrom, Marc Kodack
Open access notables

The weak land carbon sink hypothesis, Randerson et al., Science Advances
Over the past three decades, assessments of the contemporary global carbon budget consistently report a strong net land carbon sink. Here, we review evidence supporting this paradigm and quantify the differences in global and Northern Hemisphere estimates of the net land sink derived from atmospheric inversion and satellite-derived vegetation biomass time series. Our analysis, combined with additional synthesis, supports a hypothesis that the net land sink is substantially weaker than commonly reported. At a global scale, our estimate of the net land carbon sink is 0.8 ± 0.7 petagrams of carbon per year from 2000 through 2019, nearly a factor of two lower than the Global Carbon Project estimate. With concurrent adjustments to ocean (+8%) and fossil fuel (−6%) fluxes, we develop a budget that partially reconciles key constraints provided by vegetation carbon, the north-south CO2 gradient, and O2 trends. We further outline potential modifications to models to improve agreement with a weaker land sink and describe several approaches for testing the hypothesis.
The spatial extent of heat waves has changed over the past four decades, Skinner et al., Communications Earth & Environment
The spatial extent of an extreme heat event influences the total exposure of people and natural systems to heat-related stresses, straining water, energy, and emergency management resources. Here, we quantify how the contiguous area of individual heat wave events varies across heat wave types, time of year, and in response to observed climate change within the Berkeley Earth Surface Temperature Dataset. Across the mid-high latitudes, cold season heat waves cover areas that are 1.25 to 3 times larger than warm season events, and daytime heat waves impact 1.25 to 2 times the area of nighttime heat waves. The reverse relationship is found throughout tropical regions. Average heat wave size, regardless of type or season, has increased across most land in recent years, often by 1.5 to 2 times in the mid-latitudes. The contiguous spatial extent of dry soil anomalies and lower tropospheric subsidence events have also increased in some locations, potentially contributing to the increases in heat wave size.
Systematic attribution of heatwaves to the emissions of carbon majors, Quilcaille et al., Nature
Extreme event attribution assesses how climate change affected climate extremes, but typically focuses on single events. Furthermore, these attributions rarely quantify the extent to which anthropogenic actors have contributed to these events. Here we show that climate change made 213 historical heatwaves reported over 2000–2023 more likely and more intense, to which each of the 180 carbon majors (fossil fuel and cement producers) substantially contributed. This work relies on the expansion of a well-established event-based framework1. Owing to global warming since 1850–1900, the median of the heatwaves during 2000–2009 became about 20 times more likely, and about 200 times more likely during 2010–2019. Overall, one-quarter of these events were virtually impossible without climate change. The emissions of the carbon majors contribute to half the increase in heatwave intensity since 1850–1900. Depending on the carbon major, their individual contribution is high enough to enable the occurrence of 16–53 heatwaves that would have been virtually impossible in a preindustrial climate. We, therefore, establish that the influence of climate change on heatwaves has increased, and that all carbon majors, even the smaller ones, contributed substantially to the occurrence of heatwaves. Our results contribute to filling the evidentiary gap to establish accountability of historical climate extremes.
Health losses attributed to anthropogenic climate change, Carlson et al., Nature Climate Change
Over the last decade, attribution science has shown that climate change is responsible for substantial death, disability and illness. However, health impact attribution studies have focused disproportionately on populations in high-income countries, and have mostly quantified the health outcomes of heat and extreme weather. A clearer picture of the global burden of climate change could encourage policymakers to treat the climate crisis like a public health emergency.
From this week's government/NGO section:
China’s Green Leap Outward: The rapid scaleup of overseas Chinese clean-tech manufacturing investments, Xiaokang Xue and Mathias Larsen, Net Zero Policy Industrial Lab, Johns Hopkins University
A rapid acceleration in overseas investment by Chinese green technology manufacturers is reshaping the global clean-tech landscape. Since 2022 alone, investments have surged past USD 220 billion, spanning sectors such as batteries, solar, wind, new energy vehicles (NEVs), and green hydrogen. These investments now reach 54 countries across every major region. The authors offer the first comprehensive overview of China’s expanding global green manufacturing footprint, drawing upon our database. For example, Chinese firms have pledged at least USD 227 billion across green manufacturing projects. A high-end estimate approaches USD 250 billion. This surge of overseas green manufacturing investment is unprecedented; it now surpasses the USD 200 billion (in current 2024 dollars) invested by the US over four years of the Marshall Plan, at a time of similar American dominance of manufacturing in key industries.
Taking Stock 2025, King et al., Rhodium Group
The first seven months of the second Trump administration and 119th Congress have seen the most abrupt shift in energy and climate policy in recent memory. After the Biden administration adopted meaningful policies to drive decarbonization, Congress and the White House are now enacting a policy regime that is openly hostile to wind, solar, and electric vehicles and seeks to promote increased fossil fuel production and use. In this year’s Taking Stock report—Rhodium Group’s annual independent outlook of the evolution of the US energy system and greenhouse gas (GHG) emissions under current policy—we find the US is on track to reduce GHG emissions by 26-41% in 2040 relative to 2005 levels. On the way to 2040, we estimate GHG emissions levels will decline 26-35% in 2035, a meaningful shift from our 2024 report, which showed a steeper decline of 38-56% by that point. Emissions outcomes vary due to a range of expectations for economic growth, future fossil fuel prices, and clean energy cost and performance trends, which we combine to create low, mid, and high emissions scenarios. In the high emissions scenario, the most pessimistic outlook on decarbonization, the pace of decarbonization more than halves through 2040, with annual average GHG reductions of 0.4% from 2025 through 2040 compared to 1.1% from 2005 through 2024. In the mid and low emissions scenarios, the pace of decarbonization accelerates instead, with annual average reductions of 1.4% and 1.9% through 2040, respectively, representing a 22% and 70% acceleration, compared with the pace of the last two decades.
126 articles in 54 journals by 750 contributing authors
Physical science of climate change, effects
Global Water Cycle Pattern Amplification: Contributing Factors and Mechanisms, Lyu et al., Open Access 10.1029/2024jc022278
Neglecting land–atmosphere feedbacks overestimates climate-driven increases in evapotranspiration, Zhou & Yu, Nature Climate Change 10.1038/s41558-025-02428-5
Observations of Clouds and Radiation Over King George Island and Implications for the Southern Ocean and Antarctica, Rowe et al., Journal of Geophysical Research: Atmospheres Open Access 10.1029/2024jd042787
Climate change is accelerating, scientists find in ‘grim’ report
Posted on 17 September 2025 by dana1981
This is a re-post from Yale Climate Connections
he amount of heat trapped by climate-warming pollution in our atmosphere is continuing to increase, the planet’s sea levels are rising at an accelerating rate, and the Paris agreement’s ambitious 1.5°C target is on the verge of being breached, according to a recent report by the world’s top climate scientists.
“The news is grim,” said study co-author Zeke Hausfather, a former Yale Climate Connections contributor, on Bluesky.
A team of over 60 international scientists published the latest edition of an annual report updating key metrics that are used in reports of the Intergovernmental Panel on Climate Change, the leading international scientific authority on climate change.
Earth out of balance
Climate change is caused by variations in Earth’s energy balance – the difference between the planet’s incoming and outgoing energy. Nearly all incoming energy originates from the sun. The Earth absorbs that sunlight and sends it back out toward space in the form of infrared light, or heat. Greenhouse gases such as carbon dioxide absorb infrared light, and so increased levels in those gases trap more heat in the atmosphere, warming the planet’s surface and oceans.
The new report finds that as a result of this increasing greenhouse effect, Earth’s energy imbalance has been consistently rising every decade. In fact, the global imbalance has more than doubled just since the 1980s. And from 2020 to 2024, humans exacerbated the problem by adding about 200 billion more tons of carbon dioxide-equivalent greenhouse gases to the atmosphere.
This increase in trapped energy has continued to warm Earth’s surface temperatures. The new study estimated that at current rates, humans will burn enough fossil fuels and release enough climate pollution to commit the planet to over 1.5°C of global warming above preindustrial temperatures within about three more years, in 2028.
The most recent report from the Intergovernmental Panel on Climate Change, published in 2021, concluded that average temperatures had increased 1.09°C since the late 1800s. The new study updates this number to 1.24°C, driven largely by the record-shattering hot years of 2023 and 2024.
The paper also finds that global surface temperatures are warming at a rate of about 0.27°C per decade. That’s nearly 50% faster than the close to 0.2°C-per-decade warming rate of the 1990s and 2000s, indicating an acceleration of global warming.
 Human-caused and total observed average global surface temperature increase since the Industrial Revolution. Created by Dana Nuccitelli with data by https://climatechangetracker.org/igcc from June 17, 2025.
Fact brief - Has the greenhouse effect been falsified?
Posted on 16 September 2025 by Sue Bin Park
![]() Skeptical Science is partnering with Gigafact to produce fact briefs — bite-sized fact checks of trending claims. You can submit claims you think need checking via the tipline.
Skeptical Science is partnering with Gigafact to produce fact briefs — bite-sized fact checks of trending claims. You can submit claims you think need checking via the tipline.
Has the greenhouse effect been falsified?
 The greenhouse effect is basic physics that has been known for nearly 200 years. Without it, the Earth would not be warm enough for life.
Greenhouse gases like carbon dioxide act like an insulating blanket. By preventing some outgoing heat from escaping the atmosphere by absorbing and re-emitting it, they keep Earth around 33°C (59°F) warmer than it would be otherwise.
In comparison, the Moon, lacking an atmosphere, swings from 120°C (248°F) in daytime to -130°C (-202°F) at night. Venus’s thick CO2-rich atmosphere always keeps surface temperatures above 450°C (842°F).
Laboratory tests show these gases trap heat at specific wavelengths, and satellites have directly measured those same wavelengths being trapped and reradiated.
It is no coincidence that as human-caused CO2 continues to increase in the atmosphere, more energy is being absorbed from the Sun than is being lost back into space, all while surface and air temperatures continue to rise.
Go to full rebuttal on Skeptical Science or to the fact brief on Gigafact
This fact brief is responsive to quotes such as this one.
Sources
NASA What is the greenhouse effect?
NASA Weather on the Moon.
NASA Venus facts.
NASA Climate Forcings and Global Warming.
Please use this form to provide feedback about this fact brief. This will help us to better gauge its impact and usability. Thank you!
What you need to know about AI and climate change
Posted on 15 September 2025 by Guest Author
This is a re-post from Yale Climate Connections by Daisy Simmons
Is AI saving the world or breaking it? As the era-defining technology leapfrogs from what-if to what-next, it can be hard for us humans to know what to make of it all. You might be hopeful and excited, or existentially concerned, or both.
AI can track Antarctic icebergs 10,000 times faster than humans and optimize renewable energy grids in real time – capabilities that could help us fight climate change. But it also consumes incredible amounts of energy, and ever more of it, creating a whole new level of climate pollution that threatens to undermine those benefits.
All that dizzying transformation isn’t just the stuff of news headlines. It’s playing out in daily conversations for many of us.
“Have I told you what Chatty and I came up with yesterday?” My dad and I talk every Sunday. “It’s an environmental detective show – you’ll star in it, of course.”
He’s mostly retired and spends a lot of time at home while my stepmom is at work, so he’s happy to have found an exciting new hobby: storytelling sessions with his AI pals (the above-referenced ChatGPT, as well as Claude and “Gemmy,” aka Gemini). This is a good thing, I think. He should be having some fun in his sunset years.
But then the conversation turned to a much less fun AI story: I told my dad my sixth grader said he’d felt pressured to dumb down an essay at school because a classmate got heat for using AI. What made the teacher suspect the kid? She flagged it for college-level vocabulary. “Well, that just ain’t right,” said my dad. Agreed.
Grim laughter was my brother-in-law’s reaction to the subject of my son’s essay. Once a rock star graphic designer (literally for rock bands), he said AI has killed creative career prospects for all our kids. But who knows, he said, maybe it will solve climate change – or maybe it will only make it worse.
That tension is what brought me here. The more I read and heard, the more I saw that he and I are not alone in struggling with this topic. To help make sense of the complexity, I asked Ann Bostrom, the chair of the National Academies of Science’s Roundtable on Artificial Intelligence and Climate Change, what she thought of my brother-in-law’s comment. In a nutshell: Is AI good or bad for the climate? The answer is decidedly not straightforward.
“Right now, there is serious uncertainty about what can or might happen with AI,” she said. “But that’s partially because it’s a new tool we’re developing – AI is a tool. So what it does, or what it can do, is a function of what we do with it.”
2025 SkS Weekly Climate Change & Global Warming News Roundup #37
Posted on 14 September 2025 by BaerbelW, John Hartz, Doug Bostrom
A listing of 29 news and opinion articles we found interesting and shared on social media during the past week: Sun, September 7, 2025 thru Sat, September 13, 2025.
Stories we promoted this week, by category:
Climate Policy and Politics (9 articles)
- Chevron’s Boss Says the World Will Need Oil for a ‘Long, Long Time’ "Mike Wirth, who has seen many booms and busts over the more than 40 years he has been with the energy giant, said that 'when the world stops using oil and gas, we’ll stop looking for it'." US Economy, The New York Times, Q&A by Jordyn Holman, Aug 31, 2025.
- Politicians now talk of climate 'pragmatism' to delay action-new study The Conversation, Steve Westlake, Sep 04, 2025.
- Former staffers of Climate.gov are attempting to launch a new site: Climate.us Climate.gov went dark after cuts from the Trump administration. Now, a group of former employees are trying to revive it under a new domain. NPR Topics: Climate, Mary Louise Kelly, Sep 04, 2025.
- The Energy Sector Has Spent Hundreds of Millions of Dollars on Lobbying This Year. Watchdogs Say That’s Only Half The Story "Fossil-fuel firms receive US subsidies worth $31bn each year, study finds" Fossil Fuels, Inside Climate News, Aidan Hughes, Sep 8, 2025.
- Top US Energy Official Lobbies for Fossil Fuels in Europe "European climate experts say the pro-fossil fuel arguments are based on climate disinformation." Fossil Fuels, Inside Climate News, Bob Berwyn, Sep 9, 2025.
- Fossil-fuel firms receive US subsidies worth $31bn each year, study finds "Figure calculated by Oil Change International has more than doubled since 2017 but is likely a vast understatement" Fossil Fuels, The Guardian, Dharna Noor, Sep 9, 2025.
- Feds try to dodge lawsuit against their bogus climate report Meanwhile, Congress is trying to keep serious scientists from weighing in. Ars Technica, John Timmer, Sep 12, 2025.
- EPA will halt greenhouse gas reporting for big polluters Critics say the move would erase data that’s needed for future climate rules. E & E News, Jean Chemnick, Sep 12, 2025.
- Orsted Sues Trump Administration in Fight to Restart Its Blocked Wind Farm "The Danish company behind Revolution Wind, a $6 billion project off Rhode Island, said the federal government had unlawfully halted work on the wind farm." The New York Times, Brad Plumer & Karen Zraick, Dec 4, 2025.
Climate Science and Research (5 articles)
- When is a climate model 'good enough?' Models will always have bugs. How do scientists decide which ones are most important and how many is too many? EOS, Saima May Sidik, Sep 10, 2025.
- Geoengineering Won’t Save Us From Global Warming, New Study Says "The research by a team of top ice and climate scientists debunks some speculative technological climate fixes for preserving the polar ice caps." Science, Inside Climate News, Bob Berwyn, Sep 10, 2025.
- World’s Largest Fossil Fuel and Cement Producers Are Responsible for About Half the Intensity of Recent Heat Waves, New Study Shows "Scientists say such source attribution could help power litigation aimed at holding the fossil fuel industry accountable for damages from heat waves and other extreme weather linked to climate change." Fossil Fuels, Inside Climate News, Dana Drugmand, Sep 10, 2025.
- Skeptical Science New Research for Week #37 2025 In this week's edition highlights we see the long arm of the laws of physics, as rivers in Alaska are polluted by sulfides liberated as permafrost degrades. Skeptical Science, Doug Bostrom & Marc Kodack, Sep 11, 2025.
- Utility-Scale Solar Can Withstand Severe Hailstorms. Here’s How stow' mode, panels can tolerate run-ins with even large balls of ice." Inside, Clean Energy, inside Climate News, Dan Gearino, Sep 12, 2025.
Skeptical Science New Research for Week #37 2025
Posted on 11 September 2025 by Doug Bostrom, Marc Kodack
Open access notables
Wild, scenic, and toxic: Recent degradation of an iconic Arctic watershed with permafrost thaw, Sullivan et al., Proceedings of the National Academy of Science
The streams of Alaska’s Brooks Range lie within a vast (~14M ha) tract of protected wilderness and have long supported both resident and anadromous fish. However, dozens of historically clear streams have recently turned orange and turbid. Thawing permafrost is thought to have exposed sulfide minerals to weathering, delivering iron and other potentially toxic metals to aquatic ecosystems. Here, we report stream water metal concentrations throughout the federally designated Wild and Scenic Salmon River watershed and compare them with United States Environmental Protection Agency (EPA) chronic (4-d) exposure thresholds for toxicity to aquatic life. The main stem of the Salmon had elevated SO42− concentrations and elevated SO42−: Ca relative to a predisturbance baseline for most of its length, consistent with increased sulfide mineral weathering. Most of the tributaries also had elevated SO42− concentrations and elevated SO42−: Ca, especially those in the upper watershed. The Salmon River mainstem consistently exceeded EPA chronic exposure thresholds for total recoverable iron, total recoverable aluminum, and dissolved cadmium from its first major tributary to its mouth. Nine of ten major tributaries that we sampled exceeded EPA thresholds for at least one metal on at least one of three sampling dates. Our findings indicate that habitat quality for resident and anadromous fish has been severely degraded in the Salmon River watershed. Loss of important spawning habitat in the Salmon and many other streams in the region might help explain a recent crash in chum salmon returns, which local communities depend upon for commercial and subsistence harvest.
Speleothem evidence for Late Miocene extreme Arctic amplification – an analogue for near-future anthropogenic climate change?, Umbo et al., Climate of the Past
Our estimate of > 18 °C of Arctic warming supports the wider consensus of a warmer-than-present Miocene and provides a rare palaeo-analogue for future Arctic amplification under high-emissions scenarios. The reconstructed increase in mean surface temperature far exceeds temperatures projected in fully coupled global climate models, even under extreme-emissions scenarios. Given that climate models have consistently underestimated the extent of recent Arctic amplification, our proxy data suggest Arctic warming may exceed current projections.
Long-term decline in montane insects under warming summers, Sockman, Ecology
Widespread declines in the abundance of insects portend ill-fated futures for their host ecosystems, all of which require their services to function. For many such reports, human activities have directly altered the land or water of these ecosystems, raising questions about how insects in less impacted environments are faring. I quantified the abundance of flying insects during 15 seasons spanning 2004–2024 on a relatively unscathed, subalpine meadow in Colorado, where weather data have been recorded for 38 years. I discovered that insect abundance declined an average of 6.6% annually, yielding a 72.4% decline over this 20-year period. According to model selection following information theoretic analysis of 59 combinations of weather-related factors, a seasonal increase in insect abundance changed to a seasonal decline as the previous summer's temperatures increased. This resulted in a long-term decline associated with increasing summer temperatures, particularly daily lows, which have increased 0.8°C per decade. However, other factors, such as ecological succession and atmospheric elevation in nitrogen and carbon, are also plausible drivers. In a relatively pristine ecosystem, insects are declining precipitously, auguring poorly for this and other such ecosystems that depend on insects in food webs and for pollination, pest control, and nutrient cycling.
Addressing methane emission feedbacks from global wetlands, Ury et al., Nature Sustainability
Earth-system feedback loops that exacerbate climate warming cause concern for both climate accounting and progress towards meeting international climate agreements. Methane emissions from wetlands are on the rise owing to climate change—a large and difficult-to-abate source of greenhouse gas that may be considered indirectly anthropogenic. Here we illustrate the power of emissions reduction from any sector for slowing the progress of earth-system feedbacks.
From this week's government/NGO section:
About half of Americans understand that global warming is increasing homeowners insurance costs, Ettinger et al., Yale University and George Mason University
A large majority of Americans (82%) say the cost of homeowners insurance is increasing, including about two-thirds (66%) who say it is increasing “a lot.” A majority of Americans (69%) think disasters such as hurricanes, floods, and wildfires contribute to increasing homeowners insurance costs, including nearly half (47%) who say such disasters contribute “a lot.” About half of Americans (48%) think global warming contributes to increasing homeowners insurance costs. More Democrats than Republicans say that global warming contributes to the increasing cost of homeowners insurance. Although many Americans understand that global warming contributes to rising homeowners insurance costs, more attribute the cost increases to corporate profits, disasters (such as hurricanes, floods, and wildfires), inflation, and rising property values. Democrats and Republicans hold similar views about these other factors’ roles in increasing insurance costs.
Reporting extreme weather and climate change. A Guide for Journalists, Ben Clarke and Friederike Otto, World Weather Attribution
Extreme weather events, such as heatwaves, heavy rainfall, storms and droughts, are becoming more frequent and stronger in many parts of the world as a result of human-caused climate change. However, not all events are becoming more likely, and changes are uneven across the world. These events often have widespread effects on society, including the loss of crops and farmland, destruction of property, severe economic disruption and loss of life. Following an extreme event with severe impacts, a great deal of public interest is generated in its causes. Increasingly, the dominant question is: “Was this event caused by climate change?” This guide is intended to help journalists navigate this question.
74 articles in 46 journals by 443 contributing authors
Physical science of climate change, effects
Changes in atmospheric circulation amplify extreme snowfall fueled by Arctic sea ice loss over high-latitude land, Liu et al., Weather and Climate Extremes Open Access 10.1016/j.wace.2025.100802
Climate-sensitive chemical weathering feedbacks in a Glacial River Basin, Northeast Qinghai-Tibet Plateau, Li et al., Global and Planetary Change 10.1016/j.gloplacha.2025.105053
Enhanced West Antarctic ice loss triggered by polynya response to meridional winds, O'Connor et al., 10.5194/egusphere-egu25-13728
The Fix is In
Posted on 10 September 2025 by Guest Author
This is a re-post from The Climate Brink by Andrew Dessler
My last post described our 450-page response to the DOE Climate Working Group report. This DOE report seems designed to muddy the waters about climate science — it’s a new iteration of the Merchants of Doubt. We found the report used selective misquoting of the scientific literature (cherry picking), omission of contrary results from the scientific literature, and simple errors due to a lack of understanding of the science to reach its conclusions. Further commentary of the process is in this post.
A reporter asked me for a comment on a post on Dr. Judy Curry’s blog about our review of the DOE Climate Working Group report. In her post, she said:
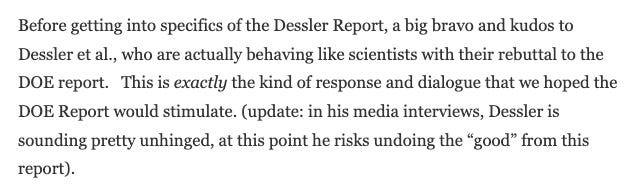
Let me first say, wow, this is generous and far better than I expected. Only referring to me as “unhinged” once is a W and I’ll take it. Near the end of her post, she wrote:
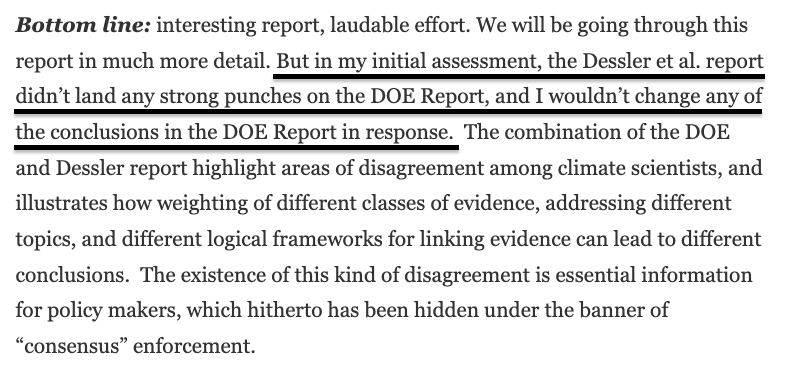
When I read the underlined portion (added by me), I said to myself, “so that’s how they’re going to do it.” Yes, the fix is in — everyone should understand that this is a show trial for climate science and the inevitable outcome of this “debate” will be that climate science is found to be too uncertain to justify climate policy. And now I think I know how they’ll do it.
Let me walk you through it, starting with an explanation of how peer review works.
Fact brief - Has Arctic sea ice recovered?
Posted on 9 September 2025 by Sue Bin Park
![]() Skeptical Science is partnering with Gigafact to produce fact briefs — bite-sized fact checks of trending claims. You can submit claims you think need checking via the tipline.
Skeptical Science is partnering with Gigafact to produce fact briefs — bite-sized fact checks of trending claims. You can submit claims you think need checking via the tipline.
Has Arctic sea ice recovered?
Arctic sea ice, in both extent and volume, continues to decline.
The only fair comparison for Arctic sea ice is to a full 12 months prior, as ice accumulates each winter and melts each summer.
By that metric, Arctic sea ice extent set a record low maximum in March 2025, the month when ice is at its highest. Arctic sea ice volume for July 2025 was the 5th lowest on record.
There are two types of sea ice: thin “first-year” ice and thick “multi-year” ice. First-year ice grows and shrinks with the seasons and fluctuations in ocean currents and wind patterns.
These short-term ups and downs do not change the decline of multi-year ice. Satellite records since 1979 show continued loss in both extent and volume of multi-year ice.
Since that year, June ice extent loss has totaled more than 3 million square kilometers, nearly twice the size of Alaska.
Go to full rebuttal on Skeptical Science or to the fact brief on Gigafact
This fact brief is responsive to quotes such as this one.
Sources
NSIDC Sea Ice Today
NSIDC Sea Ice - Science
Polar Science Center PIOMAS Arctic Sea Ice Volume Reanalysis
NSIDC The peak of summer, the depths of winter
Please use this form to provide feedback about this fact brief. This will help us to better gauge its impact and usability. Thank you!
The merchants of doubt are back
Posted on 8 September 2025 by Guest Author
This is a re-post from The Climate Brink by Andrew Dessler
If you don’t follow climate policy closely, you may not know that the Trump administration is launching an effort to overturn one of the most fundamental pillars of American climate policy: the scientific finding that carbon dioxide endangers human health and welfare (the so-called “Endangerment Finding”). If successful, this move could unravel virtually every U.S. climate regulation on the books, from car emissions standards to power plant rules.
To support this effort, the Department of Energy hand-selected five climate contrarians who dispute mainstream science to write a report, which ended up saying exactly what you would expect it to say: climate science is too uncertain to justify policies to limit warming.
I’m guessing that the goal here is very much like what the tobacco companies did in the 1960s, 1970s, and 1980s. Their goal was not to win the debate that cigarettes were safe — they clearly understood they could not — but to muddy the waters enough to head off regulations on their business.
Thus, the DOE report is designed to do exactly the same thing: muddy the waters enough that the government can claim there’s too much uncertainty to regulate carbon dioxide.
I am part of a group of 85+ scientists who have submitted a 400+ page comment to the DOE critiquing their report. You can find a link to the comment and our press release here. If you are a reporter, science communicator, podcaster, etc., who wants an interview, please email us.
You can find bios for the author team here. It is a humbling group to be a part of, full of brilliant and high-achieving individuals, many of whom I have admired for years. The team’s ranks include six members of the National Academy of Sciences, two Fellows of the Royal Society, at least two MacArthur “Genius” Fellowship recipients, and numerous Fellows of the American Geophysical Union, American Meteorological Society, and the American Association for the Advancement of Science. Reinforcing their prominence in the field, many of these authors also wrote papers that were (mis)cited by the DOE report.
2025 SkS Weekly Climate Change & Global Warming News Roundup #36
Posted on 7 September 2025 by BaerbelW, John Hartz, Doug Bostrom
A listing of 28 news and opinion articles we found interesting and shared on social media during the past week: Sun, August 31, 2025 thru Sat, September 6, 2025.
Stories we promoted this week, by category:
Climate Policy and Politics (8 articles)
- How to organize a peaceful and effective climate protest "Are you ready to organize your first event on behalf of the planet? Here are some ideas and tips on how to make it successful." Yale Climate Connections, Colleen M. Crary, Aug 28, 2025.
- Historians See Autocratic Playbook in Trump’s Attacks on Science "Authoritarians have long feared and suppressed science as a rival for social influence. Experts see President Trump as borrowing some of their tactics. The New York Times, William J. Broad, Aug 31, 2025.
- Trump cuts to climate satellites will make weather prediction harder, scientists say The Trump administration is scrapping satellite observations of Earth that officials say go beyond the essential task of predicting the weather. Washingto Post, Scott Dance, Sep 1, 2025.
- Dozens of scientists find errors in a new Energy Department climate report NPR News, Julia Somon, Sep 2, 2025.
- The merchants of doubt are back But this time, it's the U.S. government pushing doubt The Climate Brink, Andrew Dessler, Sep 02, 2025.
- Meet the UN-backed `green` investors` group that invested in fossil fuels Despite having pledged to reach net-zero emissions, major members of Net Zero Asset Managers hold billions of dollars’ worth of fossil-fuel stocks, including those in “carbon bomb” projects, while marketing their funds as green and sustainable. DeSmog, Giorgio Michalopoulos and Stefano Valentino, Sep 03, 2025.
- The fix is in Judy Curry unwittingly spills the beans The Climate Brink, Andrew Dessler, Sep 04, 2025.
- The Trump Administration Wants to Switch Off Climate Satellites The Trump administration wants to switch off and possibly destroy the climate-monitoring technology. New York Times, Sachi Kitajima Mulkey, Sep 05, 2025.
Climate Change Impacts (6 articles)
- Summer 2025 ranks among Spain's hottest ever after historic August heatwave "Extended periods of high temperatures this summer have significantly increased wildfire risks and put vulnerable communities on alert across Spain.? Green, EuraNews, Aug , Jesús Maturana, Aug 26, 2025.
- Deadly Floods in Punjab Devastate Pakistan’s Breadbasket Housing communities and businesses that rely on agriculture have been destroyed in the country’s largest province." Asia Pacific, by Elian Peltier & Zia ur-Rehman, Photographs by Asim Hafeez, by Asim Hafeez, Aug 31, 2025.
- ‘It happened so fast’: the shocking reality of indoor heat deaths in Arizona " ‘It happened so fast’: the shocking reality of indoor heat deaths in Arizona Heat deaths could surge in the state as energy poverty linked to Trump’s energy and trade policies burns" US News, The Guardian, Nina Lakhani, Aug 31, 2025.
- Climate change is making rollercoaster harvests the new normal Phys.org, University of British Columbia, Sep 03, 2025.
- Japan and South Korea record hottest summers in history "Record temperatures come amid scientists’ warnings that climate change is causing more frequent extreme weather events." Aljelzeera, Staff, Sep 3, 2025.
- Humans Are Altering the Seas. Here’s What the Future Ocean Might Look Like. "Some marine ecosystems could soon be unrecognizable, according to new research." Interactives, The New York Times, by Delger Erdenesanaa Graphics by Mira Rojanasakul; Photographs and Video by Madeline Gray, Dec 24, 2025.
Skeptical Science New Research for Week #36 2025
Posted on 4 September 2025 by Doug Bostrom, Marc Kodack
Open access notables
Special: The Practice and Assessment of Science: Five Foundational Flaws in the Department of Energy's 2025 Climate Report, AMS Council, American Meteorological Society
Here we identify five foundational flaws in the Department of Energy’s (DoE’s) 2025 Climate Synthesis report[1]. Each of these flaws, alone, places the report at odds with scientific principles and practices. For the report to accurately characterize scientific understanding and to be useful as a basis for informed policy and decision making, the DoE must first rectify all five flaws and then conduct a comprehensive assessment of scientific evidence. Were DoE to do so, the result will almost certainly be conclusions that are broadly consistent with previous comprehensive scientific assessments of climate change, such as those from the National Academies of Sciences, Engineering, and Medicine (NASEM); American Association for the Advancement of Science (AAAS); Intergovernmental Panel on Climate Change (IPCC), American Meteorological Society (AMS), and a wide-range of other scientific organizations.
[See also first item in gov/NGO reports section, Climate Experts’ Review of the DOE Climate Working Group Report.]
Anthropogenic forcing drives equatorward migration of heatwave locations across continents, Feng et al., Nature Communications
Heatwaves have increased in frequency, intensity, duration, and spatial extent, posing a serious threat to socioeconomic development, natural ecosystems and human health worldwide. Assessments of trends in heatwave locations (HWL) have been hindered by the distinct regional characteristics of heatwaves across continents. Here we identify a consistent striking equatorward migration in the average latitudinal location of heatwaves occurrence over the period 1979−2023 based on various datasets. The trends of HWL in each hemisphere illustrate equatorward migration at a rate of approximately one degree of latitude per decade, which falls well into the extent of the estimated rate in the observed intertropical convergence zone contraction and the contrast in soil moisture between tropics and subtropics. Our analyses suggest that anthropogenic contribution plays a dominant role in the equatorward trends. The equatorward migration, which has already occurred and is projected to continue in future scenarios, highlights that the risk of damages and disasters caused by heatwaves may increase at lower latitudes.
How climate change and deforestation interact in the transformation of the Amazon rainforest, Franco et al., Nature Communications
The Amazon rainforest is one of Earth’s most diverse ecosystems, playing a key role in maintaining regional and global climate stability. However, recent changes in land use, vegetation, and the climate have disrupted biosphere-atmosphere interactions, leading to significant alterations in the water, energy, and carbon cycles. These disturbances have far-reaching consequences for the entire Earth system. Here, we quantify the relative contributions of deforestation and global climate change to observed shifts in key Amazonian climate parameters. We analyzed long-term atmospheric and land cover change data across 29 areas in the Brazilian Legal Amazon from 1985 to 2020, using parametric statistical models to disentangle the effects of forest loss and alterations of temperature, precipitation, and greenhouse gas mixing ratios. While the rise in atmospheric methane (CH4) and carbon dioxide (CO2) mixing ratios is primarily driven by global emissions (>99%), deforestation has significantly increased surface air temperatures and reduced precipitation during the Amazonian dry season. Over the past 35 years, deforestation has accounted for approximately 74% of the ~ 21 mm dry season−1 decline and 16.5% of the 2°C rise in maximum surface air temperature. Understanding the interplay between global climate change and deforestation is essential for developing effective mitigation and adaptation strategies to preserve this vital ecosystem.
Global Warming Induced Changes in Extreme Precipitation in the Western United States: Projections From Dynamically Downscaled CMIP6 GCMs, Adhikari et al., Geophysical Research Letters
This study uses 25 CMIP6 global climate model simulations, bias-corrected and dynamically downscaled to 9 km, to examine regional changes in extreme precipitation, and predictive uncertainty, in the western United States under global warming levels (GWL) of 2°C and 3°C. This resolution is needed to capture orographic precipitation enhancement. Most models agree on significant increases in both the Rx1day and R99p indices. The largest increases in extreme precipitation are anticipated in California, both in an absolute sense, with Rx1day increases up to ∼10 mm/day, and in a relative sense, with up to a doubling of R99p in the more arid parts of the state for GWL 3°C. The most significant reductions in return intervals of extreme precipitation events are anticipated in the Rocky Mountain region. For instance, 50-year Rx1day events become 3 to 4 times more frequent under GWL 2°C and 6 to 8 times more frequent under GWL 3°C.
This study is funded by the National Science Foundation under Grant OIA-2149105 and enabled by University of Wyoming award WYOM0143 that provided access to the resources of the NCAR Wyoming Supercomputer Center.
Hottest year in recorded history compounds global biodiversity risks, Merow et al., Proceedings of the National Academy of Sciences
As climate change accelerates, effectively monitoring and managing the growing impacts on biodiversity is an urgent priority. Here, we identify the exposure of species to unprecedented heat to evaluate the potential impact of 2024—the hottest year on record—across >33,000 vertebrate species worldwide. One in six (5,368) species were exposed to unprecedented temperatures across >25% of their range—68% more species than in 2023. Most (81%) species exposed in 2023 were also exposed in 2024, potentially compounding risks. For the first time, widespread species were exposed to extreme temperatures across >10% of their ranges. We propose using these exposure estimates to inform monitoring and mitigation efforts to avoid the worst impacts of climate change.
From this week's government/NGO section:
Climate Experts’ Review of the DOE Climate Working Group Report, Dressler et al., Ad hoc
On behalf of the more than 85 experts who contributed to the Climate Experts’ Review of the DOE Climate Working Group Report, we are writing to submit this compendium of public comments on the Climate Working Group (CWG) Report entitled A Critical Review of Impacts of Greenhouse Gas Emissions on the U.S. Climate, under docket number DOE-HQ-2035-0207. As explained at length in these comments, the CWG report currently fails to adequately represent the scientific understanding of climate change. DOE must subject the CWG report to unbiased, robust, and transparent peer review under the Information Quality Act and other federal requirements. Accordingly, it will require very substantial revision before it can be relied upon by any federal agency or other entity.
[See also American Meteorological Society Responds to DOE Climate Synthesis Report]
Value of Wind in Winter 2024/25, Daymark Energy Advisors, Renew Northwest
The authors examine the potential New England regional market and Massachusetts ratepayer impacts if 3,500 MW of contracted offshore wind projects had been generating last winter between December 2024-February 2025. This study is intended as a high level, indicative analysis of some key environmental and market benefits; it does not attempt to capture all benefits of offshore wind. Meteorological data shows that offshore wind could have produced 3.6 billion kilowatt-hours of electricity in winter 2024/25, enough to power 567,759 homes for an entire year. The authors hourly dispatch analysis indicates that emission-free offshore wind generation would have offset natural gas, oil and coalfired generation, reducing fossil fuel burned by 34 million MMBtu over the 3-month period. Greenhouse gas emissions savings of 1.8 million tons is equivalent to removing almost 400,000 passenger cars from the road for a year.
116 articles in 50 journals by 674 contributing authors
Physical science of climate change, effects
Enhanced Relationship Between Stratospheric Sudden Warming and the Madden–Julian Oscillation in Recent Two Decades, Ma et al., Geophysical Research Letters Open Access 10.1029/2025gl117289
Human-induced changes in extreme cold surges across the Northern Hemisphere, Nie et al., Nature Communications Open Access 10.1038/s41467-025-62576-2
Recent asymmetric tropical ocean warming has altered regional propagation of Madden-Julian Oscillation, Kim et al., Communications Earth & Environment Open Access 10.1038/s43247-025-02652-z
Climate Adam - The Dumbest Climate Denial Ever?
Posted on 3 September 2025 by Guest Author
This video includes personal musings and conclusions of the creator climate scientist Dr. Adam Levy. It is presented to our readers as an informed perspective. Please see video description for references (if any).
As the northern hemisphere experiences summer, we have also been experiencing the disastrous impacts of climate change - extreme weather like heatwaves droughts; records being smashed time and time again; and wildfires raging through our cities and our forests. But despite the fact that we're seeing unprecedented conditions, some are still claiming that all this can be explained by simply saying "It's Called Summer". But this form of climate denial - that today's conditions are normal summer, rather than a symptom of a changed climate - is surprisingly widespread... despite also being nonsensical. In this video, I get into why this kind of argument holds back climate action.
Support ClimateAdam on patreon: https://patreon.com/climateadam
Fact brief - Is global warming actually happening?
Posted on 2 September 2025 by Sue Bin Park
![]() Skeptical Science is partnering with Gigafact to produce fact briefs — bite-sized fact checks of trending claims. You can submit claims you think need checking via the tipline.
Skeptical Science is partnering with Gigafact to produce fact briefs — bite-sized fact checks of trending claims. You can submit claims you think need checking via the tipline.
Is global warming actually happening?
 Multiple indicators show Earth is warming rapidly.
Global surface temperatures are now about 1.47°C (2.65°F) above the 19th century average, with the past ten years the warmest on record. Surface temperatures are measured by thousands of land weather stations and weather balloons, along with ships, ocean buoys, and satellite measurements. Oceans, which absorb over 90% of excess heat, hit record highs in 2024, making the last decade the warmest since the 1800s.
Sea levels are rising at the fastest rate in 2,500 years, driven by melting ice sheets and the thermal expansion of seawater. Polar regions are losing ice, while heatwaves and droughts are becoming more intense and frequent.
Atmospheric CO2 reached 428 ppm in July 2025, or 50% higher than preindustrial levels, before large-scale fossil fuel use. Evidence from air, land, oceans, and ice all point to global warming, with human activity as the primary cause.
Go to full rebuttal on Skeptical Science or to the fact brief on Gigafact
This fact brief is responsive to quotes such as this one.
Sources
NASA Carbon Dioxide
NASA Global Temperature
NASA How do scientists measure global temperature?
NASA Ocean Warming
NASA Sea Level
World Meteorological Organization Climate change and heatwaves
CarbonBrief ‘Multi-year’ droughts have become more frequent, drier and hotter over past 40 years
Please use this form to provide feedback about this fact brief. This will help us to better gauge its impact and usability. Thank you!
Climate Sensitivity
Posted on 1 September 2025 by Ken Rice
This is a re-post from And Then There's Physics
- The 66% range is 2.6–3.9 K for the Baseline calculation and remains within 2.3–4.5 K under robustness tests.
- the corresponding 5–95% ranges are 2.3–4.7 K, bounded by 2.0–5.7 K.
- all three lines of evidence are difficult to reconcile with an equilibrium climate sensitivity, characterised by an effective sensitivity S, below 2K.
- the paleoclimate evidence provides the strongest evidence against S > 4.5 K.
All of this seems quite reasonable. A likely range from just above 2K to about 4.5K, little evidence to support an equilibrium climate sensitivity below 2K, and evidence against it being above 4.5K.
Unsurprisingly, however, Nic Lewis has views. He has a published a response in which he objectively combines climate sensitivity evidence and finds that
[t]he estimates of long-term climate sensitivity are much lower and better constrained (median 2.16 °C, 17–83% range 1.75–2.7 °C, 5–95% range 1.55–3.2 °C)
and that
[t]his sensitivity to the assumptions employed implies that climate sensitivity remains difficult to ascertain, and that values between 1.5 °C and 2 °C are quite plausible.
As far as I can tell, the differences are mostly due to different choices about the various parameters. Given that different choices of values can give such large variations in the results, does seem to suggest that climate sensitivity remains difficult to ascertain. However, it’s less clear that values between 1.5 °C and 2 °C are quite plausible, although it does depend on what one means by plausible.
2025 SkS Weekly Climate Change & Global Warming News Roundup #35
Posted on 31 August 2025 by BaerbelW, John Hartz, Doug Bostrom
A listing of 29 news and opinion articles we found interesting and shared on social media during the past week: Sun, August 24, 2025 thru Sat, August 30, 2025.
Stories we promoted this week, by category:
Climate Policy and Politics (9 articles)
- Trump Administration Orders Work Halted on Wind Farm That Is Nearly Built "The order to stop construction on Revolution Wind off the coast of Rhode Island is part of a campaign against renewable energy." Climate, New York Times, Lisa Friedman, Brad Plumer & Maxine Joselow, Aug 22, 2025.
- Trump's bogus claim about a 'climate religion` is a pathetic political dodge TheHill.com Just In, Lisa H. Sideris, Aug 23, 2025.
- Don`t let Donald Trump undermine your faith in the climate fight | Gina McCarthy The president’s fossil-fuel obsession can’t stop global progress, writes the former Environmental Protection Agency head The Guardian, Gina McCarthy, Aug 24, 2025.
- Scientists give harsh grades to Trump administration work aimed at undoing a key climate finding Phys.org, Seth Borenstein and Michael Phillis, Aug 26, 2025.
- 20 years after Katrina, New Orleans’ levees are sinking and short on money Grist, Jake Bittle, Aug 27, 2025.
- Why the US government is trying to revive the climate change `debate` The Department of Energy is calling for "honest dialogue." It looks a lot like a playbook from the past. Grist, Kate Yoder, Aug 27, 2025.
- Trump, With Tariffs and Threats, Tries to Strong-Arm Nations to Retreat on Climate Goals "The president has made no secret of his distaste for wind and solar in America. Now he’s taking his fossil fuel agenda overseas." Trump Administration, New York Times, Lisa Friedman, Aug 27, 2025.
- The Endangerment Finding: The Local Perspective Matters Right Now (Template Comment Letter Linked) Climate Law Blog, Amy Turner, Aug 29, 2025.
- Scientists breathe new life into climate website after shutdown under Trump Climate.gov, which went dark this summer, set to be revived by volunteers as climate.us with expanded mission Environment The Guardian, Eric Holthaus, Aug 30, 2025.
Climate Change Impacts (9 articles)
- The New American Inequality: The Cooled vs. the Cooked New York Times, Opinion by Jeff Goodell, Aug 20, 2025.
- World’s climate change crisis has tourists seeking ‘coolcations’ The Strits Times, Staff, Aug 23, 2025.
- Another pause? And then, there's physics, Ken Rice, Aug 24, 2025.
- Vietnam plans mass evacuation, China’s Sanya shuts as Typhoon Kajiki intensifies CNN, Reuters, Aug 24, 2025.
- Record-breaking rainfall flooded Charleston this weekend. What’s next for hurricane season? Charleston News, Post & Courier, Kailey Cota, Aug 24, 2025.
- Wildfire in Oregon destroys 4 homes, threatens thousands more, as Northern California blaze prompts evacuations CNN Weather, AP, Aug 25, 2025.
- Twenty Years After Hurricane Katrina, Experts Fear Trump’s Cuts Will End in a Repeat Catastrophe "Two decades after Hurricane Katrina devastated New Orleans, the Trump administration is on a mission to defund the agency dedicated to disaster response and recovery." Today's Climate, Inside Climate News, Kiley Price, Aug 26, 2025.
- Guest post: Is climate change making UK droughts worse? The year 2025 has seen exceptionally dry conditions in many parts of the UK. Carbon Brief, Guest Authors: Jamie Hannaford, Lucy Barker, Dr Wilson Chan and Steve Turner, Aug 26, 2025.
- Collapse of critical Atlantic current is no longer low-likelihood, study finds "Scientists say ‘shocking’ discovery shows rapid cuts in carbon emissions are needed to avoid catastrophic fallout" Environment, The Guardian, Damian Carrington, Aug 28, 2025.
Skeptical Science New Research for Week #35 2025
Posted on 28 August 2025 by Doug Bostrom, Marc Kodack
Open access notables
Evaluating IPCC Projections of Global Sea-Level Change From the Pre-Satellite Era, Törnqvist et al., Earth's Future Open Access 10.1029/2025ef006533
With an acceleration of global sea-level rise during the satellite altimetry era (since 1993) firmly established, it is now appropriate to examine sea-level projections made around the onset of this time period. Here we show that the mid-range projection from the Second Assessment Report of the IPCC (1995/1996) was strikingly close to what transpired over the next 30 years, with the magnitude of sea-level rise underestimated by only ∼1 cm. Projections of contributions from individual components were more variable, with a notable underestimation of dynamic mass loss from ice sheets. Nevertheless—and in view of the comparatively limited process understanding, modeling capabilities, and computational resources available three decades ago—these early attempts should inspire confidence in presently available global sea-level projections. Such multidecadal evaluations of past climate projections, as presented here for sea-level change, offer useful tests of past climate forecasts, and highlight the essential importance of continued climate monitoring.
Svalbard’s 2024 record summer: An early view of Arctic glacier meltdown?, Schuler et al., Proceedings of the National Academy of Sciences
A record-breaking melt season affected the Arctic glaciers of Svalbard in summer 2024 by a substantial margin. Across the entire archipelago, glacier melting corresponded to an anomaly of up to four SD and exceeded any previous observation. The pan-Svalbard mass loss in summer 2024 amounts to ~61.7 ± 11.1 Gt and corresponds to 1% of the total ice volume on Svalbard and is comparable to that of the Greenland ice sheet (55 ± 35 Gt), which occupies an area about 50 times larger. Altogether, Svalbard and other glacier regions surrounding the Barents Sea lost 102.1 ± 22.9 Gt of ice in a single year and contributed 0.27 ± 0.06 mm (of which 0.16 mm alone is due to Svalbard) to global sea-level, putting the circum-Barents region among the strongest contributors to global sea-level rise in 2024. Most of the 2024 glacier melt occurred during a 6-wk period of persistent atmospheric circulation pattern causing record-high air temperatures, an event with an extremely low recurrence interval under current climate conditions. However, future climate projections suggest that such temperature levels will become increasingly commonplace by the end of the 21st century, potentially even surpassing those of 2024. Svalbard’s summer of 2024 serves as a forecast for future glacier meltdown in the Arctic, offering a glimpse into conditions 70 y ahead.
Attribution of Changes in Canadian Precipitation, Kirchmeier-Young et al., Atmosphere-Ocean
Total precipitation has increased over Canada, annually and seasonally. However, the drivers of this change have not been formally diagnosed. Globally, while changes in total precipitation have been attributed to anthropogenic forcing at larger scales, attribution at sub-continental scales has thus far been very limited. We perform a detection and attribution analysis using an optimal fingerprinting approach based on estimating equations to compare the observed changes in Canadian precipitation against CMIP6-model-based estimates of externally forced signals. For Canada as a whole and Northern Canada specifically, an anthropogenic forcing signal is detected in the observations, annually and for six-month warm and cool seasons over 1959-2018. For Southern Canada, observed records are longer and attribution is more robust at the century scale (1904-2018), where the observed increase in annual precipitation is attributed to anthropogenic forcing. Understanding the dominant role of anthropogenic forcing through a formal attribution analysis increases our confidence in the characterization of both past and future changes in precipitation over Canada.
Extreme Sahelian Rainfall Continues to Rise Despite Stable Storm Frequency, Spät et al., Geophysical Research Letters
Over the past 40+ years, extreme rainfall in the Sahel has increased faster than the mean seasonal rainfall. From the early 1980s to the late 2000s, the changes can be explained by the fact that the strongest storms became more frequent, likely because of changes in wind patterns linked to temperature differences across the region, especially the enhanced warming of the Sahara. However, since the late 2000s, the number of strong storms has stopped increasing, as warming intensified in both the northern Sahara and equatorial Africa and changed the wind pattern. Despite this, extreme rainfall has kept increasing, possibly due to widespread higher moisture levels in the atmosphere, influenced by warming ocean waters in the tropical Atlantic and the Mediterranean.
Physics-Based Indicators for the Onset of an AMOC Collapse Under Climate Change, van Westen et al., Journal of Geophysical Research: Oceans
The Atlantic meridional overturning circulation (AMOC) is an important tipping element in the climate system. There is a large uncertainty whether the AMOC will start to collapse during the 21st century under future climate change, as this requires long climate model simulations which are not always available. Here, we analyze targeted climate model simulations done with the Community Earth System Model (CESM) with the aim to develop a physics-based indicator for the onset of an AMOC tipping event. This indicator is diagnosed from the surface buoyancy fluxes over the North Atlantic Ocean and is performing successfully under quasi-equilibrium freshwater forcing, freshwater pulse forcing, climate change scenarios, and for different climate models. An analysis consisting of 25 different climate models shows that the AMOC could begin to collapse by 2063 (from 2026 to 2095, 25th to 57th percentiles) under an intermediate emission scenario (SSP2-4.5), or by 2055 (from 2023 to 2076, 25th to 75th percentiles) under a high-end emission scenario (SSP5-8.5). When the AMOC collapses, the Northwestern European climate changes drastically and this will likely induce severe societal impacts.
From this week's government/NGO section:
Global climate change as a threat, Poushter et al., Pew Research Center
A median of 67% of adults across 25 nations say global climate change is a major threat to their country. Another 24% say it is a minor threat, and 9% say it is not a threat. In many of the high-income countries that were surveyed in both 2022 and 2025, the share of adults who see climate change as a major threat has decreased significantly. Majorities in all but three countries – Israel, Nigeria and the U.S. – see climate change as a major threat. Around eight-in-ten hold this view in Argentina, Brazil, France, Japan and South Korea. About a quarter of Israelis (24%) say climate change is not a threat – the largest share to take this stance across the countries surveyed. In the U.S., about a fifth of adults (19%) say the same.
Trump’s Unfolding Energy Crisis, Climate Power
Over 64,000 jobs have already been lost or stalled in the clean energy sector since Trump’s election. With rising energy demand driven by AI and extreme heat, gutting clean energy is already taking critical production offline and increasing costs for consumers. Americans across the nation are already seeing their utility costs skyrocket; the average family’s energy bill will increase by $130 annually by 2030 and $170 annually by 2035, with some states expected to see their bills rise by over $400 per year in the next decade.
154 articles in 68 journals by 870 contributing authors
Physical science of climate change, effects
A conceptual framework for understanding longwave cloud effects on climate sensitivity, Kluft et al., Atmospheric Chemistry and Physics Open Access 10.5194/acp-25-9075-2025
Climate forcing due to future ozone changes: an intercomparison of metrics and methods, Collins et al., Atmospheric Chemistry and Physics Open Access 10.5194/acp-25-9031-2025
Controls of the global overturning circulation of the ocean, Roquet et al., npj Climate and Atmospheric Science Open Access pdf 10.1038/s41612-025-01185-8
Another pause?
Posted on 27 August 2025 by Ken Rice
This is a re-post from And Then There's Physics
It seems that a slowdown in the melting of Arctic sea ice is now being used to suggest that climate science is melting. This is very silly and is remininsence of the claims of a pause in global warming that dominated much of the discourse in the 2010s.
Arctic sea ice is a small part of the climate system and it’s well known that variability can easily mask long-term trends on decadal timescales. Arctic sea ice extent was particularly low in 2012, so maybe it’s not that surprising that there’s been an apparent pause since then. A strong El Nino in 1998 that led to a record warm year was one of the main reasons for the subsequent suppposed pause in global warming.
You’d hope that skeptics would have learned by now to not use short-term variability to claim that climate science is somehow broken, but that would be naive. This isn’t about genuinely trying to understand the climate system, it’s just about constructing a narrative that suits their ideology.
I do have a small vested interest in this. The only climate bet I’ve taken is that the average of the 2026/27/28 Arctic sea ice minimum would be smaller than the average of 2011/12/13. It’s not looking all that good for me at the moment, but there’s still a chance, it’s only for a pint and me losing a climate bet doesn’t somehow undermine our basic understanding of climate science.
The surprising reasons floods and other disasters are deadlier at night
Posted on 26 August 2025 by Guest Author
This story by Kate Yoder was originally published by Grist and is part of Covering Climate Now, a global journalism collaboration strengthening coverage of the climate story.
It was 4 a.m. on July 4 at Camp La Junta in Kerr County when Kolton Taylor woke up to the sound of screaming. The 12-year-old boy stepped out of bed and straight into knee-deep floodwaters from the nearby Guadalupe River. Before long, the water had already risen to his waist. In the darkness, he managed to feel for his tennis shoes floating nearby, put them on, and escape to the safety of the hillside. All 400 people at the all-boys camp survived, even as they watched one of their cabins float away in the rushing river. But 5 miles downriver at Camp Mystic, 28 campers and counselors were killed.
The flash flooding in Texas would have been catastrophic at any time of day, but it was especially dangerous because it happened at night. Research shows that more than half of deaths from floods happen after dark, and in the case of flash floods, one study put the number closer to three-quarters. Other hazards are more perilous in the dark, too: Tornadoes that strike between sunset and sunrise are twice as deadly, on average, as those during the day. No one can stop the sun from rising and setting, but experts say there are simple precautions that can save lives when extreme weather strikes at night. As climate change supercharges floods, hurricanes, and fires, it’s becoming even more important to account for the added risks of nocturnal disasters.
Stephen Strader, a hazards geographer at Villanova University, said that at night, it’s not enough to rely on a phone call from a family member or outdoor warning sirens (which Kerr County officials discussed installing, but never did). The safest bet is a NOAA radio, a device that broadcasts official warnings from the nearest National Weather Service office 24/7. One major advantage is that it doesn’t rely on cell service.
“That’s old-school technology, but it’s the thing that will wake you up and get you up at 3 a.m.,” said Walker Ashley, an atmospheric scientist and disaster geographer at Northern Illinois University.
Record solar growth keeps China’s CO2 falling in first half of 2025
Posted on 25 August 2025 by Guest Author
This is a re-post from Carbon Brief by Lauri Myllyvirta
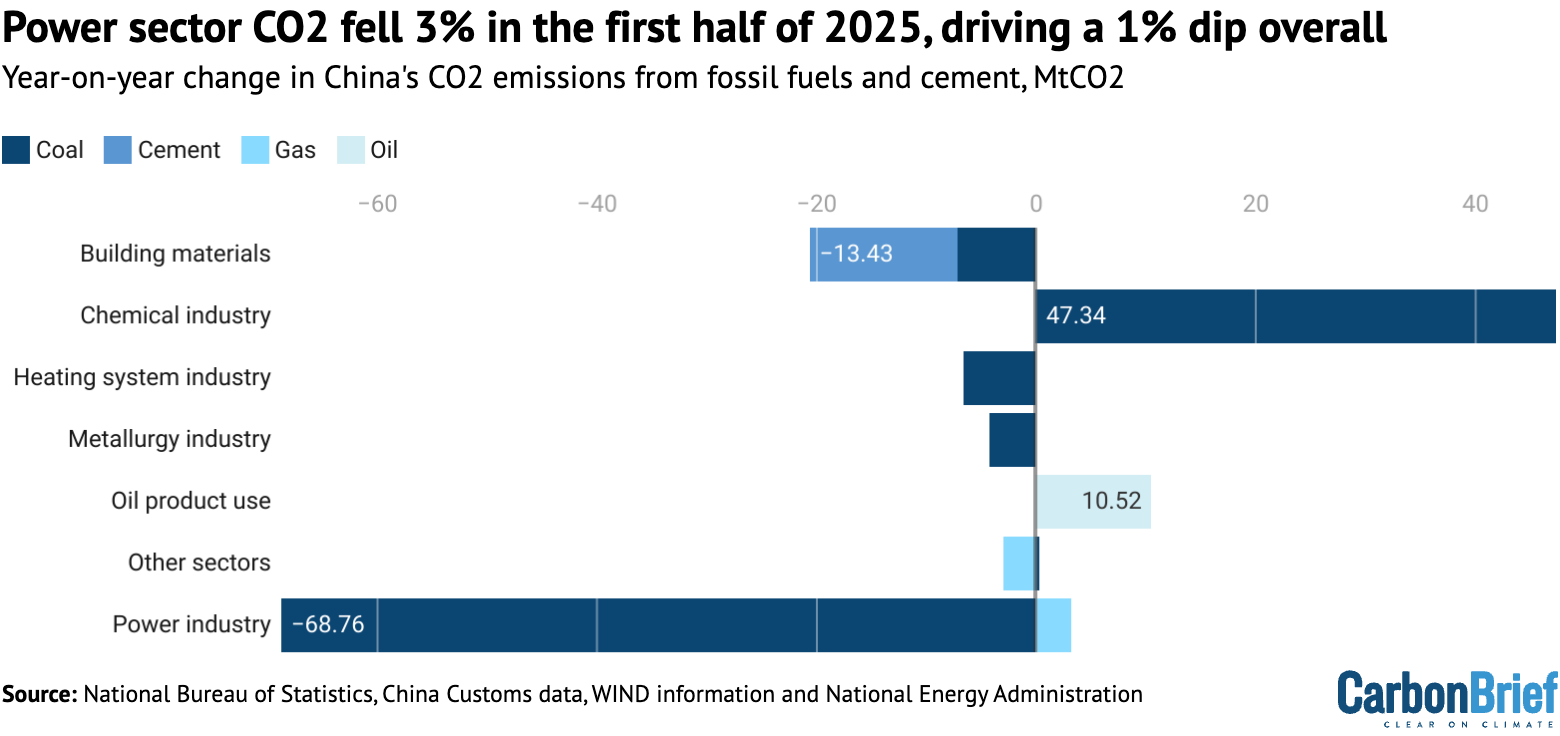
Clean-energy growth helped China’s carbon dioxide (CO2) emissions fall by 1% year-on-year in the first half of 2025, extending a declining trend that started in March 2024.
The CO2 output of the nation’s power sector – its dominant source of emissions – fell by 3% in the first half of the year, as growth in solar power alone matched the rise in electricity demand.
The new analysis for Carbon Brief shows that record solar capacity additions are putting China’s CO2 emissions on track to fall across 2025 as a whole.
Other key findings include:
- The growth in clean power generation, some 270 terawatt hours (TWh) excluding hydro, significantly outpaced demand growth of 170TWh in the first half of the year.
- Solar capacity additions set new records due to a rush before a June policy change, with 212 gigawatts (GW) added in the first half of the year.
- This rush means solar is likely to set an annual record for growth in 2025, becoming China’s single-largest source of clean power generation in the process.
- Coal-power capacity could surge by as much as 80-100GW this year, potentially setting a new annual record, even as coal-fired electricity generation declines.
- The use of coal to make synthetic fuels and chemicals is growing rapidly, climbing 20% in the first half of the year and helping add 3% to China’s CO2 since 2020.
- The coal-chemical industry is planning further expansion, which could add another 2% to China’s CO2 by 2029, making the 2030 deadline for peaking harder to meet.
Even if its emissions fall in 2025 as expected, however, China is bound to miss multiple important climate targets this year.
This includes targets to reduce its carbon intensity – the emissions per unit of GDP – to strictly control coal consumption growth and new coal-power capacity, as well as to increase the share of cleaner electric-arc steelmaking in total steel output.
If policymakers want to make up for these shortfalls, then there will be additional pressure on China’s next “nationally determined contribution” (NDC, its international climate pledge for 2035) and its 15th five-year plan for 2026-30, both due to be finalised in the coming months.
The falling trend in CO2 emissions – and the clean-energy growth that is driving it – could give policymakers greater confidence that more ambitious targets are achievable.
Falling emissions from power, cement and steel
The reduction in emissions in the first half of 2025 was predominantly driven by the power sector, aided by the building materials, steel and heating industries.
Coal use in the power industry fell by 3.4% compared with the same period a year earlier, while gas use increased by 6%, resulting in a 3.2% drop in emissions for the sector overall.
The reduction in CO2 emissions from coal use in the power sector is shown at the bottom of the figure below, along with the small rise due to higher gas-fired electricity generation.
Other changes in CO2 emissions in the first half of 2025, compared with the same period in 2024, are broken down by source and sector in the rest of the figure.
2025 SkS Weekly Climate Change & Global Warming News Roundup #34
Posted on 24 August 2025 by BaerbelW, John Hartz, Doug Bostrom
A listing of 30 news and opinion articles we found interesting and shared on social media during the past week: Sun, August 17, 2025 thru Sat, August 23, 2025.
Stories we promoted this week, by category:
Climate Change Impacts (13 articles)
- Summer 2025 is roasting hot: these charts show why it matters Data reveal how this year’s back-to-back heatwaves are affecting populations and economies across Europe. Nature, Giorgia Guglielmi, Aug 14, 2025.
- Flash floods kill at least 159 people in Pakistan after huge cloudburst "Search for the missing continues in north-west after downpour also sparks deadly flooding and landslides in India" World, The Guardian, Associated Press in Chositi, Aug 15, 2025.
- ‘Hellish’: heatwave brings hottest nights on record to the Middle East "Temperatures did not drop below 36C in Sedom, Israel on Tuesday night, while several parts of Jordan stayed above 35C on Monday" World, The Guardian, Ajit Niranjan, Aug 15, 2025.
- El Paso’s Heat Is Killing in Record Numbers. It May Only Get Worse "In El Paso, heat deaths hit record highs in 2023 and 2024. Advocates say not enough is being done to protect the region’s most vulnerable people."El Paso’s Heat Is Killing in Record Numbers. It May Only Get Worse Justice & Health, Inside Climate News, Story by Martha Pskowski, photos by Paul Ratje, Aug 17, 2025.
- ‘Pray for rain’: wildfires in Canada are now burning where they never used to Lede: "Canada’s response to the extreme weather threat is being upended as the traditional epicentre of the blazes shifts as the climate warms" World, The Guardian, Leyland Cecco in Toronto, Aug 17.
- Wildfires rage in Spain and Portugal amid searing heat Extreme temperatures exacerbated by carbon pollution fuel fires in southern Europe as green policies are rolled back The Guardian, Ajit Niranjan and Sam Jones, Aug 18, 2025.
- Extraordinary Erin expands its reach over the northwest Atlantic "And another disturbance could intensify and reach the northern Leeward Islands as soon as the upcoming weekend." Eye on the Stor, Yale Cimarss, Bob Henson, Aug 18, 2025.
- Guest post: Why the recent slowdown in Arctic sea ice loss is only temporary "The retreat of sea ice in the Arctic has long been a prominent symbol of climate change." Guest Post, Carbon Brief, Dr Mark England, Aug 19, 2025.
- Hurricane Erin threatens dangerous surf for much of the East Coast as a new tropical system brews in its wake CNN Weather, Briana Waxman & Mary Gilbert, Aug 19, 2025.
- Extreme heat wave with temperatures above 110 for some looms for Southwest "The hottest weather is forecast for Furnace Creek in California's Death Valley National Park, where a temperature of 120 degrees is expected Friday." NBC News, Dennis Romero, Aug 19, 2025.
- At Europe's melting glaciers, signs of climate peril are everywhere "Europe's glaciers are shrinking faster than anywhere else on Earth, leaving behind unstable landscapes." Climate Change, NBC News, Molly Hunter & Sara Monetta, Aug 19, 2025.
- These places will be hit by big waves and coastal flooding as Hurricane Erin passes "Hurricane Erin will bring dangerous surf and possible flooding to a dozen states from Wednesday to Friday. Find out if your area has weather alerts for the storm." Weather, Washington Post, Ben Noll, Aug 20, 2025.
- Antarctica is in extreme peril "Abrupt changes" threaten to send the continent past the point of no return, a new study finds. Grist, Matt Simon, Aug 22, 2025.


