


 Arguments


 The planet continues to warm due to human activity; bouts of cold weather don’t change this.
Human-caused climate change increased Hurricane Melissa’s wind speeds by 7% (11 mph, or 18 km/h), leading to a 12% increase in its damages, found researchers at the Imperial College of London in a rapid attribution study just released. A separate study by scientists at Climate Central found that climate change increased Melissa’s winds by 10%, and the near-record-warm ocean waters that Melissa traversed — 1.4 degrees Celsius (2.5°F) warmer than average — were up to 900 times more likely to be that warm because of human-caused climate change.
To study Melissa, the Imperial College of London researchers used the Imperial College Storm Model (IRIS). With the same model last year, the researchers found that climate change increased Hurricane Helene’s wind speeds at landfall by about 11% (13 mph or 21 km/h), and Hurricane Milton’s by 10% (11 mph or 18 km/h). These wind speed increases led to an increase in damage of 44% for Helene and 45% for Milton, they said. Melissa’s relatively low 12% increase in damage with 7% higher winds was so small, they said, because of hurricane of that intensity causes near-total destruction, and there isn’t much more to destroy if the winds increase.
They added that the analysis “likely underestimates the true cost of the hurricanes because it does not capture long-lasting economic impacts such as lost productivity and worsened health outcomes.”

2025 SkS Weekly Climate Change & Global Warming News Roundup #44
Posted on 2 November 2025 by BaerbelW, Doug Bostrom
Stories we promoted this week, by category:
Climate Law and Justice (4 articles)
- Trump and Republicans Join Big Oil`s All-Out Push to Shut Down Climate Liability Efforts Republican attorneys general, GOP lawmakers, industry groups and the president himself are all maneuvering to foreclose the ability of cities and states to hold the fossil fuel industry liable for damages linked to climate change. Inside Climate News, Dana Drugmand, Oct 26, 2025.
- Survivors of Philippines `Super Typhoon` Sue Oil Giant for Causing Climate Emergency The lawsuit centers on Philippine laws stating that citizens have the right to a healthy environment. Common Dreams, Brad Reed, Oct 27, 2025.
- Exxon sues California over climate laws, alleging free speech violations Oil firm asks court to block enforcement of laws that would require disclosure of planet-heating carbon emissions The Guardian, Dharna Noor, Oct 27, 2025.
- Climate change is a crisis of intergenerational justice. It's not too late to make it right The Conversation, Philippa Collin, Judith Bessant, Rob Watts, Oct 28, 2025.
Climate Policy and Politics (4 articles)
- An E.P.A. Plan to Kill a Major Climate Rule Is Worrying Business Leaders Some carmakers and energy executives say the plan would trigger costly litigation and spur individual states to create a patchwork of tighter rules. New York Times, Karen Zraick and Lisa Friedman, Oct 25, 2025.
- How Trump pressures the world into burning more oil and gas Los Angeles Times, Jennifer A. Dlouhy, Akshat Rathi, Oct 29, 2025.
- Ex-EPA head urges US to resist Trump attacks on climate action: `We won`t become numb` Expanded climate action from cities and states could slash planet-heating pollution despite Trump working against it The Guardian, Dharna Noor, Oct 30, 2025.
- The fall of the CBS News climate team David Ellison, the new pro-Trump chief executive of Paramount Skydance, has dismantled the best climate change reporting team in cable news. HEATED, Emily Atkin, Oct 31, 2025.
Climate Education and Communication (3 articles)
- Discover Climate LIVE K12 Sessions for 2025-2026 State of the Planet, Lylia Saurel, Oct 29, 2025.
- How The Visual Power Of Climate Denial Fuels The Spread Of Misinformation StudyFinds, Reviewed by John Anderer, Oct 29, 2025.
- The worst month of climate news in my entire career Youtube, Simon Clark, Oct 31, 2025.
Skeptical Science New Research for Week #43 2025
Posted on 30 October 2025 by Doug Bostrom, Marc Kodack
Open access notables

Hourly Precipitation Intensities at 4-km Resolution Show Statistically Significant Increasing Trends From 1991 to 2022 in the CONUS-404 Hydroclimate Reanalysis, Guilloteau et al., Geophysical Research Letters
Trends in hourly and daily precipitation statistics are studied using the CONUS-404 hydroclimate reanalysis at 4-km spatial resolution over the 1991–2022 period. Only a small fraction of CONUS shows statistically significant trends in the annual precipitation volume, number of wet days and mean wet-day intensity. Significant increasing trends are however found in the mean wet-hour precipitation intensity, with the trends being particularly pronounced in the Midwest. Fourier spectral analysis also attests for changes in the multiscale spatial and temporal organization of precipitation, and reveals that small-scale short-lived precipitation features have intensified at a higher rate than large-scale long-lived features. These results show that, even when no robust trend can be established from low-resolution data, clear trends may emerge at a higher resolution, demonstrating the need for high-resolution precipitation records for climate trend analysis.
Aviation passenger carbon footprint calculator with comprehensive emissions, life cycle coverage, and historical adjustment, McFall et al., Communications Earth & Environment
Passenger aviation carbon footprint calculators often lack breadth, accuracy, transparency, and communication effectiveness, leading to underestimations of environmental impact and mistrust. This study addresses these gaps by developing a comprehensive methodology that broadens scope and improves accuracy. It incorporates nitrogen oxides, water vapour, contrail-induced cloudiness, upstream emissions from in-flight services, and life cycle emissions from aircraft and airports, offering a complete carbon footprint assessment. Accuracy is improved through detailed modelling of flight distance, fuel consumption, and emissions allocation adjusted for passenger class, luggage, and cargo. Historical adjustment factors refine pre-flight estimates by integrating real-world variations. The tool outputs a full emissions breakdown by source, offering unparalleled granularity and clarity. Validated against over 30,000 historical flights, the historical adjustment factor model achieves ~0.5% mean squared percentage error and shows current methods underestimate emissions. This study sets a standard for aviation carbon footprint calculators by enabling transparent, dynamic assessments for industry stakeholders.
Multi-century global and regional sea-level rise commitments from cumulative greenhouse gas emissions in the coming decades, Nauels et al., Nature Climate Change
Sea levels respond to climate change on timescales from decades to millennia. To isolate the sea-level contribution of historical and near-term GHG emissions, we use a dedicated scenario and modelling framework to quantify global and regional sea-level rise commitments of twenty-first century cumulative emissions. Under current climate policies, emissions until 2050 lock in 0.3 m (likely range 0.2–0.5 m) more global mean sea-level rise by 2300 than historical emissions until 2020. This additional commitment would grow to 0.8 m (0.5–1.4 m) for emissions until 2090, of which 0.6 m (0.4–1.1 m) could be avoided under very stringent mitigation. Resulting regional commitments would be around 10% higher than the global signal for the vulnerable Pacific region, mainly due to higher relative Antarctic contributions. Our work shows that multi-century sea-level rise commitments are strongly controlled by mitigation decisions in coming decades.
More than just facts: Countering climate mis-and-disinformation with critical thinking and empathy, Rabe & Paz, PLOS Climate
Simply presenting scientific facts is not enough to help students understand climate change and its complex impacts and solutions. Educators should teach students to critically evaluate climate change information and reflect on how their emotions, experiences, and pre-conceived ideas shape their perspectives. These elements of climate education are essential because students live in an information ecosystem where they may be exposed to mis-and-disinformation about climate change, often produced and disseminated by groups such as the fossil fuel lobby [1]. This mis-and-disinformation builds narratives that regularly find a foothold in individuals by connecting with their belief systems [2]. This dynamic may manifest itself in students that reject climate change-related instruction because it conflicts with their worldview. To counter the impact of this climate change mis-and-disinformation, we present several variably applicable teaching approaches educators can use when teaching their students about climate change. These approaches employ socioemotional learning, critical thinking exercises, and game-based learning to help students assess the accuracy of climate change information and realize how their lived experiences and values connect to the climate crisis. Each approach is highly adaptable and is meant to provide inspiration for new experimentation in countering or prebunking common climate change disinformation.
Drying of the Panama Canal in a Warming Climate, Muñoz et al., Geophysical Research Letters
The Panama Canal is essential to global trade, but its operation is vulnerable to drought. Recent droughts have raised concerns about how the reservoir that feeds the canal's locks, Gatún Lake, will respond to climate change. Using high-resolution climate projections, we simulate future lake levels and find that disruptive low water conditions become increasingly common under moderately high and high emissions scenarios, but not under low-emissions pathways. These changes are primarily driven by reduced wet-season rainfall, though the magnitude of future drying in Central America is uncertain. Our findings highlight the growing risk to one of the key links in the global supply chain and underscore the need for proactive adaptation or mitigation to maintain canal functionality.
From this week's government/NGO section:
Climate Inequality Report 2025. Climate Change: A Capital Challenge. Why Climate Policy Must Tackle Ownership, Lucas Chancel and Cornelia Mohren, editors, World Inequality Lab
Wealthy individuals fuel the climate crisis through their investments, even more than their consumption and lifestyles. At the world level, the top 1% represent 15% of global consumption-based emissions, while they account for 41% of global emissions associated with private capital ownership. Climate change can deepen wealth inequality, while well-designed policies can help reduce it. The top 1% could see their share of world wealth jump from 38% to 46% by 2050 if they own tomorrow’s low-carbon assets. To address the dual challenges of the climate crisis and wealth inequality, the authors explore three policies avenues including a global ban on new fossil fuel investments, a financial investment tax on the carbon content of assets, and major public investment in low-carbon infrastructure.
Climate Plunder: How a powerful few are locking the world into disaster, Dabi et al., Oxfam International
Ahead of the major international climate conference COP30 in Belem, Brazil, new research finds that the high-carbon lifestyles of the super-rich are blowing through the world’s remaining carbon budget - the amount of CO2 that can be emitted while avoiding climate disaster. The research also details how billionaires are using their political and economic influence to keep humanity hooked on fossil fuels to maximize their private profit. The authors present extensive new updated data and analysis which finds that a person from the richest 0.1% produces more carbon pollution in a day than the poorest 50% emit all year. If everyone emitted like the richest 0.1%, the carbon budget would be used up in less than 3 weeks.
114 articles in 58 journals by 842 contributing authors
Physical science of climate change, effects
Is the cloud absorption of solar radiation still underestimated notably by current model-based reanalyses?, FU et al., Advances in Climate Change Research Open Access 10.1016/j.accre.2025.10.003
Linking Atmospheric Waviness to Extreme Temperatures Across the Northern Hemisphere: Comparison of Different Waviness Metrics, Roocroft et al., Journal of Geophysical Research: Atmospheres Open Access 10.1029/2024jd042631
Climate Adam - Can Solar Halt the Desert?
Posted on 29 October 2025 by Guest Author
This video includes personal musings and conclusions of the creator climate scientist Dr. Adam Levy. It is presented to our readers as an informed perspective. Please see video description for references (if any).
Video description
Solar power has become ridiculously cheap. And unbelievably powerful at tackling climate change. Today I discuss two of the most absolutely overpowered places we can build solar photovoltaics: reservoirs (floatovoltaics) and deserts. But the future of solar is so bright, that it's worth building even in less-than-ideal locations. Let's take a look at the sunny story of today's solar PV, and what that means for our climate!
Support ClimateAdam on patreon: https://patreon.com/climateadam
Fact brief - Is there empirical evidence for human-caused global warming?
Posted on 28 October 2025 by Sue Bin Park
![]() Skeptical Science is partnering with Gigafact to produce fact briefs — bite-sized fact checks of trending claims. You can submit claims you think need checking via the tipline.
Skeptical Science is partnering with Gigafact to produce fact briefs — bite-sized fact checks of trending claims. You can submit claims you think need checking via the tipline.
Is there empirical evidence for human-caused global warming?
 There are multiple lines of evidence that our greenhouse gas emissions are warming the planet.
The greenhouse effect is the process whereby “greenhouse” gases such as carbon dioxide create a kind of atmospheric blanket, absorbing outgoing heat energy and re-radiating a portion of it back down to Earth.
CO2 levels surged after humans began burning fossil fuels such as coal and oil. Today, we’re over 420 parts per million — up 50% from pre-industrial times and higher than for millions of years.
We know this increase is from burning fossil fuels, which produce a form of CO2 with extremely low levels of the carbon-14 isotope. The drop of carbon-14 in the atmosphere following the Industrial Revolution is a fossil fuel “fingerprint” of the CO2 spike.
Satellite measurements confirm a decrease in heat energy radiated out into space and an increase in heat energy re-radiated back down to Earth’s surface.
Go to full rebuttal on Skeptical Science or to the fact brief on Gigafact
This fact brief is responsive to quotes such as this one.
Sources
American Institute of Physics The Carbon Dioxide Greenhouse Effect
Columbia University Climate School How Exactly Does Carbon Dioxide Cause Global Warming?
NOAA The Basics: Isotopic Fingerprints
UC San Diego The Keeling Curve
Please use this form to provide feedback about this fact brief. This will help us to better gauge its impact and usability. Thank you!
A “controversial” methane metric?
Posted on 27 October 2025 by Ken Rice
This is a re-post from And Then There's Physics
There’s a recent Carbon Brief article about a supposedly controversial methane metric. The metric in question is GWP*, which I’ve actually written about before. Methane emissions are typically compared to CO2 using a metric known as Global Warming Potential (GWP). These are often measured over periods of 20 years (GWP20) or 100 years (GWP100). For methane GWP20 has a value of about 80, while GWP100 has a value of about 30.
As the Carbon Brief article says, these are often interpreted as suggesting that
one tonne of methane causes the same amount of warming as around 80 tonnes of CO2, when measured over a period of 20 years…….. When calculated over 100 years, methane’s shorter lifetime means it causes around 30 times more warming than CO2.
These metrics highlight that methane is a potent greenhouse gas that can contribute substantially to global warming. The problem is that the interpretation of these metrics is not actually correct. These metrics are computed by integrating the radiative forcing of a pulse of emissions over the relevant time period. However, this doesn’t necessarily correctly represent the warming due to this pulse of emission.
 Credit: Allen et al. (2016)
2025 SkS Weekly Climate Change & Global Warming News Roundup #43
Posted on 26 October 2025 by BaerbelW, Doug Bostrom
Stories we promoted this week, by category:
Climate Policy and Politics (8 articles)
- DeBriefed: Earth`s first `tipping point`; Climate adviser interview; How warming affects children`s health For those interested in keeping up with policy details of our climate blunder and how we're going to deal with it, we recommend Carbon Brief's weekly "Debrief" feature. Carbon Brief, Emma Hancox, Oct 17, 2025.
- US-led alliance wins a year`s delay in adoption of green shipping deal A landmark deal to clean up the global shipping industry’s emissions has been postponed for at least a year, after a successful campaign by the US and Saudi Arabia to delay its adoption. Climate Home News, Joe Lo, Oct 17, 2025.
- Corporate Climate Disclosures in the US and EU: An Expanding Regulatory Landscape Amidst Resistance Climate Law Blog, Pedro Aranguez Diaz, Oct 20, 2025.
- Climate-Warming Methane Emissions from the World`s Biggest Livestock Companies Are Bigger Than From Major Oil and Gas Companies Ahead of the United Nations climate talks in Brazil, advocacy groups are pushing for companies and governments to set meaningful emissions targets to lower emissions from livestock. Inside Climate News, Georgina Gustin, Oct 21, 2025.
- With climate change data disappearing, former NOAA scientists strike back ABC News, David Caulfield, Oct 21, 2025.
- The entire world was ready to reduce shipping emissions. Then Trump stepped in. After the Trump administration threatened countries with tariffs and visa restrictions, a first-ever global carbon tax is left to an uncertain future. Grist, Naveena Sadasivam, Oct 23, 2025.
- Trump knows climate change is real - that's why he wants to mine Greenland "Not only does Trump know climate change is real, he’s banking on it." TheHill, Allison Agsten, Oct 24, 2025.
- We led NOAA - we expect Neil Jacobs to defend it TheHill, Jane Lubchenco, Kathryn Sullivan and Richard Spinrad, opinion contributors, Oct 24, 2025.
Climate Change Impacts (7 articles)
- World`s oceans losing their greenness through global heating, study finds Researchers say decline in phytoplankton suggests weakened planetary capacity to absorb carbon dioxide The Guardian, Jonathan Watts, Oct 17, 2025.
- Europe's climate is changing fast: How it's affecting people and the economy The Conversation, Rosemary Anthony , Oct 20, 2025.
- Climate disasters in first half of 2025 costliest ever on record, research shows LA wildfires and storms this year cost $101bn, new study by non-profit resurrecting work axed by Trump says The Guardian, Oliver Milman, and graphics by Andrew Witherspoon, Oct 22, 2025.
- This is a dangerous new climate reality Dr Gilbz on Youtube, Ella Gilbert, Oct 22, 2025.
- Researchers warn of the urgent need to include the cumulative effects of extreme climate events in penguin conservation Phys.org, Spanish National Research Council, Oct 23, 2025.
- Don't bet against physics Don't be surprised by short term fluctuations in Earth systems as the planet warms. In the long term, heat is hard to overcome. ReportEarth, Chris Mooney, Oct 23, 2025.
- Can the Deadliest Catch crab fishery survive warming seas? Warmer waters in the Bering Sea caused snow crabs to crash. Now, scientists are racing to predict the future of the lucrative fishery Science, Warren Cornwall, Oct 23, 2025.
Skeptical Science New Research for Week #43 2025
Posted on 23 October 2025 by Doug Bostrom, Marc Kodack
Open access notables
Transparency, reproducibility, and acknowledging uncertainty are meritorious attributes of science that differentiate it from other human endeavors, such as politics. But they can also be subverted. In the United States, an executive order from the Trump administration called Restoring Gold Standard Science illustrates how this can be achieved despite it being cloaked in language that most of the scientific community would enthusiastically support. The order seeks to “to ensure that federally funded research is transparent, rigorous, and impactful, and that Federal decisions are informed by the most credible, reliable, and impartial scientific evidence available,” and it has already informed the Environmental Protection Agency’s (EPA) revised procedures for conducting risk evaluations for chemicals already in commerce.
Equatorial Atlantic mid-depth warming indicates Atlantic meridional overturning circulation slowdown, Ren et al., Communications Earth & Environment
Based on ocean general circulation model (OGCM) experiments, we identify the mid-depth warming of 1000–2000 m in the equatorial Atlantic as a fingerprint of AMOC slowdown under anthropogenic warming. Subsurface downwelling signals of the declined AMOC propagate along the western boundary and across the equator as baroclinic Kelvin waves within one decade. Compared to surface proxies, the mid-depth equatorial temperature is a more reliable indicator for the AMOC intensity on decadal and longer timescales. The mid-depth warming in the equatorial Atlantic is also robustly detected in historical in situ observations, indicating that the AMOC already slowed down in the late 20th century.
A Risk-Risk Assessment of Climate Extremes: Comparing Greenhouse Gas Warming and Stratospheric Aerosol Injection in UKESM1, Wells & Haywood, Earth's Future
This study investigates the potential of Stratospheric Aerosol Injection (SAI), a solar climate intervention strategy, to mitigate climate extremes driven by greenhouse gas (GHG) emissions, comparing its effects to those of GHG-induced warming under the SSP5-8.5 scenario. Using the UKESM1 climate model and the GeoMIP G6controller scenario, we examine extreme temperature, precipitation, and fire risk indices in a risk-risk framework. The multi-latitude G6controller strategy, an improvement on the equatorial injection strategy G6sulfur, reduces global mean temperature from SSP5-8.5 to SSP2-4.5, significantly reducing temperature and precipitation extremes. Results show that G6controller effectively reduces temperature extremes relative to SSP5-8.5, especially in populated areas like Europe and South America, and reduces fire risk in high-risk areas, such as South America and southern Africa. While both scenarios project broad precipitation increases, G6controller moderates these without introducing new drying relative to SSP5-8.5, particularly in Southeast Asia. This study highlights G6controller's potential to lessen the magnitude of extreme climate events, offering insights into SAI's regional efficacy and highlighting the trade-offs between GHG warming with and without solar climate intervention.
Africa’s regional and local climate response to stratospheric aerosol injection characteristics, Kumi et al., Frontiers in Climate
Using climate simulations, this study assesses the potential impact of stratospheric aerosol injection (SAI) on projected mean and extreme temperature and precipitation across the continent. We analysed data from the Stratospheric Aerosol Geoengineering Large Ensemble (GLENS) project, which simulates a set of SAI experiments under RCP8.5 emission scenarios with SO2 injection into the tropical stratosphere at 22.8–25?km altitude (GLENS) and around 1?km above the tropopause (GLENS_low) and near the equator at around 20–25?km above ground (GLENS_eq). The results show that all SAI experiments (GLENS, GLENS_eq, and GLENS_low) exhibit substantial cooling effects, with GLENS_eq emerging as the most effective in reducing temperature extremes, particularly over Central and Southern Africa. However, despite successfully offsetting much of the RCP8.5-induced warming, the effectiveness of SAI varies across regions, leaving some regions, such as the Sahel and North Africa, with residual warming. In addition to its cooling effects, SAI could significantly alter precipitation patterns, introducing widespread drying and thereby reducing flood risks across the continent. While SAI could offset the projected increase in extreme precipitation under RCP8.5, it could simultaneously exacerbate drying trends over Central, Southern, and Northern Africa. These findings highlight critical trade-offs associated with SAI deployment, particularly for regions where agriculture and water resources depend heavily on rainfall, underscoring the need for regionally optimised geoengineering strategies that balance temperature moderation with hydrological stability. This study provides the first comparative analysis of tropical, equatorial, and low-altitude SAI impacts on the climate, revealing critical trade-offs for precipitation-dependent regions. The findings presented here are, however, specific to the SAI scenarios analysed (GLENS experiments), as a different SAI deployment scenario would lead to different conclusions.
Subtraction neglect in perceptions of climate action strategies, Suter et al., Journal of Environmental Psychology
Research suggests that individuals often overlook beneficial subtractive strategies when solving problems. Subtractive strategies, which include reducing demand for goods and services (e.g., reducing car use), have a high climate mitigation potential. Yet, these may be systematically overlooked in favor of additive strategies like adopting new technologies (e.g., buying an electric car). This Registered Report investigates subtraction neglect in the context of personal climate action. When asked to think of the most effective personal climate mitigation actions, does priming people to think about additive and subtractive strategies increase the likelihood that they suggest subtractive climate actions? We investigate this research question via an online experiment conducted in the United Kingdom. Participants who received a brief prompt introducing both strategy types proposed significantly more subtractive actions than those who were not made aware of additive and subtractive strategies. The findings suggest that raising awareness of subtractive strategies can shift attention toward underused yet impactful climate actions.
From this week's government/NGO section:
Greenhouse Gas Bulletin - No. 21, World Meteorological Organization
The levels of the three most abundant long-lived greenhouse gases (LLGHGs), carbon dioxide (CO2), methane (CH4) and nitrous oxide (N2O), reached new records in 2024. From 2023 to 2024, CO2 in the global surface atmosphere increased by 3.5 ppm,(1) the largest one-year increase since modern measurements began in 1957. This increase was driven by continued fossil CO2 emissions, enhanced fire emissions and reduced terrestrial/ocean sinks in 2024, which could signal a climate feedback. Given the dominant role of increasing atmospheric CO2 in global climate change, achieving net-zero anthropogenic CO2 emissions must be the focus of climate action. Sustaining and expanding greenhouse gas monitoring is critical to supporting such efforts.
State of Climate Action 2025, Schumer et al., World Resources Institute
Published ahead of COP30, the authors translates the Paris Agreement temperature goal into actionable targets for 2030, 2035 and 2050 across the world’s highest-emitting sectors – power, buildings, industry, transport, forests and land, and food and agriculture – as well as specifies how quickly technological carbon dioxide and climate finance must scale up. The authors then assess recent progress made towards these global benchmarks, highlighting where – and by how much – efforts must accelerate this decade. The authors found that, while the 10 years following the adoption of the Paris Agreement have seen the transition to net-zero emissions take off, there’s still a long way to go. Across every single sector, climate action has failed to materialize at the pace and scale required to achieve the Paris Agreement’s temperature goal. None of the 45 indicators assessed are on track to reach their 1.5°C-aligned targets by the end of this decade.
125 articles in 54 journals by 755 contributing authors
Physical science of climate change, effects
Equatorial Atlantic mid-depth warming indicates Atlantic meridional overturning circulation slowdown, Ren et al., Communications Earth & Environment Open Access 10.1038/s43247-025-02793-1
Impact of Cold Wakes on Tropical Cyclone Rainfall under Global Warming, Chen et al., Journal of Climate 10.1175/jcli-d-25-0104.1
New Book - Climate Obstruction: A global Assessment
Posted on 22 October 2025 by BaerbelW
Climate Obstruction: A Global Assessment is a new book from Brown University’s global Climate Social Science Network, for which a team of more than 100 scholars explored who’s blocking action on climate change and how they’re doing it. John Cook - founder of Skeptical Science and senior research fellow with the Melbourne Centre for Behaviour Change at the University of Melbourne - co-authored chapter 7 in the book titled "Understanding the Political and Psychological Roots of Climate Misinformation and Its Impact on Public Opinion". The book is available open access for download from the Climate Social Science Network.
The book
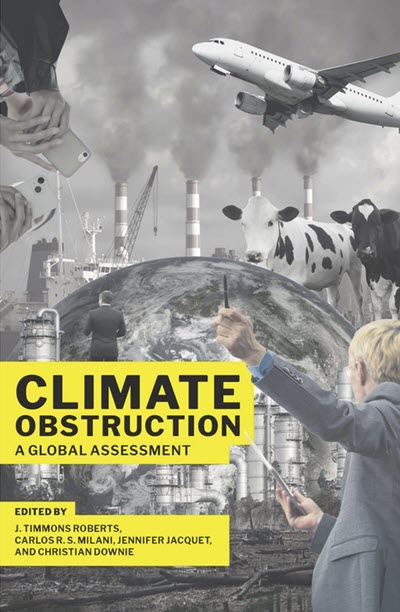
In addition to an introduction by the editors J. Timmons Roberts, Carlos R. S. Milani, Jennifer Jacquet, and Christian Downie the book contains 12 chapters exploring the many different shapes and forms climate obstruction takes around the globe:
- The Global Role of the Oil and Gas Industry in Climate Delay and Denial - Lead Authors: Geoff Dembicki, Kristoffer Ekberg, and Kert Davies / Contributing Authors: Ann-Kristin Bergquist, Ada Nissen, and Stella Levantesi
- How Coal, Utilities, and Transportation Impede Climate Action - Lead Authors: Jen Schneider and Gregory Trencher / Contributing Authors: Peter K. Bsumek, Christian Downie, Paul K. Gellert, Giulio Mattioli, Jason Monios, Peter Newell, Jennifer Peeples, Joeri Wesseling, Emily Williams, Ryan Wishart, and Ben Youriev
- The Animal Agriculture Industry’s Role in Obstructing Climate Action - Lead Authors: Kathrin Lauber and Viveca Morris / Contributing Authors: Jennifer Jacquet, Peter Li, Ina Möller, Silvia Secchi, Alex Wijeratna, and Melina De Bona
- Climate Policy Obstruction on the Right and the Far Right - Lead Authors: Dieter Plehwe and Justin Farrell / Contributing Authors: Lucas Araldi, Robert J. Brulle, Jesse Callahan Bryant, William Callison, Kert Davies, Ruth E. McKie, Sotiris Mitralexis, and Alexandru Racu
- Steering the Climate Discourse: Legacy News, Social Media, Advertising, and Public Relations - Lead Authors: Melissa Aronczyk and Maxwell Boykoff / Contributing Authors: Travis G. Coan, Myanna Lahsen, Hanna E. Morris, and Chris Russill
- Understanding the Political and Psychological Roots of Climate Misinformation and Its Impact on Public Opinion - Lead Authors: Dominik A. Stecula and John Cook / Contributing Authors: Arunima Krishna, Adrian Dominik Wójcik, Jean Carlos Hochsprung Miguel, Matthew Hornsey, and Salil Benegal
- Climate Obstruction Across the Global South - Lead Authors: M. Omar Faruque and Ruth E. McKie / Contributing Authors: Lucas G. Christel, Claire Debucquois, Guy Edwards, Paul K. Gellert, Ricardo A. Gutierrez, Kathryn Hochstetler, Yifei Li, Carlos R. S. Milani, Elisabeth Möhle, Oluwaseun J. Oguntuase, and Jonathan R. Walz
- Blocking Climate Action at Subnational Levels - Lead Authors: Rebecca Bromley-Trujillo, Joshua A. Basseches, and Marcela López-Vallejo / Contributing Authors: Lucas G. Christel, Andrew B. Kirkpatrick, Simone Lucatello, and Maria Isabel Santos Lima
- Obstruction in the United Nations Framework Convention on Climate Change and the Intergovernmental Panel on Climate Change - Lead Authors: Kari De Pryck and Eduardo Viola / Contributing Authors: Stefan C. Aykut, Larissa Basso, Danielle Falzon, Matías Franchini, Friederike Hartz, Hannah Hughes, Vinícius Mendes, Carlos R. S. Milani, Bruna Bosi Moreira, Géraldine Pflieger, and Emanuel Semedo
- Obstructing Global and Local Climate Change Adaptation - Lead Authors: Laura Kuhl and Stacy-ann Robinson / Contributing Authors: Natalie Dietrich Jones, Danielle Falzon, Andrew Malmuth, Michael Mikulewicz, Meg Mills-Novoa, Michelle Mycoo, Meg Parsons, M. Feisal Rahman, E. Lisa F. Schipper, Kimberley Anh Thomas, and Edward Walker
- Legal and State Efforts to Address Climate Obstruction - Lead Authors: Grace Nosek, Joana Setzer, and Benjamin Franta / Contributing Authors: Alyssa Johl, Lisa Benjamin, Sharon Yadin, William W. Buzbee, and Aria Kovalovich
- Confronting Climate Obstruction: The Role of Civil Society and Non–State Actors - Lead Authors: Jennie C. Stephens and Sharon Yadin / Contributing Authors: Laurence L. Delina, Louise M. Fitzgerald, Francisco Garcia-Gibson, Fergus Green, Noel Healy, David Hess, Tariro Kamuti, Cristiana Losekann, David Michaels, Sonja Solomun, and Robin Tschoetschel
50 fact briefs published in collaboration with Gigafact!
Posted on 21 October 2025 by BaerbelW
In April 2024 we announced the (renewed) collaboration between Gigafact and Skeptical Science to create fact briefs, short but credibly sourced summaries that offer “yes/no” answers in response to claims found online. Initially, we published new fact briefs on Saturdays, but switched to Tuesdays earlier this year and while we try to have a new fact brief out each week, we sometimes miss a week due to time constraints and vacations. Regardless of that, we published fact brief #50 - Are humans responsible for climate change? - on September 30, 2025 and thought that this little milestone might make for a good reason to write a short blog post about the current status of this project.

From what we can tell, these bite-sized explanations are still useful to people - at least they collect quite some likes and get shared on various social media platforms once we put up a post there. Another intriguing aspect of this collaboration with Gigafact is, that we are part of their network of news outlets and some of our fact briefs have for example been republished by Wisconsin Watch among their own fact briefs!
India’s power-sector CO2 falls for only second time in half a century
Posted on 20 October 2025 by Guest Author
This is a re-post from Carbon Brief
India’s carbon dioxide (CO2) emissions from its power sector fell by 1% year-on-year in the first half of 2025 and by 0.2% over the past 12 months, only the second drop in almost half a century.
As a result, India’s CO2 emissions from fossil fuels and cement grew at their slowest rate in the first half of the year since 2001 – excluding Covid – according to new analysis for Carbon Brief.
The analysis is the first of a regular new series covering India’s CO2 emissions, based on monthly data for fuel use, industrial production and power output, compiled from numerous official sources.
(See the regular series on China’s CO2 emissions, which began in 2019.)
Other key findings on India for the first six months of 2025 include:
- The growth in clean-energy capacity reached a record 25.1 gigawatts (GW), up 69% year-on-year from what had, itself, been a record figure.
- This new clean-energy capacity is expected to generate nearly 50 terawatt hours (TWh) of electricity per year, nearly sufficient to meet the average increase in demand overall.
- Slower economic expansion meant there was zero growth in demand for oil products, a marked fall from annual rates of 6% in 2023 and 4% in 2024.
- Government infrastructure spending helped accelerate CO2 emissions growth from steel and cement production, by 7% and 10%, respectively.
- Analysis: Record solar growth keeps China’s CO2 falling in first half of 2025
- Analysis: Clean energy just put China’s CO2 emissions into reverse for first time
- Analysis: Clean energy contributed a record 10% of China’s GDP in 2024
- Analysis: Record surge of clean energy in 2024 halts China’s CO2 rise
The analysis also shows that emissions from India’s power sector could peak before 2030, if clean-energy capacity and electricity demand grow as expected.
The future of CO2 emissions in India is a key indicator for the world, with the country – the world’s most populous – having contributed nearly two-fifths of the rise in global energy-sector emissions growth since 2019.
India’s surging emissions slow down
In 2024, India was responsible for 8% of global energy-sector CO2 emissions, despite being home to 18% of the world’s population, as its per-capita output is far below the world average.
However, emissions have been growing rapidly, as shown in the figure below.
The country contributed 31% of global energy-sector emissions growth in the decade to 2024, rising to 37% in the past five years, due to a surge in the three-year period from 2021-23.
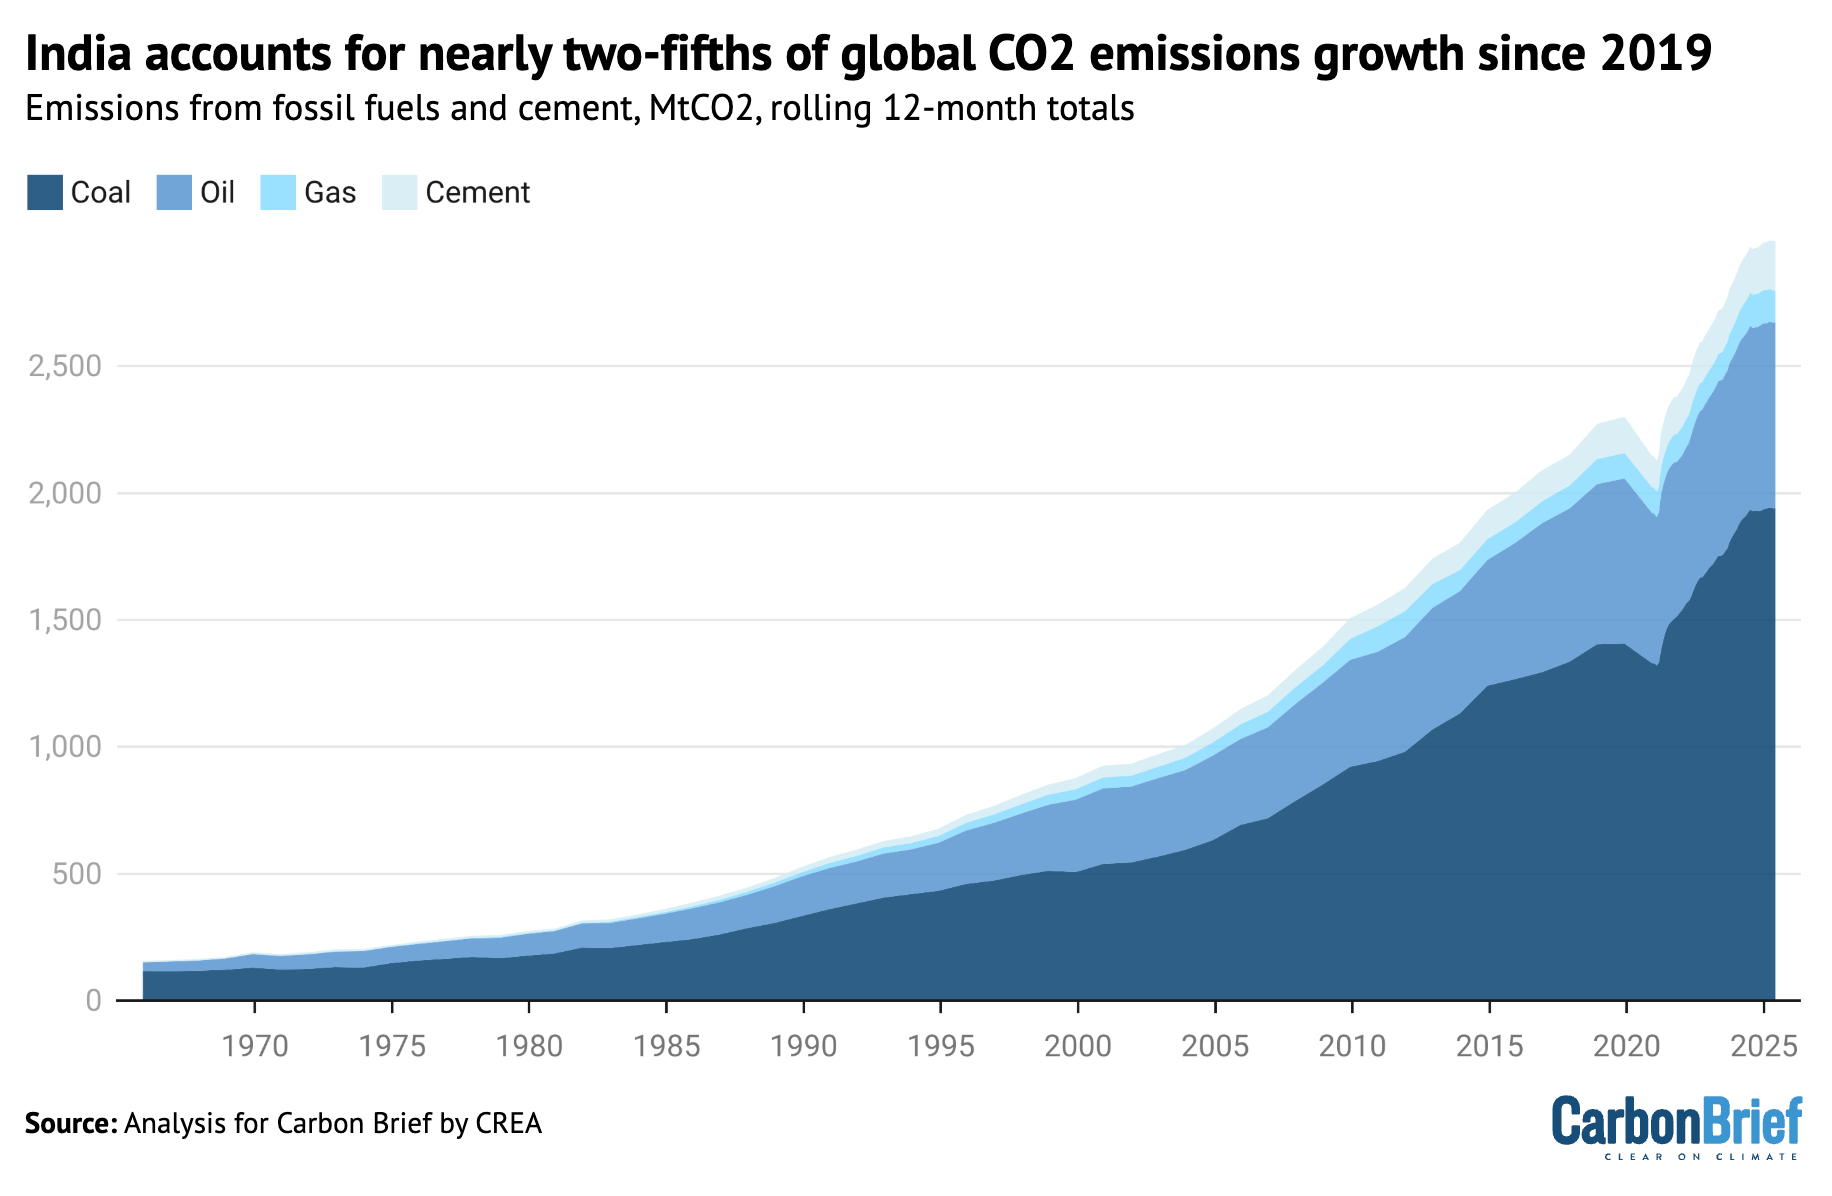 India’s CO2 emissions from fossil fuels and cement, million tonnes of CO2, rolling 12-month totals. Source: Analysis for Carbon Brief by CREA. (See: About the data.)
2025 SkS Weekly Climate Change & Global Warming News Roundup #42
Posted on 19 October 2025 by BaerbelW, Doug Bostrom
Stories we promoted this week, by category:
Climate Change Impacts (6 articles)
- Climate Change Comes for the House of the Seven Gables At the edge of Salem’s harbor, caretakers face a race against rising seas and intensifying storms to protect a landmark bound up in America’s literary and colonial past. Inside Climate News, Ryan Krugman, Oct 12, 2025.
- Net-zero is a pipe dream: civilisation now faces an existential threat Crops now grown will no longer survive, water shortages will become widespread, and food will be scarce. Are we ready for widespread environmental refugees? Newsroom NZ, Kevin Trenberth, Oct 13, 2025.
- Climate tipping points sound scary, especially for ice sheets and oceans-why there's still room for optimism The Conversation, Alexandra A Phillips , Oct 13, 2025.
- As coral reefs pass tipping point, ocean protection rises up political agenda New scientific studies show coral reefs are under severe pressure from global warming, while ocean acidification poses a threat to marine life Climate Home News, Mariel Lozada, Oct 13, 2025.
- Antarctica is starting to look a lot like Greenland-and that isn`t good Global warming is awakening sleeping giants of ice at the South Pole as glaciers start to flow faster and surface melting increases. Inside Climate News, Bob Berwyn, Oct 16, 2025.
- World Meteorological Report Marks Biggest Annual Jump in CO2 Levels Surging emissions from wildfires may have been behind the increase, which was the largest since modern measurements began more than half a century ago. New York Times, Raymond Zhong and Sachi Kitajima Mulkey, Oct 16, 2025.
Climate Law and Justice (5 articles)
- `It`s a road to destruction`: climate defenders facing surge in reprisals, says UN expert Mary Lawlor, UN special rapporteur for human rights defenders, accuses US, UK and other governments of paying lip service to climate goals while criminalizing activists The Guardian, Nina Lakhani, Oct 13, 2025.
- Judge dismisses suit by young climate activists against Trump`s pro-fossil fuel policies Plaintiffs had ‘overwhelming evidence’ of climate crisis but a court injunction would be ‘unworkable’, ruling says The Guardian, Maya Yang, Oct 15, 2025.
- Montana Court Dismisses Youth-led Lawsuit Challenging Trump Executive Orders Boosting Fossil Fuels The judge in Lighthiser v. Trump described climate change as a “children’s health emergency,” but found that the young plaintiffs lacked standing and the court did not have the authority to grant the relief they requested. Inside Climate News, Dana Drugmand, Oct 16, 2025.
- Governmental Climate Duties in Comparative Perspective: Civil, Common, and European Legal Traditions Climate Law Blog, Myrto Leivadarou, Oct 17, 2025.
- The Kids Who Sued Trump Just Lost Big in Court. Or Did They? A federal judge threw out their climate lawsuit against the president a few days ago. But legal experts say there was a silver lining in the judge’s opinion. New York Times, Karen Zraick, Oct 18, 2025.


