


Latest Posts
Archives
|
 |
Explaining climate change science & rebutting global warming misinformation
Global warming is real and human-caused. It is leading to large-scale climate change. Under the guise of climate "skepticism", the public is bombarded with misinformation that casts doubt on the reality of human-caused global warming. This website gets skeptical about global warming "skepticism".
Our mission is simple: debunk climate misinformation by presenting peer-reviewed science and explaining the techniques of science denial, discourses of climate delay, and climate solutions denial.
Posted on 10 July 2025 by Doug Bostrom, Marc Kodack
Open access notables
Americans and policymakers underestimate endorsement for the most popular climate solution narrative, combining personal and political action, Sparkman et al., Communications Earth & Environment
A wide variety of existing narratives describe how we might address climate change. Which of these approaches is popular among the American public? Do the general public and their elected officials accurately perceive which climate solutions are popular? We assess personal endorsement and perceptions of public support in national representative samples of the U.S. public (N = 1500) and local-level U.S. policymakers (N = 500). Proactive narratives, like ones advocating for both personal behavior and policy action, are widely endorsed, but both the public and policymakers greatly underestimate their popularity (a case of pluralistic ignorance), especially for narratives calling for systemic change. Greater endorsement of these narratives corresponded to greater willingness to take personal and political actions and support climate policy. We also find experimental exposure to some climate narratives (N = 2060) may increase participants’ behavioral intentions and policy support, suggesting which narratives are spread in popular media is important to help address climate change.
The work was supported by a National Science Foundation grant, SES-DRMS 2018063 to E.U.W.
The carbon perception gap in actual and ideal carbon footprints across wealth groups, Köchling et al., Nature Communications
Carbon inequality is gaining attention in public discussions surrounding equitable climate policies. It commonly refers to the unequal distribution of individual greenhouse gas emissions, with wealthier individuals contributing disproportionately higher emissions. Little is known about how people perceive the actual carbon footprint distribution across wealth groups and what they would desire as an ideal distribution. Survey data from Germany show awareness of carbon inequality, with respondents recognizing that wealthier individuals emit disproportionately more. Yet, with surprising consensus, all groups, including the wealthy, desired an inverse ideal distribution, with the wealthy having disproportionately smaller carbon footprints. Nonetheless, most perceived their own carbon footprint as far better compared to others in society and within their wealth group. Here, we show a carbon perception gap, particularly among the wealthiest: Collectively, people acknowledge the presence of carbon inequality and desire a more equitable distribution, yet often perceive themselves as already contributing more than others.
Permafrost Thaw Impact on Remaining Carbon Budgets and Emissions Pathways in 2°C and 3°C Global Warming Scenarios, Georgievski et al., Earth's Future
This study focuses on the impact of thawing frozen ground of high northern latitudes, known as permafrost, which contains large amount of soil organic carbon (SOC). As temperatures rise due to climate change, this SOC can be decomposed and released as greenhouse gases (GHG) into atmosphere reinforcing warming. We use climate model experiments with and without permafrost, adapting fossil fuel emissions to simulate different scenarios aimed at limiting GHG concentrations to stabilize global warming to 2°C and 3°C above preindustrial levels. Climate model simulations show that thawing permafrost could release significant amounts of GHG with temporary peaks of about half of present-day annual fossil fuel emissions (∼5 PgC), but at an average rate of less than 0.7 PgC/yr for 3°C, and ∼0.3 PgC/yr for 2°C warming. Thus, by the end of the simulations set for the year 2298, the release of permafrost carbon reduces the amount of carbon available for fossil fuel emissions by ∼13% for 2°C warming level, and by ∼11% for 3°C warming level. These results show how important it is to consider permafrost thaw when acting to reduce emissions.
Rapid increases in satellite-observed ice sheet surface meltwater production, Zheng et al., Nature Climate Change
Surface meltwater production influences the contribution of ice sheets to global sea-level change. Ice-sheet-wide meltwater production has thus far primarily been quantified by regional climate models. Here we present a 31-year (1992–2023) time series of daily satellite-observed surface melt flux for the Greenland and Antarctic ice sheets. The annual meltwater volume in Greenland has significantly increased, with intensified melt in the northern basins dominated by a negative North Atlantic Oscillation and elevated melt flux in western basins driven by the decline in Arctic sea-ice. In East Antarctica, high melt rates since 2000 are attributed to warm air incursions from the Southern Ocean due to anomalous atmospheric circulations associated with a negative Southern Annular Mode and the recovery of the Antarctic ozone hole. This region, previously less prone to surface melt, has become a melt hotspot, potentially leading to meltwater ponding and future ice shelf destabilization.
Rising surface salinity and declining sea ice: A new Southern Ocean state revealed by satellites, Silvano et al., Proceedings of the National Academy of Sciences
For decades, the surface of the polar Southern Ocean (south of 50°S) has been freshening—an expected response to a warming climate. This freshening enhanced upper-ocean stratification, reducing the upward transport of subsurface heat and possibly contributing to sea ice expansion. It also limited the formation of open-ocean polynyas. Using satellite observations, we reveal a marked increase in surface salinity across the circumpolar Southern Ocean since 2015. This shift has weakened upper-ocean stratification, coinciding with a dramatic decline in Antarctic sea ice coverage. Additionally, rising salinity facilitated the reemergence of the Maud Rise polynya in the Weddell Sea, a phenomenon last observed in the mid-1970s. Crucially, we demonstrate that satellites can now monitor these changes in real time, providing essential evidence of the Southern Ocean’s potential transition toward persistently reduced sea ice coverage.
From this week's government/NGO section:
Climate Change in the American Mind: Beliefs & Attitudes, Spring 2025, Leiserowitz et al., Yale University and George Mason University
Americans who think global warming is happening outnumber those who think it is not by a ratio of more than 4 to 1 (69% versus 15%). Compared with Fall 2024, Americans’ level of worry is significantly higher for wildfires (+12 percentage points), rising sea levels (+13 points), and hurricanes (+8 points). Additionally, half or more Americans are at least “a little worried” their local area might be harmed by air pollution (78%), water pollution (77%), diseases carried by mosquitoes and ticks (76%), extreme heat (73%), droughts (73%), agricultural pests and diseases (71%), electricity power outages (71%), wildfires (67%), water shortages (67%), flooding (61%), tornados (60%), rising sea levels (55%), hurricanes (50%), and reduced snowpack (49%). Nearly two-thirds of Americans think that global warming is affecting the weather in the U.S. (64%), and seven in ten or more think it is affecting extreme heat (75%), wildfires (72%), droughts (72%), and flooding (71%). Only 18% of Americans say they hear about global warming in the media “at least once a week,” which is the lowest percentage since the question was added to the survey in 2015.
Google’s Eco-failures. An Environmental Investigation into Alphabet Inc. 2025, Kairos Fellowship
Google’s reported total greenhouse gas emissions increased 1,515% from 2010 to 2024 according to the company’s own published data. While Google reports a decrease in its data center emissions, it is doing so by only reporting “market based emissions,” which use renewable energy purchased elsewhere to obscure real emissions. Google’s only emissions that have shown an absolute decrease since 2019 are its scope 1 emissions, which merely account for 0.31% of Google’s reported total emissions. Google’s aggressive investment in Generative AI and its infrastructure is a major factor behind its climate failings. Google’s Scope 2 emissions, which measure the emissions from energy that Google purchases to power its data centers, have increased by 820% since 2010.
118 articles in 58 journals by 625 contributing authors
Physical science of climate change, effects
Dynamical Systems Methods to Understand Projected Heatwave Intensification, Vakrat & Kushner Kushner, Weather and Climate Extremes Open Access 10.1016/j.wace.2025.100791
Heat Storage Pattern Linked to the Atlantic Meridional Overturning Circulation Slowdown, Ren et al., Geophysical Research Letters Open Access 10.1029/2025gl116801
Observations of climate change, effects
Divergent oxygen trends in ice-covered lakes driven by ice-cover decline and ecological memory, Jansen et al., Proceedings of the National Academy of Sciences Open Access 10.1073/pnas.2426140122
Read more...
0 comments
Posted on 9 July 2025 by dana1981
This is a re-post from Yale Climate Connections
On the Fourth of July – America’s 249th birthday – President Donald Trump signed into law a bill that could very well cede the country’s position as the leading global economic superpower to China.
As the nonpartisan energy think tank RMI has argued, the world is in the midst of a transition from the Information Age, which the United States led by dominating the development of new software and information technologies, to the Renewable Age, in which the development and deployment of electric and renewable energy technologies will drive the global economy.
This transition is dominated by insurgent clean technologies, such as solar, wind, electric vehicles, and batteries, whose prices are falling rapidly and whose growth is exponential.
 Transitions to new global economic ages and the countries that led and are poised to lead them. (Image credit: RMI / used with permission) Transitions to new global economic ages and the countries that led and are poised to lead them. (Image credit: RMI / used with permission)
Chinese manufacturers have invested heavily in those technologies. To help the U.S. economy better compete in the clean tech sector, Democrats passed the Inflation Reduction Act, or IRA, in August 2022. That law included incentives to spur domestic manufacturing of these key clean energy technologies.
And it was working.
The U.S. experienced a clean energy manufacturing boom over the ensuing two years. But Republicans’ new budget reconciliation law, called the “One, Big Beautiful Bill Act,” guts those incentives and pulls the rug out from under nascent domestic clean energy industries.
On America’s birthday, President Donald Trump could not have given the Chinese economy a more generous gift.
Read more...
0 comments
Posted on 8 July 2025 by Sue Bin Park
 Skeptical Science is partnering with Gigafact to produce fact briefs — bite-sized fact checks of trending claims. You can submit claims you think need checking via the tipline. Skeptical Science is partnering with Gigafact to produce fact briefs — bite-sized fact checks of trending claims. You can submit claims you think need checking via the tipline.
Is global warming just due to El Niño?
 El Niño Southern Oscillation is a short-term and cyclical weather phenomenon caused by alternating wind patterns that result in heat exchange between the ocean and the atmosphere; it cannot explain long-term warming. El Niño Southern Oscillation is a short-term and cyclical weather phenomenon caused by alternating wind patterns that result in heat exchange between the ocean and the atmosphere; it cannot explain long-term warming.
El Niño originates when westward moving trade winds weaken, allowing warm surface waters to shift east across the tropical Pacific. This reverses the La Niña pattern, where trade winds push warm surface water toward Asia, upwelling cold water off the coast of South America.
During El Niño, heat is transferred from the ocean to the atmosphere, causing warming, while La Niña occurs when heat moves from the atmosphere to the ocean, causing cooling. Energy is moved around the climate system without adding any heat.
In contrast, climate science research indicates human-caused CO2 is the primary driver of today’s warming. Human activities that increase greenhouse concentrations in the atmosphere cause less heat to escape the atmosphere, resulting in additional and non-cyclical warming.
Go to full rebuttal on Skeptical Science or to the fact brief on Gigafact
This fact brief is responsive to quotes such as this one.
Sources
NOAA What is the El Niño–Southern Oscillation (ENSO) in a nutshell?
NOAA Can We Blame El Niño?
Journal of Geophysical Research Comment on “Influence of the Southern Oscillation on tropospheric temperature” by J. D. McLean, C. R. de Freitas, and R. M. Carter
Read more...
0 comments
Posted on 7 July 2025 by Zeke Hausfather
This is a re-post from the Climate Brink
The publication of an article titled “The World Is Warming Up. And It’s Happening Faster” by the New York Times kicked off a pretty heated debate among climate scientists over the evidence of acceleration and how strong a claim can be made based on the evidence today.
The NYT included the illustrative figure below, which draws simple ordinary least squares trends over three time periods: 1880-1970, 1970-2010, and 2010-present (May 2025). It appears to show a notable acceleration over the past 15 years compared to the rate of warming that characterized the post-1970 “modern warm period” when climate change began to notably take off alongside human emissions of CO2 and other greenhouse gases.

However, 15 years is a relatively short period of time; while the timeseries currently ends just after a weak La Nina event, there are concerns that the strong El Nino of 2023/2024 could bias the trend upward. More broadly, there is a lingering spectre of the hiatus haunting these discussions, when the climate science community arguably over-indexed on short term variability to make too much of an apparent slowdown in global warming between 1998 and 2012.
So, is there real evidence of an acceleration, or are we failing to learn from the past and overhyping short-term variability?
As I discuss below, it is my view that this is structurally different from the debate during the hiatus years; not because the evidence is much stronger in the surface temperature record alone (though arguably it is), but because so many other lines of evidence – climate models, ocean heat content, and changes in earth energy imbalance – also suggest an acceleration.
Read more...
0 comments
Posted on 6 July 2025 by BaerbelW, Doug Bostrom
A listing of 27 news and opinion articles we found interesting and shared on social media during the past week: Sun, June 29, 2025 thru Sat, July 5, 2025.
Stories we promoted this week, by category:
Climate Change Impacts (4 articles)
- What does climate change mean for agriculture? Less food, and more emissions New research sheds light on how rising temperatures are squeezing farmers and raising prices for consumers. Grist, Frida Garza, Jun 30, 2025.
- How unusual is this UK heat and is climate change to blame? A second spell of UK temperatures well over 30C before the end of June - how unusual is this and how much is climate change to blame? BBC News, Mark Poynting, Jun 30, 2025.
- Climate change has doubled the world's heat waves: How Africa is affected The Conversation, Joyce Kimutai, Jul 02, 2025.
- We didn’t know East Antarctica was melting like this Dr Gilbz on Youtube, Ella Gilbert, July 4, 2025.
Climate Education and Communication (4 articles)
- Stampede in Soho: puppet animals on an epic trek bring wonder and warning to London streets Public art project The Herds is passing through capital on 20,000km journey from Congo Basin to Arctic Circle, inspiring climate action The Guardian, Chris Wiegand, Jun 28, 2025.
- Schools failing in climate education A survey reveals a disconnect between what Canadian parents and kids want to know about climate change vs. how the need is addressed in schools. Brandon Sun, Karen S. Acton, Jun 30, 2025.
- An Important Archive of Congressionally-Mandated Climate Change Reports Just Went Dark Climate scientists are alarmed by the Trump administration’s latest attack on climate change research. Inside Climate News, Lauren Dalban, Jul 01, 2025.
- Key climate change reports removed from US government websites The national climate assessments help state and local governments prepare for the impacts of a warming world. The Guardian, Associated Press, Jul 01, 2025.
Climate Policy and Politics (4 articles)
- Who`s the Fossil Fuel-Backed "Philosopher" Shaping Trump`s Megabill Clean Energy Cuts? Is a bachelor's degree in philosophy sufficent to become an energy policy expert? Desmog explores this question. DeSmog, Sharon Kelly, Jul 01, 2025.
- Trump administration shuts down U.S. website on climate change The U.S. Global Change Research Program’s website, globalchange.gov, was taken down along with information on how global warming is affecting the country. Los Angeles Times, Ian James, Noah Haggerty, Jul 01, 2025.
- Trump uprooted a major climate effort. Scientists are fighting back. The future of the National Climate Assessment is uncertain, so researchers are looking to write an alternative version that could serve as a substitute. E&E News, Chelsea Harvey, Jul 02, 2025.
- Trump`s climate research cuts are unpopular, even with Republicans Recent polling shows that nearly 80% of registered U.S. voters want government agencies to keep researching and sharing global warming data. The administration is dismantling both. Yale Climate Connections, Karin Kirk, Jul 03, 2025.
Read more...
0 comments
Posted on 3 July 2025 by Doug Bostrom, Marc Kodack
Open access notables
The Emergence of Near-Permanent Marine Heatwave State in the Tropical Indian Ocean During 2023–2024, Soumya, International Journal of Climatology
In 2023/24, global mean surface temperatures exceeded 1.5°C above pre-industrial levels, and the Tropical Indian Ocean (TIO) experienced a record-breaking basin mean anomalous warming of 0.88°C. This unprecedented warming in the TIO is linked to the severe and long-lasting marine heatwave (MHW) events ever recorded in the region, reconciling with the ongoing long-term warming and internal climate variabilities. The MHW events of 2023/24 were primarily centred in the Arabian Sea (AS) and southwestern TIO regions, with mean intensities of 0.73°C and 0.89°C, respectively. The prolonged MHW event developed in the AS region in August 2023 and in the southwestern TIO in July 2023 due to increased oceanic heat gain associated with increased insolation and reduced latent heat loss. The MHW event in the AS was sustained throughout the remainder of the year and the following year by subsurface warming due to the convergence of surface winds in the AS and suppressed cooling by vertical processes. In the southwestern TIO, the event intensified and lasted till December 2024, driven by thermocline warming induced by downwelling Rossby waves, triggered by intensified easterlies associated with an anomalously westward extended cold tongue in the equatorial Indian Ocean, linked to the co-occurrence of strong El Niño and extreme equatorial positive Indian Ocean Dipole (PIOD) events. The extreme warming of the TIO during 2023/24 underscores the ongoing impact of climate change on global ocean surface warming.
Glaciers in Western Canada-Conterminous US and Switzerland Experience Unprecedented Mass Loss Over the Last Four Years (2021–2024), Menounos et al., Geophysical Research Letters
Over the period 2021–2024, glaciers in Western Canada and the conterminous US (WCAN-US), and Switzerland respectively lost mass at rates of 22.2 ± 9.0 and 1.5 ± 0.3 Gt yr−1 representing a twofold increase in mass loss compared to the period 2010–2020. Since 2020, total ice volume was depleted by 12% (WCAN-US) and 13% (Switzerland). Meteorological conditions that favored high rates of mass loss included low winter snow accumulation, early-season heat waves, and prolonged warm, dry conditions. High transient snow lines, and impurity loading due to wildfires (WCAN-US) or Saharan dust (Switzerland) darkened glaciers and thereby increased mass loss via greater absorbed shortwave radiation available for melt. This ice-albedo feedback will lead to continued high rates of thinning unless recently exposed dark ice and firn at high elevations is buried by seasonal snowfall. Physical models that simulate impurity deposition and movement through firn and ice are needed to improve future projections of glacier mass change.
Early warning signs of salt marsh drowning indicated by widespread vulnerability from declining belowground plant biomass, Runion et al., Proceedings of the National Academy of Sciences
Intensifying stressors are weakening resilience in ecosystems across the globe. Here, we show that belowground biomass (BGB), a proxy for salt marsh health, has decreased over a large area of coastal marshes since 2014, indicating growing vulnerability to sea-level rise (SLR)-induced drowning. Using observational modeling, we show a shift in plant biomass allocation, away from belowground resources, which are critical for resilience, toward higher aboveground stocks. Marsh drowning is likely underway, and the window for action may be short lived.
From this week's government/NGO section:
Air and greenhouse gas pollution from private jets, 2023, Daneil Sitompul and Dan Rutherford, International Council on Clean Transportation
While there are several high-fidelity emission inventories for commercial aviation, data on greenhouse gas (GHG) and air pollution from general aviation aircraft, notably private jets activity, remain limited. The authors fill this gap by estimating how much, and where, air and GHG pollution was emitted globally by private jets in 2023. The authors used both a top-down and bottom-up emissions inventory for private jet flights using a variety of data sources, including global flight trajectories, airport coordinates, and engine emission databases.
NDCs as levers for prosperity, health and resilience, Denton et al, Climate Crisis Advisory Group
Current Nationally Determined Contributions (NDCs) are not meeting the urgency or scale of the climate crisis. On the present course, they leave the world heading towards 3°C of warming – well beyond the 1.5°C target set in the Paris Agreement. This report positions NDCs as strategic national tools to drive inclusive growth, resilience, and public well-being. The authors present 10 transformative recommendations to help countries embed climate ambition into national development strategies. These are grouped under four themes: driving prosperity and stability, building healthy and resilient communities, ensuring effective and equitable implementation, and accelerating action and ambition. Collectively, they show how NDCs can become levers for green investment, job creation, and systemic reform – offering a pathway from climate risk to shared, sustainable prosperity. Governments must use the NDC cycle as an opportunity not only to ratchet ambition, but to make climate action a cornerstone of economic and social policy.
130 articles in 56 journals by 891 contributing authors
Physical science of climate change, effects
A Wavier Polar Jet Stream Contributed to the Mid-20th Century Winter Warming Hole in the United States, Chalif et al., AGU Advances Open Access 10.1029/2024av001399
A Weakened AMOC Could Cause Southern Ocean Temperature and Sea-Ice Change on Multidecadal Timescales, Diamond et al., Journal of Geophysical Research: Oceans Open Access 10.1029/2024jc022027
Characteristics and mechanisms of summer long-lived heatwaves in Western North America: Perspective from Rossby wave train, Qiang et al., Atmospheric Research 10.1016/j.atmosres.2025.108208
Read more...
0 comments
Posted on 2 July 2025 by Guest Author
This is a re-post from Yale Climate Connections by Samantha Harrington
Republicans in the U.S. Senate are working to pass their version of the budget reconciliation bill before Congress goes on holiday for July 4. As it stands, the bill would terminate most clean energy tax credits long before their original phase-out date in 2032.
The tax credits, which include money back on electric cars, electric appliances, energy efficiency improvements, and more, have a lot of public support. In a December 2024 survey, researchers at the Yale Program on Climate Change Communication, the publisher of this site, found that 91% of liberal Democrats, 70% of moderate or conservative Democrats, 42% of liberal or moderate Republicans, and 28% of conservative Republicans support tax rebates for electric vehicles. A Yale Climate Connections analysis found that red states stood to benefit the most from the law’s incentives to individuals and businesses.
Some hoped that the Senate would save tax credits that the Republican-controlled House of Representatives proposed cutting in their version of the budget bill that passed in May, but that has not been the case for consumer tax credits for EVs or home improvements. That said, senators have not yet voted on the bill, and because the Senate made substantial changes, the bill will need to return to the House before heading to President Donald Trump’s desk for his signature. So there is still time for constituents to let members of Congress know their thoughts about the proposed legislation.
If the Senate version of the bill does become law as-is, the credits won’t expire immediately. For the most part, consumers will have 180 days to take advantage of the credits before they’re fully terminated.
Read more...
0 comments
Posted on 1 July 2025 by Sue Bin Park
Skeptical Science is partnering with Gigafact to produce fact briefs — bite-sized fact checks of trending claims. You can submit claims you think need checking via the tipline.
Are human CO2 emissions driving current global warming?
 While many natural factors influence Earth’s climate, human emissions of heat-trapping carbon dioxide are driving today’s global warming. While many natural factors influence Earth’s climate, human emissions of heat-trapping carbon dioxide are driving today’s global warming.
Scientists have conducted detailed studies of climate “forcings,” or the factors impacting global temperatures, especially with the past 50 years of satellite data. Long-term natural forcings, such as changes in Earth’s orbit or tectonic movement, take tens of thousands of years. They cannot explain the pace of recent warming.
More immediate, smaller-impact changes occur in shorter-term cycles and cancel out over time. Solar cycles and weather patterns such as El Nino and El Nina manifest as irregular oscillations in temperature graphs.
In contrast, human CO2 emissions have increased by 50% in less than 200 years, from 290 ppm to 430 ppm. Today’s global temperatures are 1.5°C (2.6°F) warmer than the pre-industrial average. The long-term upward trend in today’s temperatures can only be explained by the concurrent human-caused rise in atmospheric CO2.
Go to full rebuttal on Skeptical Science or to the fact brief on Gigafact
This fact brief is responsive to quotes such as this one.
Sources
NASA Carbon Dioxide
NASA Global Temperature
NASA Is current warming natural?
EPA Causes of Climate Change
U.S. Global Change Research Program FOURTH NATIONAL CLIMATE ASSESSMENT
Read more...
0 comments
Posted on 30 June 2025 by Zeke Hausfather
This is a re-post from the Climate Brink
The WMO recently published their WMO Global Annual to Decadal Climate Update that covers the period from 2025 to 2029. This is a regular assessment of near-term dynamic model projections that assess both the forced climate response and short-term natural variability (e.g. ENSO and AMV).
This new update forecasts relatively high global temperatures to likely continue through 2029, with the central estimate form most years similar to what was seen in 2023 and 2024. The figure below shows the 2025-2029 forecast in blue, as well as a “hindcast” of past model performance (green) compared to observations (black).
Despite the central estimate being high, large uncertainties remain; it is hard for these near-term climate projections to firmly rule out temperatures either as low as what was experienced in 2020, or temperatures considerably higher than 2023 and 2024.
If we use the central estimates from the report, however, they would likely imply a crossing date for 1.5C (using the IPCC’s 20-year centered mean approach) that would be earlier than previously expected.
Read more...
0 comments
Posted on 29 June 2025 by BaerbelW, Doug Bostrom
A listing of 28 news and opinion articles we found interesting and shared on social media during the past week: Sun, June 22, 2025 thru Sat, June 28, 2025.
Stories we promoted this week, by category:
Climate Change Impacts (10 articles)
- Heatwave in England to bring temperatures above 32°C (89.6°F) – study finds climate change made this 100 times more likely Science Feedback, Editor: Darrik Burns, June 20, 2025.
- Wildfires: climate change cause and effect Canadians think about a recent object lesson on climate change. Winnipeg Free Press, David McLaughlin, Jun 21, 2025.
- It's hot. Fossil fuels made it hotter. And it'll still be the coldest summer of your life if Trump's "Big, Beautiful Bill" passes this week. HEATED, Emily Atkin, Jun 23, 2025.
- Most tree species face serious climate threat even under modest warming, study reveals Phys.org - latest science and technology news stories, Spanish National Research Council, Jun 24, 2025.
- Global Climate Risk Index Ranks 188 Countries by Vulnerability and Access to Finance State of the Planet, Columbia Climate School, Jun 25, 2025.
- Can Mongolia`s oldest traditions survive a changing climate? Conservation International is helping herders restore the Mongolian steppe. Climate Change, Will McCarry, Jun 25, 2025.
- Unprecedented June heat along the Northeast urban corridor, brought to you by climate change Cities from Philly to Boston break the 100-degree mark, in some cases way ahead of schedule. Yale Climate Connections, Bob Henson, Jun 25, 2025.
- Global Warming Is Speeding Up and the World Is Feeling the Effects New York Times, Sachi Kitajima Mulkey, Claire Brown and Mira Rojanasakul, Jun 26, 2025.
- `It looks more likely with each day we burn fossil fuels`: polar scientist on Antarctic tipping points Despite working on polar science for the British Antarctic Survey for 20 years, Louise Sime finds the magnitude of potential sea-level rise hard to comprehend The Guardian, Jonathan Watts, Jun 27, 2025.
- A Special `Climate` Visa? People in Tuvalu Are Applying Fast. Nearly half the citizens of the tiny Pacific Island nation have already applied in a lottery for Australian visas amid an existential threat from global warming and sea-level rise. NYT > Science, Max Bearak, Jun 28, 2025.
Read more...
0 comments
Posted on 26 June 2025 by Doug Bostrom, Marc Kodack
Open access notables
Increased sea-level contribution from northwestern Greenland for models that reproduce observations, Badgeley et al., Proceedings of the National Academy of Sciences
The Greenland Ice Sheet has been thinning over the past several decades and is expected to contribute significantly to sea-level rise over the coming century. Ice flow models that make these projections, however, tend to underestimate the amount of mass lost from the ice sheet compared to observations, which complicates adaptation and mitigation planning in coastal regions. Here, we constrain a model of northwestern Greenland with a time series of satellite-derived surface velocity data and time-dependent physics to infer unknown ice properties. The model reproduces observed mass loss over the past 13 y within uncertainty. This model—constrained by more data—leads to about 8 to 17% greater sea-level rise contribution from this region by 2100.
Evidence of Emerging Increasing Trends in Observed Subdaily Heavy Precipitation Frequency in the United States, Mascaro et al., Geophysical Research Letters
The magnitude and frequency of heavy precipitation are expected to increase under warming temperatures caused by climate change. These trends have emerged in observational records but with much larger evidence on a daily rather than a subdaily scale. Here, we quantify long-term changes in heavy precipitation frequency in the United States using hourly observations in 1949–2020 from 332 gauges. We demonstrate that, when analyzed collectively, the frequencies of heavy precipitation at multiple durations from hourly to daily exhibit an increase that cannot be explained by natural climate variability. Upward trends are significant at ∼20%–40% of the gauges throughout the country except for the coastal western and southeastern regions, with higher percentages for longer durations. We also show that the frequency of hourly heavy precipitation has mainly grown after ∼2000, thus explaining the limited evidence of trends at the subdaily scale reported in past studies.
Giuseppe Mascaro thanks funding from the U.S. National Science Foundation (NSF) awards #2212702: “CAS-Climate: A Novel Process-Driven Method for Flood Frequency Analysis Based on Mixed Distributions” and #2221803: “Collaborative Research: CAS—Climate: Improving Nonstationary Intensity-Duration-Frequency Analysis of Extreme Precipitation by Advancing Knowledge on the Generating Mechanisms.”
Battery electric vehicles show the lowest carbon footprints among passenger cars across 1.5–3.0 °C energy decarbonisation pathways, Šimaitis et al., Communications Earth & Environment
Passenger car carbon footprints are highly sensitive to future energy systems, a factor often overlooked in life cycle assessment. We use a time-dependent prospective life cycle assessment to enhance carbon footprints under four 1.5–3.0 °C decarbonisation pathways for electricity, fuel, and hydrogen from an energy-based integrated assessment model. Across 5000 comparative cases, battery electric vehicles consistently have the lowest carbon footprints compared to hybrid, plug-in hybrid, and fuel-cell vehicles. For example, battery electric vehicles show an average 32 to 47% lower footprint than hybrid combustion in 3.0 °C and 1.5 °C climate-compatible futures, respectively. This is driven by greater projected decarbonisation of electricity compared to fossil-dominated fuels and hydrogen. Battery electric vehicles meaningfully retain their advantage for mileages over 100,000 km, even in regions with carbon-intensive electricity since these are anticipated to decarbonise the most. Although our study supports battery electric vehicles as the most reliable climate-mitigation option for passenger cars, reducing their high manufacturing footprint remains important.
Can dissent be meaningfully measured in an overwhelming consensus? A citation network case study in climate change research, Grunert, PLOS Clim ate
In scientific discourse, the prevalence of overwhelming consensus obscures the presence of dissenting views as well as their characteristics. This paper explores the potential to meaningfully measure dissent within the context of such a consensus, using climate change research as a case study. Using citation analysis to explore the dynamics of scientific publications and the reception of dissenting opinions, this project questions whether there may be a methodological framework for quantifying dissent. This study employs analysis of citation networks to assess the visibility and impact of minority viewpoints, as well as the viability of such a study. The findings indicate that because dissent in climate change research is miniscule such measurements are limited. Despite that finding, researchers on the fringe of scientific consensus have an outsized impact on social viewpoints. This project has potential to disrupt the ways researchers critically consider the relevance of dissenting research in their own fields, and to think of ways to embrace the impact of research that expands their fields.
In the face of anti-science politics, silence is not without cost, Editors, Nature
We recognize that not all scientific leaders are in a position to be able to speak out, particularly those in countries where doing so could incur a penalty — or even punishment. That is why our call is to international scientific organizations. Academies in countries where the freedom to dissent is protected should also make their concerns known. All need to be aware that silence is also not without cost.
From this week's government/NGO section:
Information Integrity about Climate Science: A Systematic Review, Elbeyi et al., International Panel on the Information Environment
The human response to the climate crisis is being obstructed and delayed by the production and circulation of misleading information about the nature of climate change and the available solutions. The authors found that powerful actors—including corporations, governments, and political parties—intentionally spread inaccurate or misleading narratives about anthropogenic climate change. These narratives circulate across digital, broadcast, and interpersonal communication channels. The result is a decline in public trust, diminished policy coordination, and a feedback loop between scientific denialism and political inaction.
Bright side of the mine. Solar’s opportunity to reclaim coal’s footprint, Cheng Cheng Wu and Ryan Driskell-Tate, Global Energy Monitor
The authors conducted a worldwide survey of surface coal mines closed in the last five years (since 2020) and those forecasted to close over the next five (by the end of 2030). The first-time analysis shows that over 300 surface coal mines recently out of commission could house around 103 GW of photovoltaic (PV) solar capacity, and upcoming closures of large operations could host an additional 185 GW of solar across 127 sites (see Methodology). These abandoned coal mines are predisposed to renewables siting with grid-adjacent and even pre-cleared acreage. If these potential solar projects came to fruition, the world could build almost 300 GW of solar capacity on mined out lands by the end of 2030. Uptake on that scale is equal to 15% of the solar that has already been built globally and would add enough solar capacity to inch the world one step closer to tripling renewables before the end of the decade.
138 articles in 56 journals by 793 contributing authors
Physical science of climate change, effects
Combined emergent constraints on future extreme precipitation changes, Shiogama et al., Nature Communications Open Access 10.1038/s41467-025-60385-1
Observations of climate change, effects
Climate-induced losses of surface water and total water storage in Northeast Asia, Zhang et al., Communications Earth & Environment Open Access 10.1038/s43247-025-02449-0
Evidence of Emerging Increasing Trends in Observed Subdaily Heavy Precipitation Frequency in the United States, Mascaro et al., Geophysical Research Letters Open Access 10.1029/2024gl114292
Read more...
0 comments
Posted on 25 June 2025 by Guest Author
This is a re-post from Yale Climate Connections by Jeff Masters and Bob Henson
In the lead-up to hurricane season, we asked you to donate in support of our coverage of hurricanes, heat waves, wildfires, and other life-threatening extreme weather events. We aimed to raise at least $10,000. And folks, you smashed that goal: Nearly 400 of you stepped up to help, contributing $37,000!
What this means:
- If a hurricane threatens our coasts this summer and fall, you can come here for the coverage you trust.
- We’ll be here to help you understand what’s happening with FEMA, NOAA, and other agencies under the Trump administration.
- We’ll be able to keep more people safe with our alerts to communities in the path of extreme weather — both in English and Spanish.
The support from our audience is beyond our wildest dreams and gives us confidence that our reporting resonates with people in a media landscape increasingly wracked by disinformation. YOU built this, and it’s an honor to create a more activated, climate-aware world alongside our donors.
And this is truly people-powered journalism: The median donation was $50, and 84% of donations were under $100. Our number of sustaining monthly supporters was multiplied by six, which helps us plan our coverage and retain superstar writers. We’re so grateful to everyone who has signed on as a sustaining donor. Will you join them?
Read more...
0 comments
Posted on 24 June 2025 by BaerbelW
A week ago today, we published a blog post highlighting Sabin Rebuttal #33, which answers the question "What is the effect of hot or cold weather on EVs?". With that blog post, this phase of our effort to turn the report "Rebutting 33 False Claims About Solar, Wind, and Electric Vehicles" into individual rebuttals was done and dusted. In this recap we summarize the happenings and provide some behind-the-scenes glimpses into the tasks needed to pull this off. The report was written by Matthew Eisenson, Jacob Elkin, Andy Fitch, Matthew Ard, Kaya Sittinger & Samuel Lavine and published by the Sabin Center for Climate Change Law at Columbia Law School in 2024.
Read more...
1 comments
Posted on 23 June 2025 by Guest Author
This video includes personal musings and conclusions of the creator climate scientist Dr. Adam Levy. It is presented to our readers as an informed perspective. Please see video description for references (if any).
Since President Trump took office in January 2025, he's declared war on climate change research. In this video, I speak with three expert scientists, who explain the devastation caused by Trump's attacks on climate researchers, institutions and reports. These assaults aren't just a huge deal in the USA, where they limit our ability to forecast extreme weather disasters. But they'll also affect our ability to be safe from climate extremes the world over - now and in the future.
Support ClimateAdam on patreon: https://patreon.com/climateadam
Read more...
0 comments
Posted on 22 June 2025 by BaerbelW, Doug Bostrom
A listing of 29 news and opinion articles we found interesting and shared on social media during the past week: Sun, June 15, 2025 thru Sat, June 21, 2025.
Stories we promoted this week, by category:
Climate Science and Research (6 articles)
- Climate Crisis 'Evil Twin' Is Coming for Marine Life Scientists have warned that the planet crossed the global boundary for ocean acidification around the year 2020, according to a new study. Newsweek, Thomas Westerholm, Jun 16, 2025.
- Human influence on climate detectable in the late 19th century A new paper describes how humans were influencing Earth's climate by cooling the stratosphere in the late 19th century. Proceedings of the National Academies of Sciences, Ben Santer et al. , June 16, 2025.
- Study finds planetary waves linked to wild summer weather have tripled since 1950 Phys.org, Seth Borenstein (AP), Jun 17, 2025.
- Why imperfect climate models are more helpful than you think Even flawed models are helping scientists unlock new truths about our changing planet. Yale Climate Connections, Ryan O’Loughlin, Jun 17, 2025.
- Guest post: Why 2024`s global temperatures were unprecedented, but not surprising Human-caused greenhouse gas (GHG) emissions in 2024 continued to drive global warming to record levels. Carbon Brief, Piers Forster and Debbie Rosen, Jun 18, 2025.
- Skeptical Science New Research for Week #25 2025 Our latest listing of research on anthropogenic climate change, how it's changing our lives now, and how we'll deal with the problem we've created. Skeptical Science, Doug Bostrom & Marc Kodack, Jun 19, 2025.
Climate Policy and Politics (6 articles)
- What the Nation Stands to Lose Without climate.gov Council on Strategic Risks, Center for Climate and Security, June 11, 2025.
- How Trump`s assault on science is blinding America to climate change E&E News, Politico, Scott Waldman, Jun 16, 2025.
- The World`s Banks are Still Betting on Fossil Fuel Industry Growth The biggest funders of fossil fuel expansion are U.S. banks that, like those in other countries, are retreating on their climate commitments. Inside Climate News, Georgina Gustin, Jun 17, 2025.
- Voters Are Concerned About Rising Costs and Think Climate Change Will Financially Affect Them This report illustrates a growing split between US voters and leadership of the federal government on how matters of energy and climate are being handled. Data For Progress, Brynne Robbins and Elias Kemp, June 17, 2025.
- Trump cuts to NOAA, NASA 'blinding' farmers to risks, scientists warn TheHill.com, Saul Elbein, Jun 18, 2025.
- NOAA`s climate information portal to go silent The Trump adminstration continues to efficiently generate synthetic ignorance. E&E, Politico, Daniel Cusick, Jun 18, 2025.
Read more...
0 comments
Posted on 21 June 2025 by Sue Bin Park
Skeptical Science is partnering with Gigafact to produce fact briefs — bite-sized fact checks of trending claims. You can submit claims you think need checking via the tipline.
Is modern warming just a rebound from the Little Ice Age?
Global temperatures are warmer today than immediately before the Little Ice Age.
The Little Ice Age was a regional cooling phenomenon caused by internal forcings that mostly moved heat around within Earth’s climate system.
This event affected North America and Europe from 1350 to 1850. While external forcings like volcanic eruptions and decreased solar activity occurred, it was a massive export of Arctic sea ice into the North Atlantic by warm currents that disrupted ocean circulation and triggered prolonged regional cooling.
The end of the Little Ice Age coincided with rising solar output and industrial greenhouse gas emissions. However, since the 1950s, solar activity has declined while global temperatures have increased.
Today’s warming is driven by human emissions, increasing the amount of heat in the system rather than redistributing it.
The late 20th century is the warmest interval in the last 2,000 years for over 98% of the globe.
Go to full rebuttal on Skeptical Science or to the fact brief on Gigafact
This fact brief is responsive to quotes such as this one.
Sources
University of Massachusetts Winter Is Coming: Researchers Uncover the Surprising Cause of the Little Ice Age
Eos The Little Ice Age Wasn’t Global, but Current Climate Change Is
Journal of Geophysical Research Global warming in the context of the Little Ice Age
Salon What climate change deniers get totally wrong about the Little Ice Age
Science Global Signatures and Dynamical Origins of the Little Ice Age and Medieval Climate Anomaly
Nature No evidence for globally coherent warm and cold periods over the preindustrial Common Era
Read more...
0 comments
Posted on 20 June 2025 by BaerbelW, Doug Bostrom
Every year on 21st June we encourage everyone to participate in "Show your Stripes Day" to start conversations about climate risks and solutions. Springboarding from a crocheted blanket created by fellow University of Reading professor Ellie Highwood, the "warming stripes" graphic was created in 2018 by Prof. Ed Hawkins, who explains the visualization's purpose in this video:
The "warming stripes" have been embraced around the world as a clear and vivid representation of how the climate is changing-- a powerful appeal to urgency in addressing our climate crisis.
From the website of the University of Reading:
What is Show Your Stripes Day?
Show Your Stripes Day is a global moment to share our concern about how the climate is changing and the need for urgent action.
We ask everyone to share the famous “warming stripes”, a powerful visual representation of how temperatures have increased around the world since the industrial revolution. Created by climate scientist Professor Ed Hawkins at the University of Reading, each stripe represents one year. The colours transition from cool blues to warm reds to represent the increases in temperature seen throughout the past 150 years or more.
On 21 June we call on individuals, businesses, and cities around the world to highlight their local climate stripes and share the powerful message they convey.
Why is it important?
Show Your Stripes Day provides a simple, yet impactful way to communicate the reality of climate change. By condensing decades of temperature data into a series of recognisable stripes, it makes understanding global warming accessible to all, from being able to recreate the stripes in schools, to sharing local stripes across social media.
The stripes have also been important for striking up global conversations. In the past, on this day, they have been displayed in a wide range of prominent public spaces, from Times Square, New York, to the While Cliffs of Dover, UK. By displaying the stripes in locations worldwide, people have been inspired to download and share the stripes online and help spread their message.
2024 was the warmest year on record globally. Extreme weather events continue to be seen more frequently around the world. Never has the need to address climate change been more urgent.
Read more...
0 comments
Posted on 19 June 2025 by Doug Bostrom, Marc Kodack
Open access notables
Human influence on climate detectable in the late 19th century, Santer et al., Proceedings of the National Academy of Sciences
When could scientists have first known that fossil fuel burning was significantly altering global climate? We attempt to answer this question by performing a thought experiment with model simulations of historical climate change. We assume that the capability to monitor global-scale changes in atmospheric temperature existed as early as 1860 and that the instruments available in this hypothetical world had the same accuracy as today’s satellite-borne microwave radiometers. We then apply a pattern-based “fingerprint” method to disentangle human and natural effects on climate. A human-caused stratospheric cooling signal would have been identifiable by approximately 1885, before the advent of gas-powered cars. Our results suggest that a discernible human influence on atmospheric temperature has likely existed for over 130 y.
Facebook algorithm’s active role in climate advertisement delivery, Sankaranarayanan et al., Nature Climate Change
Climate advertising on social media can shape attitudes towards climate change. Delivery algorithms, as key actors in the climate communication ecosystem, determine ad audience selection and might introduce demographic bias. Here, we present a two-part study—an observational analysis (n = 253,125) and a field experiment (M = 650)—to investigate algorithmic bias in Facebook’s climate ad dissemination. Our findings provide preliminary evidence that the algorithm’s selection of ad audiences can be explained by factors such as ad content, audience location (US states), gender and age group. Moreover, the cost-effectiveness of contrarian ads is linked with the conservative political alignment of a state, while the cost-effectiveness of advocacy ads correlates with liberal political alignment, higher population and per-capita gross domestic product; ad targeting strategies further modulate these effects. The skew in the distribution of climate ads across US states, age groups and genders reinforces existing climate attitudes.
Political differences in climate change knowledge and their association with climate attitudes, behavior, and policy support, Stockus and Zell, Journal of Environmental Psychology
Liberals are more likely to believe that climate change is a serious matter that requires immediate action than conservatives. Nonetheless, little is known about why this political difference in attitudes occurs. We tested whether liberals have superior knowledge about climate change than conservatives and whether political differences in knowledge are associated with climate attitudes (total N = 649, Prolific). In a U.S. sample, Study 1 found that Democrats had better knowledge about climate change than Republicans. Additionally, there was an indirect association of political party with climate attitudes and support for climate policies through knowledge. Study 2 replicated these findings and found a similar indirect association with climate change mitigation behaviors. Study 3 partially replicated the above effects in the UK. Although limited by use of cross-sectional designs, these data suggest that knowledge about climate change is associated with political differences in climate attitudes, behavior, and policy support.
How media competition fuels the spread of misinformation, Amini et al., Science Advances
Competition among news sources over public opinion can incentivize them to resort to misinformation. Sharing misinformation may lead to a short-term gain in audience engagement but ultimately damages the credibility of the source, resulting in a loss of audience. To understand the rationale behind news sources sharing misinformation, we model the competition between sources as a zero-sum sequential game, where news sources decide whether to share factual information or misinformation. Each source influences individuals based on their credibility, the veracity of the article, and the individual’s characteristics. We analyze this game through the concept of quantal response equilibrium, which accounts for the bounded rationality of human decision-making. The analysis shows that the resulting equilibria reproduce the credibility-opinion distribution of real-world news sources, with hyperpartisan sources spreading the majority of misinformation. Our findings provide insights for policymakers to mitigate the spread of misinformation and promote a more factual information landscape.
From this week's government/NGO section:
[By chance this edition's collection includes a group of reports particularly indicative of general and significant misalignment between priorities of politicians versus the people they serve.]
Climate Change in the American Mind: Politics & Policy, Spring 2025, Leiserowitz et al., Yale University and George Mason University
This report is based on findings from a nationally representative survey. Interview dates: May 1 -12, 2025. Interviews: 1,040 adults (18+), 915 of whom are registered to vote. Average margin of error for registered voters: +/- 3 percentage points at the 95% confidence level. 52% of registered voters think global warming should be a high or very high priority for the president and Congress. 64% of registered voters think developing sources of clean energy should be a high or very high priority for the president and Congress. Majorities of registered voters support a range of policies to reduce carbon pollution and promote clean energy. These include, 88% support federal funding to help farmers improve practices to protect and restore the soil so it absorbs and stores more carbon; 80% support funding more research into renewable energy sources; 75% support regulating carbon dioxide as a pollutant; 71% support tax credits or rebates to encourage people to buy electric appliances, such as heat pumps and induction stoves; 67% support transitioning the U.S. economy from fossil fuels to 100% clean energy by 2050 ; and 63% support requiring fossil fuel companies to pay for the damages caused by global warming.
New Zealand at climate change crossroads, AMI, State and NZI, IAG New Zealand
New Zealanders are expecting more extreme weather events as a result of climate change. They want more to be done to reduce the risks and costs of these events to help keep insurance affordable and available. 90% of New Zealanders anticipate more extreme storms, 89% foresee more frequent and intense flooding, and 88% expect coastal flooding due to rising sea levels. As New Zealanders brace for a future shaped by more frequent and severe climate events, many expect the cost of these events to be reflected in insurance premiums.
Voters Are Concerned About Rising Costs and Think Climate Change Will Financially Affect Them, Brynne Robbins and Elias Kemp, Data for Progress
Voters nearly universally believe that energy and environmental issues are important to address. This holds across party lines: 95% of Democrats, 94% of Independents, and 88% of Republicans indicate that energy and environmental issues are either important or a top priority to them. However, the degree of importance varies significantly with party affiliation. Nearly half (49%) of Democrats say energy and environmental issues are a top priority, while only a third (33%) of Independents and just under a quarter (23%) of Republicans feel the same. When asked whether they believe climate change will have a direct financial impact on them and their family, a majority (58%) of likely voters say it will impact them either greatly or somewhat. Democrats most commonly believe this, with 73% saying that they will be either greatly or somewhat impacted, while only 41% of Republicans believe the same. Just 52% of white voters predict they’ll be impacted, compared with 64% of Black voters and 73% of Latino voters. Women (62%), voters under 45 (66%), and voters with a college degree (60%) also predict greater financial impact.
Two-thirds of Canadians favour developing clean energy over fossil fuels, while 85% wish to maintain or increase federal climate action, Abacus Data, Clean Energy Canada
Two-thirds of Canadians say they would prioritize clean over conventional energy. Specifically, 67% of respondents say that, assuming both were priorities, they would generally favor clean energy projects such as critical minerals, renewable power and transmission, and energy storage. The remaining 33% would prefer conventional fossil fuel projects like oil and gas, including LNG development. Asked how crucial the two energy sectors will be to the Canadian economy over the next decade, 87% say clean energy will be very (45%) or pretty (42%) important, while 83% say fossil fuels will be very (36%) or pretty (47%) important. In other words, the four-point advantage for clean energy increases to nine points among those who see at least one of these sectors as “very important.”
156 articles in 66 journals by 932 contributing authors
Physical science of climate change, effects
Observation-based estimate of Earth’s effective radiative forcing, Van Loon et al., Proceedings of the National Academy of Sciences Open Access 10.1073/pnas.2425445122
Read more...
0 comments
Posted on 18 June 2025 by Zeke Hausfather
This is a re-post from The Climate Brink
Over at Carbon Brief I have a new detailed explainer on aerosols. They have a major (but poorly constrained) cooling effect on the climate, masking about 0.5C warming from CO2 and other greenhouse gases that would otherwise have occurred.
However, we are rapidly reducing both aerosol emissions and their resulting climate cooling effect. Global emissions of SO2, the most important aerosol, have fallen by 40% since the mid?2000s. China has cut its SO2 emissions more than 70% over the same period.
This is a good thing; SO2 is a major precursor to PM2.5, which is responsible for millions of deaths from outdoor air pollution worldwide. But reductions to clean the air are quickly unmasking more warming from our past greenhouse gas emissions.
While the Carbon Brief piece goes into quite a bit of detail about how aerosols influence the climate and how emissions have changed over time, I thought readers here would be particularly interested in the novel part of the piece where I estimate the global temperature impact of these recent reductions.
Read more...
0 comments
Posted on 17 June 2025 by Ken Rice
On November 1, 2024 we announced the publication of 33 rebuttals based on the report "Rebutting 33 False Claims About Solar, Wind, and Electric Vehicles" written by Matthew Eisenson, Jacob Elkin, Andy Fitch, Matthew Ard, Kaya Sittinger & Samuel Lavine and published by the Sabin Center for Climate Change Law at Columbia Law School in 2024. Below is the blog post version of rebuttal #33 based on Sabin's report.
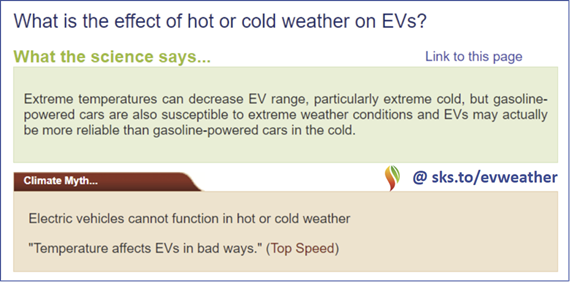
Extreme temperatures can decrease EV range, particularly extreme cold, but this issue is not unique to EVs. According to a 2019 American Automobile Association report, when compared to conditions of 75°F with the HVAC set to Off, a typical EV’s range decreased by 12% at 20°F, and by 4% at 95°F1. When comparing conditions with the HVAC set to Auto, a temperature drop from 72°F to 20°F decreased a typical EV’s range by 41%2, and a temperature rise from 72°F to 95°F decreased range by 17%. However, EV models are increasingly adopting heat pump technology in place of traditional electric resistance heating3, which can minimize the electricity consumption associated with heating an electric vehicle in extreme cold4.
Traditional gasoline-powered cars are likewise susceptible to extreme weather conditions. Fuel economy tests have also shown a decrease in mileage per gallon for conventional gasoline cars due to temperature drops, with mileage roughly 15% lower at 20°F than at 72°F5. As with EVs, decreased fuel efficiency for conventional gasoline cars in extreme weather is partially attributable to increased reliance on HVAC systems. Both EVs and gasoline-powered cars are likewise susceptible to cold temperatures lowering tire pressure6.
Data from a roadside assistance company in Norway suggests that, by one metric, EVs may actually be more reliable than gasoline-powered cars in the cold7. In particular, whereas internal combustion engines sometimes have trouble starting in the cold, this problem appears to be less common for EVs: while 23% of cars in Norway are EVs, only 13% of reported cases involving cars that failed to turn on in the cold were EVs8.
Read more...
2 comments
|
|


The Consensus Project Website
THE ESCALATOR

(free to republish)
|


 Arguments


