Climate Science Glossary

Term Lookup

Enter a term in the search box to find its definition.

Settings

Use the controls in the far right panel to increase or decrease the number of terms automatically displayed (or to completely turn that feature off).

Term Lookup

Settings


All IPCC definitions taken from Climate Change 2007: The Physical Science Basis. Working Group I Contribution to the Fourth Assessment Report of the Intergovernmental Panel on Climate Change, Annex I, Glossary, pp. 941-954. Cambridge University Press.

Home Arguments Software Resources Comments The Consensus Project Translations About Support

Twitter Facebook YouTube Mastodon MeWe

RSS Posts RSS Comments Email Subscribe


Climate's changed before
It's the sun
It's not bad
There is no consensus
It's cooling
Models are unreliable
Temp record is unreliable
Animals and plants can adapt
It hasn't warmed since 1998
Antarctica is gaining ice
View All Arguments...


Username
Password
New? Register here
Forgot your password?

Latest Posts

Archives

Santer et al. Catch Christy Exaggerating

Posted on 14 September 2011 by dana1981

Christy Crocks (200 x 70 pixels)It's been a rough few weeks for climate "skeptics."  The first week of September began with the editor of Remote Sensing resigning in order to take responsibility for publishing Roy Spencer's fundamentally flawed paper.  Just a few days later, Andrew Dessler's paper was published, demolishing the flawed Spencer paper, another flawed Lindzen paper, and the "internal variability" argument in general.  Climate "skeptics" did not react well to the news, attacking the journal for publishing the paper at its normal pace (how dare they!?).  With Spencer and Lindzen debunked by a peer-reviewed publication, it's only fitting that the other prominent "skeptic" climate scientist, John Christy, would join the party. 

Debunking Christy's Congressional Testimony

On August 21st, the Journal of Geophysical Research, Atmospheres accepted a paper by Ben Santer and a number of other very prominent climate scientists (Santer et al. 2011) which, among other issues, sought to evaluate some claims made by Christy in his recent Congressional testimony (whose other errors we previously discussed).  Christy argued that the temperature of the lowest layer of the atmosphere, the temperature of the lower troposphere (TLT), was not warming nearly as fast as models predicted:

"In 1994, Nature magazine published a study of mine in which we estimated the underlying rate at which the world was warming by removing the impacts of volcanoes and El Niños (Christy and McNider 1994)...The result of that study indicated the underlying trend for 1979-1993 was +0.09°C/decade which at the time was one third the rate of warming that should have been occurring according to estimates by climate model simulations."

In his written testimony, Christy updated this analysis through 2010:

"In an interesting result, the new underlying trend remains a modest +0.09 C/decade for the global tropospheric temperature, which is still only one third of the average rate the climate models project for the current era (+0.26°C/decade.)"

However, one major flaw in this analysis, noted by Santer et al., is that Christy removed the effects of ENSO and volcanoes from the observational TLT data, but not from the model data.  Further, Christy did not remove the effects of human aerosol emissions, solar activity, or a number of other factors which had a net cooling effect between 1979 and 2010.

In a different approach, Santer et al. examined the data without removing any effects:

"Our comparison of ‘raw’ modeled and observed trends (Figure 6F) does not involve removal of ENSO and volcanic effects from observations alone, and is not restricted to a single period of record. We find that for the range of TLT trends considered here, there is no trend length at which the multi-model average trend, bf, is more than 1.73 times larger than bo, the average observed TLT trend (see Figure 6F). Across the 10-to 32-year range of trend lengths, the average ratio of bf /bo is 1.35 for RSS v3.2, 1.46 for RSS v3.3, and 1.55 for UAH."

Santer Figure 6

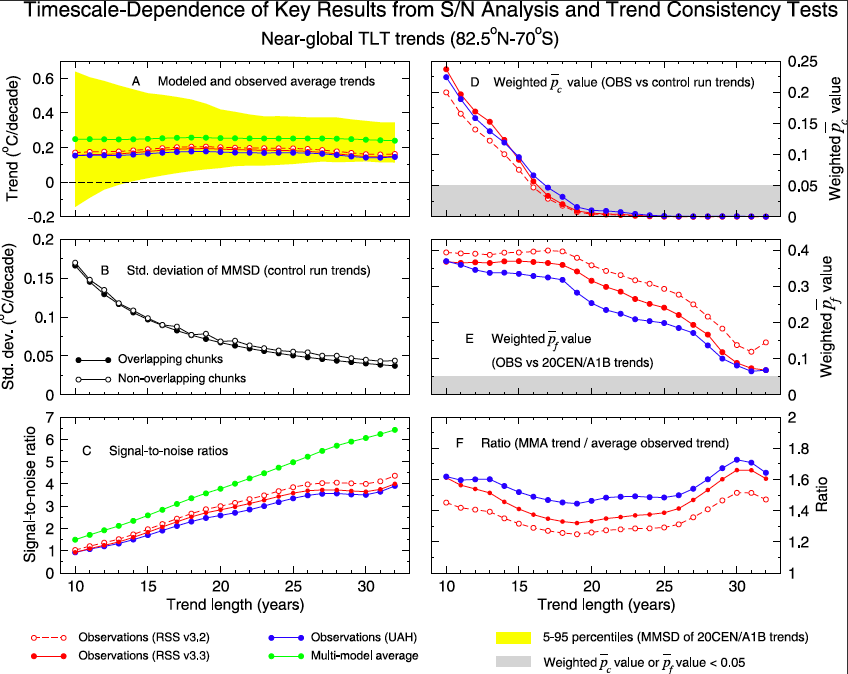
Santer et al. (2011) Figures 6A and 6F, showing modeled vs. observed TLT trends.

In short, it's true that lower troposphere temperature warming trend isn't as large as models project, as illustrated in Figures 6A and 6F. Figure 6A shows the TLT trend predicted by models (green) is higher than in the RSS (red) and UAH (blue) satellite observations for the entire 32 years of data (although the trends are within the [yellow] 95% uncertainty range).  Figure 6F shows that the ratio of model trend to observed trends ranges between about 1.25 and 1.73, meaning that the models predict a trend anywhere from 25 to 73% larger than the satellite data shows over those 32 years.

However, the average discrepancy is approximately 45%; not nearly as large as Christy's claimed factor of three. 

Sources of Model-Data Discrepancy

Santer et al. note that the reasons behind this discrepancy will be investigated in future studies.  However, they discuss a few likely contributors:

"Here, it is sufficient to note that many of the 20CEN/A1B simulations neglect negative forcings arising from stratospheric ozone depletion, volcanic dust, and indirect aerosol effects on clouds....It is likely that omission of these negative forcings contributes to the positive bias in the model average TLT trends in Figure 6F. Given the considerable technical challenges involved in adjusting satellite-based estimates of TLT changes for inhomogeneities [Mears et al., 2006, 2011b], a residual cool bias in the observations cannot be ruled out, and may also contribute to the offset between the model and observed average TLT trends."

In short, many models don't account for a number of factors which have had cooling effects over the past three decades, and it's also entirely possible that the satellite temperature data is still biased on the cool side.  Christy and Spencer are somewhat infamous for claiming for the better part of a decade that the UAH satellite data proved the climate wasn't warming as fast as models projected (sound familiar?), until research by a number of scientific groups [including Christy and Spencer themselves] discovered errors in their data analysis which accounted for most of the discrepancy.  A number of other papers have suggested additional changes to the satellite temperature data analysis, and these adjustments could account for yet more of the model-data discrepancy.

It's not Internal Variability

Like Dessler's paper, Santer et al. also drive another nail into the "warming due to internal variability" hypothesis by noting that although the trend may be smaller than models predict, it's still well outside the noise over the long-term:

"Our estimated signal-to-noise (S/N) ratios for global-scale TLT changes were less than 1.0 on the 10-year timescale (Figure 6C). On the 32-year timescale, however, S/N exceeded 3.9 in all three observational TLT datasets. The latter result shows that natural internal variability, as simulated by current climate models, is a highly unlikely explanation for the observed lower tropospheric warming over the satellite era"

Global Warming Continues

Santer et al. also shoot down the myth that a slowed rate of warming over a decade can prove that global warming has magically stopped:

"Because of the pronounced effect of interannual noise on decadal trends, a multi-model ensemble of anthropogenically-forced simulations displays many 10-year periods with little warming. A single decade of observational TLT data is therefore inadequate for identifying a slowly evolving anthropogenic warming signal.  Our results show that temperature records of at least 17 years in length are required for identifying human effects on global-mean tropospheric temperature."

Christy's Exaggerations

In their paper, Santer et al. have caught Christy exaggerating the discrepancy between modeled and observed lower troposphere temperature trends in his testimony before U.S. Congress.  In  his testimony, Christy also assumed that the discrepancy was due to the climate models being too sensitive to changes in atmospheric CO2.  He seems unwilling to consider the possibility that at least part of the discrepancy might be due to flaws in the data or its analysis, even though climate models have a better track record for accuracy than the UAH data analysis. 

It's a bit surprising that Christy seems unwilling to consider the possibility that his and Spencer's satellite data analysis might be the source of at least some of the model-data discrepancy.  Santer et al. also debunked the "skeptic" myths that global warming is just due to internal variability, and that a short-term slowing in the rate of warming means global warming has magically stopped.

More research must be done to determine the exact sources of the TLT model-data discrepancy, but Santer et al. appear up to the task, doing good investigative science rather than simply assuming the problem lies in the models, as Christy and his fellow "skeptics" have done (again).  Unfortunately, this is another in the long list of instances where climate "skeptics" have made significant scientific errors, and been given the platform to misinform the public and policymakers with those errors.

0 0

Printable Version  |  Link to this page

Comments

Comments 1 to 11:

  1. Our results show that temperature records of at least 17 years in length are required for identifying human effects on global-mean tropospheric temperature.
    I've heard this number a number of times, but never managed to track down a source. So recently I tried working it out for myself, learning the statistics from some of Tamino's old posts on ARMA and autocorrelation, as well as Lucia, Science of Doom and Kelly's climate charts and graphs. The standard deviation of the residual noise in the HADCRUT record after fitting a linear trend (1975-2010 as Tamino or 1913-1944 as per Lucia) is a little over 0.1C. Several different methods seem to give estimates of the effective number of parameters as ~1/6 of the number of months. So the standard error on the OLS trend needs scaling up by ~2.5x. So, having made that correction, how many years of data do you need for 2σβ to be less than 0.017C/yr? About 11, on average. (And using the same method I agree with Phil Jones that warming since 1995 becomes significant only when you include the 2010 data, so I don't think I'm doing anything badly wrong.) So I'm itching to find out what Santer has done. Am I asking the wrong question? Should I be looking at the number of years required for the trend to be statistically significant more that 95% of the time? 95% significance 95% of the time? It would be nice to never have to answer another 11 year trend again. But - it's AGU paywalled. Sigh.
    0 0
  2. Could somebody tell me if I'm interpreting Santer's Figure 6 correctly, particularly 6A and 6E? He took model outputs, which include hindcasting for most years, and projections for the last few years since AR4, and compared the model ensemble average TLT to the observations. Figure 6A shows the model average (hindcast + projection) differs from the model observations by just a little less than 2 standard deviations. Figure 6E (click on Skeptical Science graph to get the full graph) seems to confirm this by showing that the "weighted pf value (OBS vs 20CEN/A1B trends" is about 0.07. In other words, whether the model average TLT trend is significantly different than the observations depends upon whether one chooses 90% or 95% confidence interval.
    0 0
  3. Note: The keys for Figures 6A and 6F are vitually unreadable due their tiny size. Clicking on them will generate a screen showing the complete set of graphs, A thru F, in a slightly larger size. The keys are readable on the pop-up page.
    0 0
  4. Kevin - Bob Grumbine did a post on this a while back. He came up with 20 years as the minimum length, although 17 years is probably about long enough. There are several factors you need to consider.
    0 0
  5. Thanks for the pointer, CTG! I'll give it a good look, and maybe get a reprint of Santer too. If it turns out to be useful I'll try and write it all up as a resource.
    0 0
  6. I'm surprised how little attention this important paper has received here at SkS. It is an important paper, IMHO, because it provides some concrete guidelines on the times scales that need to be considered for the purpose of evaluating models and for determining trends. It is also important, of course, because it shines a light on how "skeptics", even prominent ones who should know better (like Lindzen, Michaels and Pielke Sr.) love to cherry pick to arrive at a pre-determined answer and how they love to exaggerate, in this case Dr. John Christy. For example, recall how Lindzen was implicated in a set-up for Phil Jones? The "trap" was to try and demonstrate that there had been no statistically significant warming (which "skeptics and deniers of AGW took to incorrectly mean no warming) between 1995 and 2009 (15 years) in the HadCRUT global temperature dataset? Well, as it happens if one includes just one more year (16 years) the warming between 1995 and 2010 was statistically significant at the 95% confidence level. The 16 years worth of data required to achieve that level of confidence in the HadCRUT data is consistent with the 17 years identified by Santer et al. (2011). So the challenge for "skeptics" now will be to cherry pick a dataset and a time window that shows not statistically significant warming for at least a 17 year period-- and then they can try and rehash the "planet is cooling" myth again ;)
    0 0
  7. Now I am going to turn my attention to Roger Pielke Sr.'s intriguing critique of Santer et al. (2011). He makes some odd claims. Unfortunately, he (despite demands for the climate community to be more open and transparent) does not permit comments on his blog, so I'll do it here. His first comment is rather bizarre. He says "This is an unusual number of co-authors for a technical paper, but I assume Ben Santer wants to show a broad agreement with his findings." It is not at all that unusual, he clearly missed the authorship of the recent Kirkby et al. (2011) paper in nature. Anyways, such an irrelevant observation is rather petty. He is then perturbed that Santer et al. ignored his important paper that he co-authored with Christy et al. in 2010. He then stretches, I mean really stretches, to try and make a link between Santer et al. (2011) having the temerity to ignore their "important" paper (published in an obscure journal (Remote Sensing) around which a controversy is raging for giving a free pass to a dodgy paper by fellow 'skeptic' Spencer. But I digress, this framing by Pielke Sr. smacks of desperation, because the papers deal with two very different issues. From the abstract of Santer et al. (2011): "We compare global-scale changes in satellite estimates of the temperature of the lower troposphere (TLT) with model simulations of forced and unforced TLT changes . While previous work has focused on a single period of record, we select analysis timescales ranging from 10 to 32 years..." From Christy et al. (2010): "Updated tropical lower tropospheric temperature datasets covering the period 1979–2009 are presented and assessed for accuracy based upon recent publications and several analyses conducted here." They were clearly looking at very different areas of the planet, global versus tropical only, additionally Christy et al. (2010) also looked at the ratio of warming aloft and that at the surface in the tropics, with Santer et al. looking at the warming over the lower troposphere. Pielke then takes issue with this statement in Santer et al. (2011): "….temperature records of at least 17 years in length are required for identifying human effects on global-mean tropospheric temperature.” Not sure that he makes a compelling case, he just interprets the text differently. But why I pint this out now is that later, says this: "I agree with Santer et al that “[m]inimal warming over a single decade does not disprove the existence of a slowly-evolving anthropogenic warming signal.” OK, so far so good, but then Pielke make this ludicrous assertion: "There has been NO long-term trend since the large El Nino in 1998. That’s 13 years. [His underlining] So after just saying that he agrees with Santer and knowing that one of the major findings of the paper was that one cannot use trends calculate dover periods of less than 17 years to infer anything about the rate of warming, Pielke goes and says "there has been no warming for 13 years", and he conveniently chooses 1998 as his start point! Unbelievable. And Santer et al. find that the signal-to-noise ratio for 10 year trends is near one, and Pielke proudly states no warming for 13 years. Now how about we actually calculate the trend in the RSS satellite data for a minimum period of 17 years as found by Santer et al. (2011), so for 1994-2010: That trend is slope = 0.11 C per decade. For 20 years the trend increases to 0.18 C per decade. So if one look sat the appropriate data interval then the warming continues. Now here is another interesting fact, and an ironic one at that given that Pielke is accusing others of ignoring his "important" research. In 2010 two papers came out, Thorne et al. (2010) and Johnson and Xie (2010). Sks discusses the papers here. Both those papers' findings refute the claim made in Christy et al. (2010) that: "This result indicates the majority of AR4 simulations tend to portray significantly greater warming in the troposphere relative to the surface than is found in observations." Specifically, Thorne et al. (2010) find: "It is concluded that there is no reasonable evidence of a fundamental disagreement between tropospheric temperature trends from models and observations when uncertainties in both are treated comprehensively." Johnson and Xie (2010) find: "We conclude that, in contrast with some observational indications, the tropical troposphere has warmed in a way that is consistent with moist-adiabatic adjustment, in agreement with global climate model simulations." Can I find a discussion of Thorn et al. (2010) or Johnson and Xie et al. (2010) on Pielke's site? No. I did find this though :) Pielke's critique of Santer et al. is far, far from objective, his biases are clear. In fact, is nothing more than an effort to dismiss their results and try place the focus on their perceived "important" work which has since been refuted by Thorne et al. It also shows that Pielke Snr. is still determined to cherry-pick data to arrive at preconceived (and biased) conclusions. And let it also be noted that at no time did Pielke Sr. acknowledge that Christy had grossly exaggerated his numbers and misled congress.
    0 0
  8. Albatross #7 - even if we go along with Pielke's absurd cherrypick of 1998 as a starting point (ENSO is amplified more in the satellite data than surface temps, and 1998 was the strongest El Nino in a century, not to mention that, as you note, 13 years is shorter than the 17 required as noted by Santer et al.), UAH still shows a trend of 0.06°C/decade over that period. It's small, and certainly not statistically significant, but it's not zero either, despite the utterly absurd cherrypick.
    0 0
  9. Dana, It is a double-cherry pick by Pielke. The RSS trend for the cherry-picked window is slightly negative. He claims that he used RSS b/c that is what Santer et al. used, when in fact they clearly used both RSS and UAH as shown in Fig. 6. What he did is quite disgraceful really.
    0 0
  10. The most disgraceful aspect is the cherrypicked starting date in 1998, which Pielke knows was a huge El Nino year. But yes, Santer et al. used both RSS and UAH data.
    0 0
  11. 'His first comment is rather bizarre. He says "This is an unusual number of co-authors for a technical paper, but I assume Ben Santer wants to show a broad agreement with his findings."' How many co-authors were on the Fall et al surface stations paper?
    0 0
    Moderator Response: [Dikran Marsupial] It is quite common to have lots of authors in some fields, e.g. this paper.

You need to be logged in to post a comment. Login via the left margin or if you're new, register here.


The Consensus Project Website

THE ESCALATOR

(free to republish)


© Copyright 2024 John Cook
Home | Translations | About Us | Privacy | Contact Us