


 Arguments


How much will sea levels rise in the 21st Century?
Posted on 5 August 2013 by gpwayne
This post is a new 'basic' level rebuttal of the myth: "Sea level rise predictions are exaggerated."
What the science says
Sea levels are rising faster now than in the previous century, and could rise between 50cm to 1.5 metres by 2100
Measuring Sea Levels
Sea levels are rising due to thermal expansion and melting of land-based ice. Global warming is causing the oceans to absorb a lot of extra heat (up to 90%). This makes the volume of water expand, and sea levels rise. The Greenland and Antarctic ice caps, and many of the world’s glaciers, are all slowly melting. The runoff feeds into rivers and directly into the oceans. This too adds to sea levels.
Prior to the use of satellite systems, measurements were taken using tide-gauges, devices that measure the height of a water level relative to a fixed point on land. Global estimates of sea level rise were subject to substantial differences in measurement from different parts of the world.
Sea levels change all the time. They are affected by seasons, astronomical tides, storm surges, currents and density, among other influences. Tidal gauges reflect these short term influences, introducing a large margin of error.
The IPCC Fourth Assessment Report described studies that estimated sea level rise for the 20th century between 0.5 and 3.0 mm a year. The most likely range, according to the IPCC, was between 1.0 and 2.0 mm a year.
Satellite altimetry since 1993 provides a more accurate measure of global sea level rise. Three different satellites take measurements: TOPEX/Poseidon (launched 1992), Jason-1 (launched 2001) and Jason-2 (launched 2008).
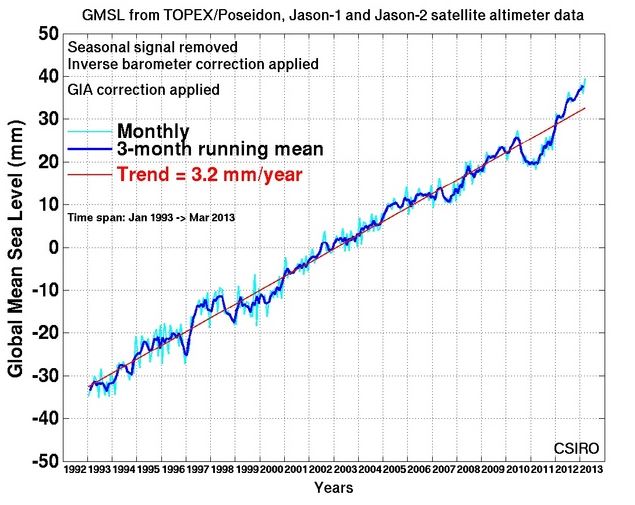
Figure 1: Source - CSIRO
The IPCC projections are derived from climate models. Using both tide gauge and satellite data, we can see that sea levels are rising. Unfortunately, sea level rise is already tracking the worst-case projections, as this graph shows:

Figure 2: Sea level change. Tide gauge data are indicated in red and satellite data in blue. The grey band shows the projections of the IPCC Third Assessment report (Allison et al 2009).
In fact, the climate models underestimated the rate of sea level rise because the rapid melting of the ice sheets and glaciers was not incorporated in the last IPCC report. (It was left out because the data were not considered sufficiently robust).
Damaging Potential
Rising sea levels are widely considered to be the greatest threat posed by climate change. They threaten low-lying countries with inundation, forcing inhabitants to migrate. Coastal cities and ports could be flooded, as could cities sited near tidal estuaries, like London. Many nuclear installations are built by the sea so they can use sea water for cooling.
The potential for sea level rise is enormous. This is because the ice caps - Greenland and Antarctic - contain huge amounts of fresh water - around 70% of all the freshwater on Earth. Estimates suggest that if the Greenland ice sheet was to melt away to nothing, sea levels would rise around 6 metres. To put that a different way, a loss of just one per cent of the Greenland ice cap would result in a sea level rise of 6cm.
If the West Antarctic Ice Sheet (WAIS) were to melt, this would add around 6 metres to sea levels. If the East Antarctic Ice Sheet (EAIS) were to melt as well, seas would rise by around 70 metres.
In a process that is accelerating, all three ice caps are losing mass. While nobody is suggesting any of the ice caps will melt away to nothing, only a small amount of melting would cause great problems.
A 1% loss of ice from these three sources would produce a likely increase in sea levels of around 76cm. With the thermal expansion implied by such melting, and contributions from melting glaciers, the oceans would actually rise far more.
Predictions for future sea levels
Future sea level rises depend on a number of factors. The amount of CO2 emitted will determine how much global warming takes place. The amount of ice that melts will vary according to the amount of global warming. The same is true of thermal expansion.
Previous estimates of sea level rise have been based on a set of possible outcomes called emissions scenarios. These theoretical scenarios range from emissions which fall very quickly, to emissions that continue to rise even faster than they have already. Scientists then calculate possible outcomes for each scenario.
In the next IPCC report (AR5), due in 2014, a new method has been used. Emission scenarios have been replaced by Representative Concentration Pathways (RCP). Four trajectories were chosen, based not on emissions, but possible greenhouse gas concentrations in the year 2100. From the concentrations, the RCPs project a ‘forcing’ for each pathway (the amount of warming); 2.6, 4.5, 6.0, and 8.5 Watts per metre squared. Each pathway is named after it’s forcing e.g. RCP4.5. The lowest emission scenario is also referred to as RCP3PD, because it posits a peak warming of 3 w/m2 by 2070 (~490 ppm CO2 and equivalents), and a reduction to 2.6 w/m2 by 2100. (PD stands for Peak/Decline).
A draft version of the next report from the IPCC (AR5), due for publication soon, was recently leaked. Although the information is subject to change, the draft report says sea levels are likely to rise by between 29 and 82 centimeters by the end of the century, (compared to 18-59 centimeters in the 2007 report).
Other recent studies have projected comparable sea level increases. Jevrejeva 2011 for example modelled sea level rise using RCP scenarios. ) This table shows best and worst cases (RCP3PD and RCP8.5), with two in between. The figures for each projection are listed in this table:
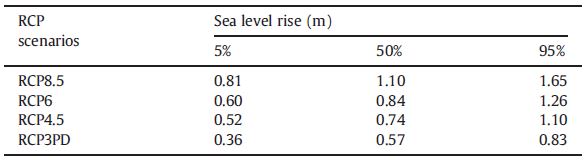
Table 1: Projected sea level rise (m) by 2100 for the RCP scenarios. Results presented as median, upper (95% confidence interval) and lower (5% confidence interval) limits, calculated from 2,000,000 model runs. Sea level rise is given relative the period 1980–2000. (Jevrejeva 2011)
Another study (Rahmstorf 2011) obtained much the same results:
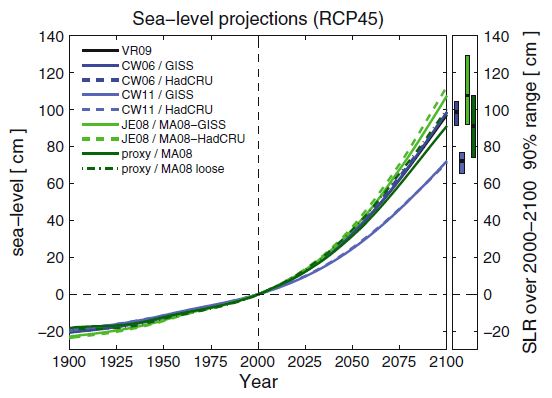
Figure 4: Sea level hindcasts and projections for different models calibrated with different temperature and sea level data. The error bars on the right indicate 90% confidence intervals (5–95 percentile, using the GISS temperature dataset); for the proxy-based projection the uncertainty is as presented in Kemp et al., 2011. (Rahmstorf 2011)
What's in the pipeline?
The 'pipeline' is a term used to describe the slow reaction of the oceans to heating (inertia). Even if we were to stop emitting greenhouse gases tomorrow, the oceans would continue to rise, driven by the heat already stored. (90% of all the sun's energy falling on the surface of Earth is absorbed by the oceans as heat). This sea level rise is said to be 'in the pipeline'.
A paper published in PNAS - Levermann 2013 - has found that greenhouse gases emitted today will cause sea levels to rise for several centuries. For every degree of warming, sea levels will rise by more than 2 meters in the next few centuries. The Earth's temperature has already risen 0.8 degrees C over pre-industrial temperatures.
Jevrejeva 2011 also found increased rates of sea level rise, even if emissions were to stabilise at 490 ppm by 2070 following the scenario in RCP3PD (RCP2.6):
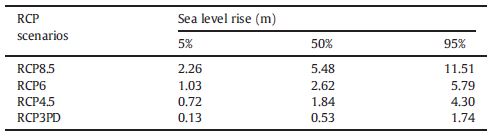
Table 2: Projected sea level rise (m) by 2500 for the RCP scenarios. Results presented as median, upper (95% confidence interval) and lower (5% confidence interval) limits, calculated from 2,000,000 runs of the model. Values of sea level rise are given relative the period 1980–2000.
Conclusion
Based on the new mid-range IPCC RCP4.5 scenario - around 650 ppm CO2 and equivalents producing a forcing of approximately 4.5 watts/metre2 - the most likely sea level rise by 2100 is betweem 80cm and 1 metre. Longer term, sea levels will continue to rise even after emissions have been reduced or eliminated.


I want to nitpick on your AR5 date: you mention 2014.
But the part of AR5 relevant to this article (WG I: The Physical Science Basis) should be ready in September 2013, so just one month from now. So readers will not wait for the official document for as long as you imply.
The other parts of AR5 (WG II, WG III & synthesis) to be released successively until Oct 2014, will be mostly irrelevant to this article or not changing anything.
Excellent post. Many of these numbers are lower than others I have heard.
I find the first paragraph in "whats in the pipeline" to be a little confusing. Is the future sea level rise caused by heat already absorbed or is it from the current energy imbalance caused by greenhouse gases already emitted?
Hopefully scientists will forecast sea level rise more successfully than they have forecast Arctic Sea Ice.
michael sweet - "In the pipeline", or as I prefer to call it, "unrealized warming", is the change in temperature required to cancel out the current top of atmosphere (TOA) energy imbalance. It is in effect the difference between the GHG changes and the lagged climate response, mostly due to the thermal mass (inertia) of the oceans.
If climate forcings stopped changing right now, there would still be warming until the oceans caught up with previous forcing changes. As it stands, however (under current economic outlooks), changes in forcings are remaining well ahead of the climate response.
@KR You didn't quite answer Michael's question. The current wording "Even if we were to stop emitting greenhouse gases tomorrow, the oceans would continue to rise, driven by the heat already stored." doesn't seem to be saying that future sea level rise is inevitable as a result of future heating that will continue until the atmosphere warms up enough for the outgoing TOA energy flow to balance the incoming energy flow. It seems to be saying that the heat that is already stored in the oceans would cause additional future sea level rise even if atmospheric temperatures were to immediately become stable.
It's important to keep in mind this is the global average. Localities may see twice this.
DJon - Good point, the opening post text is incorrect (I was responding just to michael sweets comment). The text should say something like:
"In the pipeliene" relates to the thermal inertia of the polar ice sheets which will potetially take hundreds or even thousands of years to stabalise in a warmer world.
I persionally think that the RCP 8.5 is currently the most likely scenario based on current and commited emissions. I also think there should have been RCP 10 scenario. Maybe this can be looked at in CMIP6.
Good and important stuff! Thanks!
Typos: "RPC" should be "RCP"
Rahmstorf 2011 compares a number of different studies, most seem larger than Jevrejeva 2011.
Aslak Grinsted discusses the very long term in a recent goof post:
http://www.glaciology.net/Home/Miscellaneous-Debris/glacierprojections
I mean *good* post
I'm not an expert, but I think "in the pipeline" refers to excess heat that will be retained by the carbon dioxide and other GWGs in the future even if we stop increasing the 400 parts per million already in the atmosphere. That CO2 will be there an average of roughly 400 years. Also, it's not that 90% of all the sun's energy is absorbed by the sea, but that 90+% of the excess heat retained by planet Earth that is absorbed by the sea. The majority of the sun's energy is reflected or is radiated back into outer space. Unfortunately, the small excess absorbed and not radiated back into outerspace is going to wreck massive destruction on our planet, including the U.S. and its population.
“For every degree of warming, sea levels will rise by more than 2 meters in the next few centuries. The Earth's temperature has already risen 0.8 degrees C over pre-industrial temperatures.”
Given this statement should we now be observing global mean sea level ~1.6 metres above the pre-industrial?
AR4 estimates of mean sea level rise are notable for excluding the contribution made by the mass loss of polar ice sheets. Will the IPCC rectify this in the forthcoming AR5?
Given that mass loss from both the WAIS and GIS are accelerating and already exceed some modeling, how confident can one be of the prognosis that mean sea level will rise by no more than a maximum of 1.5 metres this century?
How does mean sea level rise this century predicted in this article compare with the certainty of a 2°C average global temperature rise and the possibility of a 4°C-6°C rise before 2100?
Two points:
(1)
"A draft version of the next report from the IPCC (AR5), due for publication in 2014, was recently leaked. Although the information is subject to change, the draft report says sea levels are likely to rise by between 29 and 82 centimeters by the end of the century, (compared to 18-59 centimeters in the 2007 report)."
- this is comparing apples with oranges. There are at least three differences in the ways in which each of these projections were derived: (a) the "18-59 centimetres" quoted for the 2007 report does not include an adjustment of 0-0.17 m for "scaled-up ice sheet discharge" which accounts for dynamic land-ice processes not otherwise simulated by the glaciological models, (b) the periods are different (roughly 1990-2095 for the 2007 projections and 1995-2090 for the AR5) and the "emission scenarios" are different (as indicated in the article; the highest "scenarios" being A1FI for the 2007 projections and RCP8.5 for the AR5). All these differences need to be taken into account before a meaningful comparison can be made.
(2) The "in the pipeline" effect is predominantly due to the fact that a substantial proportion of the greenhouse gases that we emit stay in the atmosphere for a very long time (millennia). So it's as if we've turned up the heating to our house and left it on "high" - the house (and the Earth) takes a long time to come into equilibrium with this enhanced level of heating (e.g. the oceans have to warm and land-ice melts).
@Agnostic - "Given this statement should we now be observing global mean sea level ~1.6 metres above the pre-industrial?"
AINE, but no, not yet. "Next few centuries" is a somewhat vague term, and the bulk of our CO2 excess and temperature increase are both relatively recent (another vague term). For example, from two charts that Google found for me, in 1900 our world total yearly emissions were about 2Gt CO2-equivalent, 4Gt in 1930, 8Gt in 1960, and 16Gt in 1975 (this is eyeball addition of developing and developed). 25Gt in 2000, and 32Gt in 2010. So, roughly, doubling every 30 years, but with a special bonus kick from 1960-1975.
Charts:
Developed and developing CO2e
World wide CO2
Also worth noting is that the thermal mass of the oceans is incomprehensibly large. After a discussion on Slashdot I went and did the math carefully -- if the ice caps could all be dumped into the ocean and melted (but not raised to room temperature) it would cool them by only 2 degrees C. And I really do mean "incomprehensible" -- my gut gives no guidance for those quantities, I really do need to just follow the math. I think that is one thing that helps climate-skepticism to persist -- my gut, and probably most other people's, simply says "no way, that can't be right." But simple physics and arithmetic says it is.
(12) That sea level rise is for every degree that the sea warms. The 0.8 degree warming we have seen so far is in the atmosphere. Because of it's inertia, the huge sensible heat of water and the huge volume involved, it will take quite a while to see a degree warming in the sea.
It should be noted that there are a few basic assumptions involved in the RCP4.5 assumption:
1. (Saviour Technology) CO2 carbon capture from coal plants will be implemented and emissions will be held steady state after 2035 with reduced emissions even during population growth after 2035. Current projections hold China to emit 180 GT of carbon by 2100.
2. Arctic sea ice loss rates will (magically) slow and then stop before summer seas become ice free in the arctic until after 2065 (projections around 2085) allowing for much less global albedo change and keeping summer arctic temperatures closer to the 20-year average.
3. Magically slower Arctic sea ice loss rates allow for a much slower arctic permafrost melt and associated natural emissions feedbacks.
4. Thermohaline current continues at only a very slightly decreased intensity, allowing for continued significant natural CO2 sink in the North Sea.
5. Boreal forests and boreal peat do not significantly contribute to natural emissions.
6. Greenland and Western Antarctic ice loss rates do not rise significantly due to natural feedbacks and the lack of saviour technology (CCS) to halt emissions.
7. Amazon forest carbon sequestration continues at current rates.
8. Climate forcing is consistent with a 2XCO2 sensitivity of 2.3 and not 4.3 'C per doubling of CO2 (Arctic Summmer sea ice free by 2030 scenario).
9. Natural methane sources do not increase significantly due to magically slow arctic sea ice loss.
as long as those assumptions hold true then we can stay within the RCP 4.5 scenario as well as expect only 1Metre of Sea level rise by 2100. Otherwise, the scenario is closer to 6-8C of average warming by 2100 with closer to 5Metres of sea level rise.
William @ 15 ... "That sea level rise is for every degree that the sea warms".
Really? Then why is this not stated in the article?
Thank you jja @ 16 - that explains everthing!
jja @16.
I don't know if your 5m SLR by 2100 was a "throw-away" but I it is rather too high. While such a figure does appear in the lieterature, from Jim Hansen no less, do note that within Hansen & Sato 2011, the 5m rise is argued from the admitted position of it being "an improbable outlier." And the proposed non-linear solution from Hansen & Sato just makes matters worse as it requires an impossible 300mm SLR p.a. for the end of the century.
To achieve 5m SLR by 2100, indeed to achieve rates of SLR much above 20mm p.a. does require some explanation as to how the ice and the heat get together. To melt enough ice to achieve 50mm SLR p.a. would require roughly 5 ZJ p.a. which is not far from the entire energy imbalance today at the TOA. Sure the imbalance could get bigger in future decades but to expect more than 10-20% of it to get to the poles to melt ice? That does require explaining.
There is one mechanism that readily springs to mind. Ice bergs would work. They don't even need to melt to cause SLR, and bobbing round the tropics would get them to the heat as well as increasing the TOA imbalance so making more 'heat' available. But such ice berg speculation does require an answer to the question as to the source of these ice bergs because 5m of ice berg-induced SLR requires almost 2 million cu km of ice berg. That's a lot of ice.
jja @ 16
Use of the RCP 4.5 scenario as the basis for this SLR projection is indeed questionable. Emissions data indicate we are continuing right along the “business as usual” pathway towards some 900 ppm CO2 plus several hundred additional ppm in CO2 equivalents from other GHGs, by 2100. I have yet to see any significant indications that we will deviate much from this path. Any discussion of projected SLR should surely use the “business as usual” scenario as the basic starting point.
@MA Rodger #19 The ORAS4 OHC anomaly graph that I've seen shows an increase of 13.7 ZJ p.a. from 2000-2010. Why is this not being used as the current warming rather than the ~5 ZJ p.a. that "everybody" seems to be using ? Also, that graph shows a 50 ZJ cooling for Mt Pinatubo over 1 year in 1992. I think the OHC warming descriptions past & future need to be split into two quantities (with and without volcanoes) for two purposes because cooling from volcanoes is a statistical probability so needs factoring in for some deliberations, but S.B. factored out when comparing OHC anomaly with the radiative imbalance that mostly causes it.
grindupBaker @21.
(OHC is straying off the topic of SLR somewhat, mind.) The 13ZJ p.a. from ORAS4 isn't the current rate which is more like ~8 ZJ p.a. and so not far off the ~6 ZJ p.a. of Levitus 0-2000m. And why not use ORAS4 in preference to Levitus? ORSA4 is too new? It's not a direct measurement system? It stops at 2010? You will have to ask a proper user.
MA Rodger @19
If arctic sea ice dissappears by 2030 on June 1st and there is a 4.3 (or so) temp response to 2XCO2 and we continue with BAU emissions so that continued warming increases natural emissions of GHG from boreal forests and peat as well as producing a step-change increases in methane emissions from boreal terresterial and sub-sea permafrost AND this happens under a regime of constant declines in Natural carbon sink capacities so that the AF goes from 42% to 80% by 2100,( LINK )
In this scenario, what do you suppose is the Global average temperature above pre-industrial levels?
[RH] Shortened link.
jja @23/
My query @19 was specifically aimed at you comment suggesting 5m SLR by 2100 - SLR by 2100 being the topic of the post.
The question you ask concerning temperature rise - the RCP scenarios were derived to allow answers to such questions although not perhaps covering the circumstances you present @23. Obtaining such answers for the RCPs is not a trivial task and so neither is your question.
And I'm not entirely sure why you link to Terenzi& Khatiwala 2009 as it argues against the concept of CO2 feedbacks being apparent within recent observed trends in Af. I would add that these 'observed trends' do result entirely from an assumption they make ("For this experiment, we consider fossil-fuel and industry emissions only, setting emissions due to land use changes to zero.") which I feel is misplaced. Although, saying that, I am holding a watching brief on the present annual increases in atmospheric CO2 which seem to me suddenly higher than previously for an ENSO neutral period (average 2.8ppm pa for the last 6 months).
Based on paleoclimate evidence, Hansen concludes that global SLR could exceed 5m. by 2100. He says this would occur if polar ice mass loss were to double each decade of the 21st century. Since 2000 polar ice mass loss well in excess of decadal doubling has occurred and is continuing to accelerate, particularly in the Arctic where temperature amplification is over x2 average global surface temperature rise. Hansens analysis is consistent with the present rate of SLR (~3.2mm/yr) rising steadily to ~3 cm/yr by 2050 and continuing to rise to ~ 40 cm/yr by 2100.
More cautious scientists persist, often uncritically, with the IPCC “consensus” that total SLR in the order of 80 cm by 2100 is the likely outcome. This stands in stark contrast with a possible 5 metre global SLR by 2100.
The difference between the two estimates is so great and the implications so devastating were the latter to occur, that the need for reassessment and a more detailed analysis of all factors likely to contribute to SLR is surely justified, particularly for soundly based policy formulation.
Should we be satisfied with the current IPCC prognosis when it appear to be at odds with actual and expected development of factors which contribute to SLR? Is SkS satisfied with its position of virtual endorsement of the IPCC position?
Agnostic @25
Why do you seem to assume anyone at SkepticalScience is "satisfied" with the last IPCC projections? Obviously, as the rate of sea-leve rise is at the upper bounder of those projections no reasonable person would be "satisfied" with them. The scientists surely aren't "satisfied" with those projections, and the IPCC is surely aware it has to work to improve them. Obviously, scientists are trying to understand what is happening, and new understandings have been reported in the scientific literature since the last IPCC report. The next report will incorporate this new understanding.
You say that "more cautious scientists persist, often uncritically, with the IPCC 'consensus'", but surely that is a bit unfair. Is that kind of caution bad and uncritical if it is used because their research needs to be grounded on some kind of widely understood baseline? I don't know which scientists you are referring to, but I suspect most scientists who use the IPCC projections to underlay their own research do so because that is only logical. As an agnostic, you may like to make up your rules as you go along, but it seems to me that most scientists can't indulge in that kind of hubris in pursuing their research. The exception would be the scientists whose research is looking to better project future trends by improving the models. And even they understandably treat the IPCC projections with respect; they are just trying to improve them.
I' also dislike the tone of your final sentence in which you say the SkepticalScience position is one of "virtual endorsement of the IPCC position." SkepticalScience has put up a number of posts about the new science which has been published since the last IPCC report that will inform the next IPCC "position," and most of these posts have drawn attention to the fact that the last IPCC round of projections on future sea-level rise and Arctic ice melt projections are too low. I dare say this is a concern to most of us, as well as many if not most climate scientists, and the IPCC too. That said, like or not, the IPCC is the official international organization that is putting out periodic reports on the state of our understanding of climate change and climate science. It will put out its new reports over the next couple of years, I believe, and we will see what they show.
Agnostic - Hansen says that 5m could happen, not that it would: I consider that statement a cautionary tale about exponential growth, rather than a prediction. Too many people expect (against the math of acceleration) that 3.2mm/year will continue for the 21st century, and Hansen was pointing out with a rather extreme example why that is silly.
Agnostic @25.
You are wrong to say "Based on paleoclimate evidence, Hansen concludes that global SLR could exceed 5m. by 2100."
Hansen & Sato 2011 (and apoligies that my link @19 was to Hansen et al 2011 and not as intended to Hansen & Sato 2011,) refers in turn to Hansen 2007 where it is plain that the doubling period assumed (ie 10 years) was purely a "quantitative example" and not evidentially based, saying "Of course I cannot prove that my choice of a ten-year doubling time for nonlinear response is accurate, but I am confident that it provides a far better estimate than a linear response for the ice sheet component of sea level rise under BAU forcing."
In Hansen & Sato 2011, the GRACE data from Greenland & Antractica is used to support a short doubling period for ice cap melting although with the rider that "These data records are too short to provide a reliable evaluation of the doubling time." This probably remains the case even though we can today add 3 years-worth of data to the data available to Hansen & Sato 2011. (See here for Greenland - usually 2 clicks to download your attachment) Non-linearity is now more apparent but to conclude that the doubling is every decade and will continue so up to 2100 remains a step too far (if not two steps).
The paleoclimate evidence does show very convincingly that small increases in global temperature will result in very large SLR. The paleoclimate evidence does not show the rate of SLR we should expect. My own reasons for dismissing a 5m SLR by 2100 are laid out @19.
MA Rodger @24
my comments @23 was a restatement of 16 and in response to you @19 when you said, "To melt enough ice to achieve 50mm SLR p.a. would require roughly 5 ZJ p.a. which is not far from the entire energy imbalance today at the TOA"
question: (are you sure your math is right here?) There are approximately 2,712,096,000 seconds between now and 2100 and the TOA is about 1.7W/m^2 at the tropopause (5.14E14m^2) which yields about 2.35 X 10^24 joules of total extra energy between now and 2100 at current TOA) or 2,350 Zj at todays imbalance.
in my scenario above I was showing that even without carbon feedbacks, the expected AF was going to go to .8 which means that additional increases in emissions will contribute significantly more to the atmospheric burden than the same incremental emissions in past years. Even without the feedbacks that I had mentioned in 23.
With the feedbacks that I am mentioning in 23 the TOA will be closer to 5 W/m^2 by 2100 and may be as high as 7.5. This is without a potentially catastrophic arctic methane release. In addition, the arctic albedo change will produce a direct heating of the greenland ice sheet. Finally, using the correct ECS value of 4.3 not 2.3 we will find an atmospheric warming effect that will produce average global temperatures of closer to 8 C by 2100. This is, still, without arctic catastrophic methane release.
In this enviornment we can easily see 5M of sea level rise, or even 21 meters if ice shelf collapse occurs.
jja @29.
I gave up on my arithmetic decades ago. However I use the following conversion between global energy imbalance in ZJ pa & W/m^2:- 1 ZJ pa = 0.062 W/m^2. So with one exception, I am in accordance with your calculation in the second paragraph @29.
I do take exeption to your value for the TOA imbalance. It looks like you have used the figure (or more correctly 'a figure' as it is not well defined) for the "present" net anthropogenic forcing, that is the change in such forcing since pre-industrial times. As that forcing has now resulted in significant warming (thus increasing outgoing radiation), the remaining imbalance is a smaller value. That value is given by Hansen & Sato as 0.58 W/m^2 for 2005-10 (although this is another figure that is not well defined) which would thus equal 9 ZJ pa. (The annual change in OHC would comprise the majority of this figure and can be used to add a certain robustness to the value. Adding 10% to the 0-2000m figure to account for warming below 2000m and a further 10% for surface/atmospheric warming, and so using Levitus (graphed here) over the last half decade, that yields 7.5 * 1.2 = 9ZJ pa. That's spooky!)
From the bottom paragraph of the PIOMAS page, the energy required to melt 1 cu km of ice can be obtained and so to melt 360 cu km & produce 1mm SLR requires 0.109 ZJ. THus energy to melt ice for 50mm SLR = 5.5 ZJ significantly more than half the global imbalance derived above.
I'm afraid that the numbers you present within the following paragraphs @29 are not at all to my liking. The 80%AF by 2100 which you appear to take from fig 5 of Terenzi& Khatiwala 2009 is entirely bizarre. I don't even recognise the AF data prior to 2005 in that graph and given the other 2100 values derived within the paper, explanation is surely required for such a high value. And within the paper, the derivation of the 80% remains undiscussed outside section 4.2 which tends to rather deflate its usefulness.
The "TOA" numbers (again) look like forcing not imbalance. ECS (4.3 and 2.3 are both currently valid estimates) is not required for the calculation of future global imbalance. Imbalance is a matter of how much of the forcing is equalised by increasing temperatures, not per se the actual temperature required to achieve equalisation. Factoring in fast feedbacks (reduced arctic albedo) extend the life of the imbalance rather than increase the imbalance. Slow feedbacks which would include CO2 emissions from melting permafrost and hydrate methane ("Slow feedbacks?" some might ask.) are less easily accounted for but being themselves subject to speculation perhaps take this far enough off to make such lengthy discussion off topic.
Heaping worst case upon worst case does have its limits. If anthropogenic forcings are increased high enough, we will surely reach a point where 5m SLR pa is possible. But I would suggest that with such a level of forcing/imbalance, SLR would not be a primary bringer of doom.
The one caviat here is the mass launching of ice bergs (your final factor) which do not need to melt to create SLR, but that 'speculation' should revolve around potential sources of such a launching.
jja, you stated "Current projections hold China to emit 180 GT of carbon by 2100"..
Is that annually,? Do you have a reference??
It ain't gonna happen, but I'd like to see where it came from: that number is both atrocious
and .... totally beyond the capacity of the biosphere to deal with.
.
@davidnewell #31 That would be the total carbon emissions of China projected at 2100. 1 ppmv CO2 = 2.13263 Gt carbon (I compute) so that would be 84 ppmv CO2 as China's contribution. I seem to recall China is now neck & neck with USA at ~1.6 Gt carbon p.a., but that's a hazy memory I have.
davidnewell @31 & grindupBaker @32.
The CDIAC estimates for China's 2011 CO2 emissions is 2.48 GtC. Such a rate of emissions would total 217 GtC over the period 2014-2100 although its impact on atmospheric levels would have to be reduced by the Af (which wasn't employed @32). CDIAC put China not neck-and-neck with USA but head-and-shoulders ahead (US 2011 estimate is 1.47 GtC), although these two remain the big beasts with a big gap down to the next biggest - India 3rd (0.62 GtC) & Russia 4th (0.46 GtC).
MA Rodger – Thank you for your comment @ 28 in which you note that … “The paleoclimate evidence does show very convincingly that small increases in global temperature will result in very large SLR”.
It does indeed – but that very large SLR is likely to come from rapid loss of land based ice so it would seem that heat does get to polar ice causing mass loss, or the ice sheets are much more responsive to polar amplified temperature than hitherto thought is this a wrong assumption?
After crafting a lengthy response and then having it lost due to time out of login status I will summarize.
@davidnewell I am sorry, the 180 GTco2 was not 2100 it was 2050 here: figure 38 China LBL 2050 emission
MA Rogers @30
Thank you for showing me that, I do not exactly grasp the difference between the measured energy imbalance and the RF value, they should be the same in my mind. What am I missing?
The value I used was indeed RF values not energy imbalance. If I use your math and Hansen & Sotos value of .75 (they adjust for the solar minimum) I get a value of (7.5 * .75/.58) * 1.2 which is equal to 11.6 ZJ p.a. this will make a total earth cumulative energy imbalance of 1,000 ZJ by 2100 (86 years) If even a few of the non-linear feedbacks are taken into account and a higher (more realistic) emission scenario is used then the value of energy imbalance by 2100 could easily be 4-6X the current value. Therefore the total cumulative energy by 2100 will be closer to 3,000 +2,000/-1,000 ZJ . This will increase if I used the slightly higher values of Balmaseda, Trenberth & Kallen
In addition, if the ECS value is 4.3 then surface warming will be greater and the proportion of heat transferred by convection to land-based ice will increase.
The AF is discussed in Terenzi & Khatiwala here:
Yes, with a more rapid loss of arctic sea ice, the increase in boreal emissions and the potential for collapse of natural carbon sinks will incrase the AF even greater, couple this with a more realistic emissions scenario and 5 or even 21 M of SLR by 2100 will be barely noticed by a loose group of remnant humanity living hand to mouth for basic survival.
a bit OT:
When I look at the first curve above (http://www.skepticalscience.com//pics/CSIRO-92-13-sea-level-rise.JPG) then a perhaps interesting idea arises and I hope I am reasoning correctly:
You observe an increase in SL in the last years more than the "red" trend. Having said this and knowing about the "standstill" of global temperature during more than the last decade, this seems to be a good explanation that the heat of the sun went to the ocean more than before (which needs an oceanographic explanation - what I do not know). The only doubt which arises is that the timeperiod of this "steep" rise is only 3-4 years whereas the "standstill" of global temperature is about 10-15 years ... Maybe we find here somebody who has an explanation .... :)
Thus the typical argument of the denialists is kind of falsified by experimental evidence which I think is an important issue.
Agnostic @34.
Indeed. Small increases in global temperature will result in very large SLR. And yes, the cause will be due to melting of land ice from Greenland & Antarctica. So the question is - how "rapid" or how slowly will that melt occur? Or how big will be the "heat" flows in that melting process?
The total global energy imbalance gives a value for the energy entering the global climate system. Polar amplification may suggest that a disproportionate amount of that energy is arriving at the poles but (1) That is not entirely the same as energy available for melting land ice (although it will be in part), and further (2) The vast majority of the global energy imbalance ends up heating oceans and thus not into melting ice. This suggests that the energy available to melt Greenland & Antarctica can only be a minority of the global energy imbalance. And small energy fluxes has to mean small melts and small resulting SLR.
I have yet to see anyone describing how an energy flux can be created large enough to melt enough ice for anything like a 5m SLR by 2100. The literature still shows findings that project sub-1m SLR although they are usually not entirely reassuring in these findings. The Ice2Sea project, for instance, tells us that with a 3.5ºC global temperature increase (A1B emissions), the total SLR contribution from land ice will be 350mm to 368mm by 2100 (so a 700mm total SLR) but but do not rule out higher SLR (5% chance of +840mm SLR from ice) saying "even the state-of-the-art models do not simulate all the processes and feedbacks that might be significant." Perhaps more reassuring is Pfeffer et al 2008 who find that 2100 SLR greater than 2m is "physically untenable."
Myself, I see it that however large the 2100 SLR proves to be, it is less the problem in itself. Rather the rate of SLR by 2100 will set the SLR for the following century when SLR greater than 2m probably will no longer be "physically untenable." And if global temperatures remain high SLR will continue at that rate for many more centuries to come.
jja @35.
Concerning radiative forcing and energy imbalance. The difference is actually rather great. For instance Hansen et al 2012 the discussion of energy imbalance and net forcing leading to their conclusion "Measured Earth energy imbalance, +0.58 W/m2 during 2005-2010, implies that the aerosol forcing is about -1.6 W/m2" and thus a net forcing of +1.4 W/m^2.
The crucial point is that radiative forcing is a change over a period (say 1750 to date) and is a theoretical quantity while energy imbalance applies to a particular point in time and is an actual physical phenomenon.
Its a bit like a kid kicking a ball along a road. The forcing, the kid's kicks, can be expressed as increases in speed imparted into the ball by his boot and can be added up over a period of time when he kicks the ball many times. This 'forcing' will always increase adding up with each kick (unless the kid kicks it backwards). The ball will usually be slowing due to air resistance etc and on its own will come to a halt in the gutter. But until that point it will have a speed along the road which in this analogy would represent the energy imbalance. (The distance along the road would perhaps represent temperature.)
The definition of "forcing" given by the IPCC is given here. The altitude it is attributed to (ie the tropopause) is less important than the concept that it is "with surface and tropospheric temperatures and state held fixed at the unperturbed values" (in the analogy, not accounting for the slowing of the ball due to air resistance etc).
MA Roger @37
you said, "I have yet to see anyone describe how an energy flux can be created large enough to melt enough ice for anything like 5M SLR."
You have also said (@19) that "To melt enough ice to achieve 50mm SLR p.a. would require roughly 5 ZJ p.a"
1. If 11/5 of total SLR is due to thermal expansion and not ice melt (probably closer to 1/3 ) and
2. We want to find how much ice would be needed to melt to raise sea level by 5M
and we use your assumptions then
5 ZJ (ice melt) = 5 CM sea level rise, 100ZJ (ice melt) = 1 M sea level rise, Target Sea Level rise = 4 M = 400 CM = 400ZJ (ice melt)
Current Energy imbalance according to Hansen and Soto is 11.6 ZJ per year
Total Energy imbalance from today to 2100 = current energy imbalance + Increased RF between now and 2100 = (11.6 ZJ per year (corresponding to .75W/m^2) + 46.4 ZJ per year to 69.6 ZJ per year) , (corresponing increased RF from now to 2100 of between 3 to 4.5 W/M^2 additional forcing)
Therefore the total energy imbalance at 2100 compared to today will be between 58ZJ per year and 81.2 ZJ per year.
These total energy imbalance values will yeild an average imbalance between now and 2100 of (approximately) 29 and 40.5 ZJ per year.
So, over an 86 year period, the total period extra energy absorbed by planet earth is between 2,494ZJ and 3,483 ZJ between now and 2100.
If Atmospheric temperature is increased to +7C by 2100 and Arctic amplification due to early summer sea ice loss occurs then the deposition of 400ZJ (conservative estimate) is certainly plausible.
compare with alternative calculation below, the
The value I used was indeed RF values not energy imbalance. If I use your math and Hansen & Sotos value of .75 (they adjust for the solar minimum) I get a value of (7.5 * .75/.58) * 1.2 which is equal to 11.6 ZJ p.a. this will make a total earth cumulative energy imbalance of 1,000 ZJ by 2100 (86 years) If even a few of the non-linear feedbacks are taken into account and a higher (more realistic) emission scenario is used then the value of energy imbalance by 2100 could easily be 4-6X the current value. Therefore the total cumulative energy by 2100 will be closer to 3,000 +2,000/-1,000 ZJ . This will increase if I used the slightly higher values of Balmaseda, Trenberth & Kallen
In addition, if the ECS value is 4.3 then surface warming will be greater and the proportion of heat transferred by convection to land-based ice will increase.
jja @39.
The 5ZJ for 50mm SLR was calculated @30 to be 5.5ZJ (rather than approximated @19). Of course this exrtra 10% energy requirement is minor but I mention it here for the sake of correctness.
I'm on board with your estimates down to the paragraph beginning "If Atmospheric temperature is increased to +7C by 2100..." Here we hit a profound problem. If global temperatures rise, the warmer world will radiate more energy back out into space and the energy imbalance will reduce. The larger that temperature increase, the greater the reduction in (inward) energy imbalance, this being accentuated if ECS is small (a situation that is quite fun when denialists try picking up on energy fluxes to support their fantasies). So to achieve 2,494 - 3,483 ZJ global energy flux to 2100 would require all surface warming to stop over that period.
A +7⁰C global temperature rise (above pre-industrial values) with ECS=4.3 would result in increased outward radiation of 5.3 W/m^2 or 86 ZJ pa. Subtracting this would make your 58 to 81.2 ZJ pa negative, although I would assume your +7⁰C was assuming long term positive feedbacks which are usually considered additonal to ECS.
Your final estimated values assume that energy imbalance will increase as additional RF accumulates. That is a big assumption. I would suggest that taking the rate of change of RF (ie ∆RF) as a proxy for energy imbalance may be a useful first assumption. Present levels of net RF are difficult to quantify but positive RF are better quantified with ∆RF = 0.043 W/m^2 pa over recent decades. Continuing at that rate would give an additional 3.7 W/m^2 by 2100. This does not provide a basis for projecting a significantly larger ∆RF over the coming century and thus no large increase in future energy imbalance can be inferred from such a consideration.
Thank several of you for correcting my misunderstanding of the aggregate production of CO2 by China, for the actual annual production by 2100.
I personally appreciate jja @ 16, interspersing his comments with "magical thinking" perjoratives.
It's one thing to be a chicken little "The sky is falling" alarmist: it's another to actually have the equivalent becoming manifest.
In regard to
" If global temperatures rise, the warmer world will radiate more energy back out into space and the energy imbalance will reduce"
being a salient response to a "+7C" increase by 2100...: well, I am speechless.
We must derive a doable "Direct Air Capture" technology.
davidnewell @ 41
Thank you for your comment. I am in complete agreement. it appears at even 350 is too high of a CO2 concentration for the long term. MA Roger's response to 7C was not intended to be a summary response to the circumstances of reality associated with a world-ending 7C of warming at 2100 (because we would then overshoot an additional 7C over the next 300 years after that).
His response was basically helping me with my math.
MA Rogers @ 40
Yes, cumulative delta RF is not a proxy for the integral of the TOA curve between t=0 to t=2100a That value is different due to longwave emissions, I understand that now.
you are therefore asserting that the current radiative imbalance will stay the same as temperature rises. I get it. I find this highly implausible as feedbacks (and anthro emission rates!) are non-linear, indicating a growing energy imbalance, even as temperatures increase.
I find it interesting that you can assert the outgoing radiative transfer value in 2100 with 7C of warming and assuming the CO2 forcing using an ECS of 4.3 Are you also including albedo and methane as well as NOx and SOx values in your computation? you came to a very precise value. Where did you develop the equation?
The potential for a 7C of warming in 2100 is remote. based on positive, non-linear feedbacks and a worst-case emissions and ECS scenario. In my estimation of 58-81.2ZJ p.a. I used a total 2100 RF imbalance calculated as 3.75 - 5.25 W/m^2 . This value was stated as RF but was estimated lower to provide conservatism in the calculation.
jja @42, MA Rodgers @40 did not claim that the TOA energy imbalance will stay constant (or near constant) as temperature rises. Rather, he claimed it would be approximately proportional to the rate of change of Forcing. The 2011 radiative forcing according to the GISS was 1.635 W/m^2. An increase to 6.5 W/m^2 by 2100 (RCP 6.5) requires a mean increase in radiative forcing of 0.055 W/m^2 per annum, or 30% greater than the current mean. For RCP 8.5 (ie, BAU), the mean annual increase is 0.077 W/m^2, or 80% greater than current levels. Thus MA Rodgers should be understood as claiming that the TOA energy imbalance forcing could almost double over the coming century with BAU, but is unlikely to do more than that.
An alternative approach to that used by MA Rodgers is to predict the TOA energy imbalance at time t, as equalling the Radiative Forcing at time t, minus the climate sensitivity factor times the change in GMST since the preindustrial era at time t. For a climate sensitivity to the doubling of CO2 of 3 C, the climate sensitivity factor is 0.8. Using the simplifying assumption that during periods of significant changes in forcing, temperatures approximate to the transient climate response, which is approximately 2/3rds of the equilibrium climate response, we have that the TOA energy imbalance equals 0.27 x the Radiative Forcing. That formula predicts a current TOA energy imbalance of 0.44 W/m^2, and a 2100 imbalance of 1.76 and 2.3 W/m^2 for RCP 6.5 and 8.5 respectively. The formula will become inaccurate when forcings cease to increase overtime.
It will be noted that both MA Rodgers and my formulas underpredict the current TOA energy imbalance. That is what we would expect at the end of a period in which RF has continued to rise, but temperatures have risen more slowly than predicted, a situation that will create a larger than expected TOA energy imbalance - which in turn will lead to faster near future temperature rises.
if 105 cubic kilometers of ice melt has the capability to raise sea levels 1 meter (Lakes Agassiz and Ojibway melts 8,400 y.b.p.) and the enthalpy of fusion of 1 km cubed of ice is derived from the following:
105 km^3 = 1.05 X 10^17 cm^3
.9167 g/cm^3 of ice = 9.63 X 10^16 g of ice = 9.63 X 10^13 Kg of ice
enthalpy of fusion of ice = 334 KJ/Kg
9.63 X 10^13 Kg of ice * 334 Kj/Kg = 32.14 Zj per meter of sea level rise due to ice melt.
Assume 1/3 of sea level rise is due to thermal expansion
3.3333 meters of sea level rise due to ice melt = 5 meters of total sea levle rise
energy deposition in landed ice = 32.14 ZJ * 3.3333 = 107.13 ZJ
so how does MA Roger get 100ZJ for only a 1M worth of sea level rise in @19?
and if the 107.13 X 10^21 Joules is all that is needed in total landed icemelt to raise sea levels by 5M (with 1.67M of rise due to thermal expansion) and the proportion of energy deposion is proportional to forcing and the final 2100 energy imbalance is 3.5 W/m^2.
(I am sorry but your calculation does not include increased ice melt due to convective forces in a warmed world as well as albedo-induced localized warming in an ice free summer arctic-dicrectly increasing arctic amplification above current proportional rates -affecting greenland- your calculation also doesn't appreciate the effect of a slowing Thermohaline circulation on the western antactic shelf (localized warming-shelf undercut and the potential for a shelf collapse similar to the late E-Tr rise- but we will neglect that)
Then the average TOA between now and 2100 is about 2.125 W/m^2 which is equal to 1.08375 x 10^15 W (surface of earth = 5.1 X 10^14 m^2)
multiply by seconds
=3600 seconds/hour *8760 hours/year *86 years = 2.71 x 10^9 seconds
1.08375 X 10 ^ 15 W * 2.71 X 10^9 seconds = 2.93923 X 10^24 Joules = 2,939 ZJ total cumulative energy imbalance between now and 2100 assuming current TOA is .75 and 2100 TOA is 3.5 W/m^2
any way you look at it, we cannot reasonably assume that sea levels will not rise by 5 meters under the scenarios that I presented in @ 16
correction to 105 cubic KM above - should be 360,000 cubic KM
with corrected math error the final energy deposition value per meter of sea level rise due to ice melt is ~110 ZJ per meter sea level rise (using above calc) or very close to MA Roger's 5 ZJ per 50mm rise @19.
so total energy deposition in ice to raise sea level by 3.333 is then calculated to be 367.4 ZJ, not the 107.13 quoted @43.
jja @44 & 45:
1) You have forgotten to allow for the fact that ice is not as dense as water. You need to calculate the volume of water needed to raise sea level, convert that to mass as water, and then determine the volume of ice needed generate that mass of water. Doing so increases the energy needed per meter of sea level gained from ice melt to 120 Zettajoules.
2) You also neglect the fact that the ice, once melted, warms further till it matches the temperature of the surrounding water. That requires additional energy. Further, as the melting of ice results in greater gains of sea level in the tropics than at the poles, the temperature gain is substantial. Using a conservative estimate of 10 C temperature gain increases the energy required to 135 Zettajoules per meter of sea level gain.
3) You are not entitled to assume thermal expansion is a constant 1/3 of the sea level rise due to melting ice. The sea level gain is constant for a given level of OHC gain (assuming similar distributions of the heat). Ergo the sea level gain from thermal expansion for the B2 scenario is 0.12 - 0.28 meters. Allowing the upper limit, you need to find 4.72 meters of sea level gain from ice melt for a 5 meter sea level rise, not 3.33.
4) Currently, OHC accounts for about 95% of energy gains at the Earth's surface, leaving 5% for temperature gains in atmosphere and soil, and the melting of ice. For any 5 meter sea level gain, you need the amount of excess energy absorbed by the melting of ice to increase by a factor of 10 or more. That, however, will reduce the energy gained by OHC, reducing significantly the sea level rise by thermal expansion.
5) Using my estimate of TOA energy balance for RCP 8.5 at 43 above, you have approximately 1.45 W/m^2 TOA energy imbalance averaged over 87 years with which to melt your ice. That estimate assumes that the TOA energy imbalance increases linearly from its current value, which is a generous assumption for you. That gives you 2000 Zettajoules to play with to melt your ice. That means you require over 30% of energy from the TOA energy imbalance to go into melting ice to get your 5 meter sea level rise.
That is not impossible. Ice rafting of sufficient magnitude could channel much of the oceans gain in heat content into melting ice. However, nearly all your ice melt must come from such rafting, and there is no plausible mechanism to launch that much ice (approximatly equivalent to 2/3rds of all the ice in Greenland) onto the ocean in just 100 years.
Energy considerations cannot by themselve disprove the possibility of a 5 meter sea level rise, but they do show that you require a number of very implausible conditions to obtain it.
Regardless of these considerations, however, I remain convinced that the past is the guide to the future. Such massive rates of sea level rise greatly outstrip anything seen in transitions from glacial to interglacial states. That is despite the fact that those transitions involved far more ice available to melt, and at far lower latitudes. Absent detailed mechanisms explaining how a more rapid melt could occur, and specific evidence suggesting those mechanisms will come into play (neither of which exist for rates of increase of sea level greater than 2 meters per century), suggestions of such rapid melts must be considered as implausible, unscientific and needlessly alarmist.
Tom Curtis
(first let me thank you for your responses and for challenging my math skills as well as my understanding!)
1. Agreed, intentionally left out as original calculation involved water not ice, this value was assumed negligible and within error estimates.
2. This is true, the rate of volume increase of water from 0C to 10C is less than from 10C to 20C. The amount of water volume compared to the total volume capacity of the world's oceans is also negligible so this value is insignificant (thought slightly negative)
3. B2 scenario is not part of the discussion we are looking at worst case (according to the scenarios I posted @ 16) A1F1 in AR4 is maximum of .41M thermal Expansion and AR5 is looking like RCP8.5 maximum of .38M of thermal expansion. AR5 RCP 8.5 expects a worst case scenario 2.5C warming by 2050 above 1880 levels and ~5C warming at 2100 above 1880 levels. In their scenarios they expect arctic sea ice to last to 2080. In my scenario, the arctic sea ice becomes summer-ice free by 2020 (june 21) and may 1 ice free by 2030. In RCP 8.5 this happens in 2080. Subsequently, I have a worst case scenario of temperatures 1.5C higher than the RCP 8.5 for 2050 and 2.5C for 2100. This earlier increase in global surface temperatures causes an exponential increase in OHC deposition (and ice melt!), leading to a tripling of total cumulative OHC energy deposion and resultant thermal expansion by 2100. 3X RCP 8.5 worst case scenario is 1.23M. My RCP worst case scenario is closer to 10.0 (see below).
4. This is the key. What percent of warming will contribute to ice melt and what will contribute to expansion. Fundamentally, the variance in projections of future TOA imbalance and cumulative energy deposition in the ecosphere between now and 2100 are the only key questions for sea level rise. If the cumulative energy deposition is much greater than projections then the energy balance can be 98% ocean and 2% else and still gain 5M of rise. The real issue is how much energy will be placed into the biosphere in the next 86 years.
5. Your estimate of TOA above implied a .44W/m^2, Hansen and Soto says it is probably closer to .63 +/- .15 but recent analysis by Trenberth would indicate an even greater value due to increased rates of OHC gains that were undervalued by Hansen and Soto. So a probable current TOA would be closer to .75 +/- .15 W/m^2.
your calculation stated that current values are .44 TOA and 1.63 RF increased linearly to an RCP 6.5 and 8.5 of 1.76 and 2.3 W/m^2 respectively. You state that a linear assumption is generous on your part. (conservatively assuming worst case).
My scenario assumes a significantly decreased global albedo in 2020 and a much cloudier winter arctic than now. It also assumes an exponential decline in SOx emissions beginning in 2050. These two factors alone account for over 2W/m^2 increased RF by 2070. So the linear TOA imbalance is actually a much less conservative estimate. I also expected a significant increase in anthropogenic fraction for CO2 abundance as natural carbon sinks collapse. So my analysis is actually an RCP 10.0
But still, using your linear analysis and only having an RCP 8.5 but having current imbalance as .75 not .44 we get a final imbalance of 3.65 and a similar average energy deposition to my calculation at the bottom of @44.
If, however we use a more accurate and advanced rate of arctic ice melt, as well as the other assumptions I provided in @16 you will see that the non-linear increases in RF beginning in 2020 and peaking around 2050 will front-load the rates of energy depostion leading to a much higher value than those calculated even in @44.
(correction to 3. above)
Subsequently, I have a worst case scenario of temperatures 1.5C higher than the RCP 8.5 worst case scenarios for 2050 and 2.5C for 2100. This earlier increase in global surface temperatures causes an exponential increase in OHC deposition (and ice melt!), leading to a tripling of total cumulative OHC energy deposion and resultant thermal expansion by 2100. 3X RCP 8.5 worst case scenario is 1.23M. My RCP worst case scenario is closer to 10.0 (see below).
jja @47 & 48, you may be seeking a worst case scenario, but you cannot just manufacture such scenarios from the whole clothe. For instance, using the RCP 8.5 forcings, and a transient climate response pegged to give a 4 C increase in temperature by 2050 as per your specification, and a equilibrium climate response of 4.5 (ie, the upper end of plausible values), the cumulative energy gain from the TOA energy imbalance from now till 2100 is 2110 Zettajoules. Thus my conservative estimate of midrange values is well within error of your "worst case" scenario. An "RCP 10.0 scenario" will only increase that to 3425 Zettajoules. In both cases, your 5 meter sea level rise requires far more than 5% of the energy stored in the system.
Further, thermal expansion of the ocean linearly correlates to increased temperature. The A2 scenario (approximately equivalent to the RPC 8.5 scenario) has an upper estimate for thermal expansion of 0.35 meters. Allowing for your greater temperature increase, that rises to 0.56 meters, well short of the 1.67 meters you assume. Therefore melting of ice must make up 4.44 meters of sea level in you 5 meter scenario. In consequence, your scenarios require the melting of the equivalent of 44% (RCP10) - 50% (RCP 8.5) by ice rafting in excess of that from normal melt and calving of icebergs. In total, you require the melting of the equivalent of 64% of Greenland's ice in just 90 years. Even your worst case scenarios do not make this plausible. You still require a well justified mechanism for such massive ice rafting.
Finally, you simply do not adress the issue of past precedents. The rate of sea level rise durring the transition from the last glacial to the holocene can be (very conservatively) estimated at 0.16 meters per century. With twice the mass of ice melted during that period than is currently available to melt from all ice sheets, and with the ice at lower latitudes and hence having a stronger ice albedo feedback, why did the ice melt so slow if you think a 5 meter sea level rise in less than a century is plausible? You are expecting 30 times the melt rate, and far more than that towards the end of the century. And you are expecting this with a weaker albedo feedback.
Tom Curtis @ 49
I am not manufacturing a worst case scenario from the clothe. The AR5 is fundamentally flawed due to unmodeled parametes (i.e. todays revelation that expected ocean acidification will lead to an additional .4C warming by 2100 due to DMS reductions and ice albedo positive feedbacks happening 6 decades before the current worst-case scenarios). Globally induced warming due to summer arctic sea ice loss will produce a non-linear behaviour in warming resulting in a step-change in warming prior to 2050. Hence the TCR is estimated higher for 2013-2050 than from 2050-2100. The ECS taken as a whole is higher for 2XCO2 than from 2XCO2 to 4XCO2. The carbon feedbacks listed in @16 coupled with the lack of CCS implementation and current projected global CO2 emissions produce a Carbon Burden of 1200PPMv by 2100. Methane burden will also increase significantly due to permafrost release and Stratospheric OH depletion increasing CH4 persistence.
These are all real and ocurring and not modeled under RCP 8.5
The 2110 ZJ figure that you determined was conservative due to non-frontloading of Arctic albedo as well as the fact that you start from a lower figure than the one determined using more accurate ARGO data by Trenberth. (TOA of .75 W/m^2). The primary driver of this change in the rate of energy accumulation is the albedo change produced by the Arctic sea ice melt.
The RCP 8.5 is the A1Fl scenario as far as I can read the emissions profiles, not A2
The RCP temperature response profile models a relative linear change in temperatures. The arctic albedo and associated carbon feedbacks beginning in 2020 and peaking in 2040 will produce a decidedly non-linear response. The front-loading of deposited energy and temperature increase will greatly increase the rate of OHC deposition in the early years. basically a doubling of current RCP 8.5 projections between now and 2050 and a quadrupuling between 2050 and 2100 from current scenarios.
The temperature rise from LGM (post dryas) to Holocene Climatic Optimum was approximately 4C and occurred in 2.5k.y.a. We are talking about a 4C rise in 170 years (post 1880). The reason it is different now is that we are at the tail end of a 10 k.y.a. interglacial. if you want to look at historical analogies, the closest I can find is the Ice shelf collapse that ocurred at the end of the Eemian interglacial 125,000 years ago.
The reason the ice albedo feedback calculation is different now is because the incremental annual change between 1982 and 2012 (and I project from 2012 to 2030) will provide as much global albedo shift as over 1,000 years of warming during the transition from the LGM toward the Holocene climate optimum.