


 Arguments
Software
Resources
Comments
The Consensus Project
Translations
About
Support
Arguments
Software
Resources
Comments
The Consensus Project
Translations
About
Support
![]()
![]()
![]()
![]()
![]()
![]()
![]()
![]()
![]()
![]()


![]()


Latest Posts
- Fact Brief - Is Antarctica gaining land ice?
- Simon Clark: The climate lies you'll hear this year
- Skeptical Science New Research for Week #17 2024
- Water is at the heart of farmers’ struggle to survive in Benin
- At a glance - The difference between weather and climate
- India makes a big bet on electric buses
- 2024 SkS Weekly Climate Change & Global Warming News Roundup #16
- EGU2024 - An intense week of joining sessions virtually
- Skeptical Science New Research for Week #16 2024
- How extreme was the Earth's temperature in 2023
- At a glance - Is the science settled?
- What is Mexico doing about climate change?
- 2024 SkS Weekly Climate Change & Global Warming News Roundup #15
- Fact Brief - Did global warming stop in 1998?
- Skeptical Science New Research for Week #15 2024
- EGU2024 - Picking and chosing sessions to attend virtually
- At a glance - The Pacific Decadal Oscillation (PDO) is not causing global warming
- Climate Adam: Is Global Warming Speeding Up?
- 2024 SkS Weekly Climate Change & Global Warming News Roundup #14
- Gigafact and Skeptical Science collaborate to create fact briefs
- Skeptical Science New Research for Week #14 2024
- How can I make my retirement plan climate-friendly?
- At a glance - Global warming and the El Niño Southern Oscillation
- A data scientist’s case for ‘cautious optimism’ about climate change
- 2024 SkS Weekly Climate Change & Global Warming News Roundup #13
- Skeptical Science New Research for Week #13 2024
- You can start applying for the American Climate Corps next month
- At a glance - Human fingerprints on climate change rule out natural cycles
- Want clean electricity? These are the overlooked elected officials who get to decide.
- 2024 SkS Weekly Climate Change & Global Warming News Roundup #12
Comment Search Results
Search for 97%
Comments matching the search 97%:
- Climate Adam: Is Global Warming Speeding Up?
MA Rodger at 17:19 PM on 12 April, 2024ubrew12,
Tamino subsequently posted an OP titled 'Accelerations' which features this NOAA adjusted data (the last two graphics) showing a pair of break-points in the rate of warming, 1976 & 2013, with the pre-2013 rate being quoted as +0.165ºC/decade and the post-2013 rate measuring a rather dramatic +0.4ºC/decade. But that said, there will be very big 'error bars' on that last value. Additionally Tamino's adjustments did result in 2023 temperature being increased (by +0.02ºC) which, given the cause of the "absolutely gobsmackingly bananas" 2023 temperatures remain unresolved, may be very wrong.
- Gigafact and Skeptical Science collaborate to create fact briefs
Joel_Huberman at 08:16 AM on 8 April, 2024I suspect the % of climate scientists agreeing that global warming is real and human-caused is now, in 2024, much closer to 100% than when the 97% measurement was made.
- Welcome to Skeptical Science
cookclimate at 09:28 AM on 4 April, 2024CO2 does not cause Earth’s climate change.
It is estimated that it will cost $62 trillion to eliminate fossil fuels, but eliminating fossil fuels will be a complete waste of our tax and corporate dollars, because it will not stop the warming. You can’t stop Mother Nature.
The IPCC (Intergovernmental Panel on Climate Change) frequently shows that temperature correlates with CO2 for the last 1,000 years as proof that CO2 is causing the warming. But if you extend that to the last 800,000 years, the temperature and CO2 lines do not correlate or fit (Figure 14 in Supplemental Data). If the lines don’t fit, then you must acquit CO2. CO2 is not guilty of causing climate change. CO2 does not control Earth’s temperature. The IPCC has not demonstrated any scientific evidence that CO2 controls Earth’s temperature (they only have unproven theories).
The facts:
• Earth is currently warming (it is still below the normal peak temperature).
• CO2 is increasing (it is above the normal CO2 peak).
• Earth’s current warming is being caused by a 1,470-year astronomical cycle.
The 1,470-year astronomical cycle warms the Earth for a couple of hundred years and melts ice sheets primarily in Greenland and the Arctic. It has repeated every 1,470-years for at least the last 50,000 years. It is normal that it would be happening again. It accelerates Earth’s rotation, stopping length of day increases (Figure 9). It warms the Earth. Based on historical data, the current warming should peak near the year 2060 and then it should start to cool.
For more information, see A 1,470-Year Astronomical Cycle and Its Effect on Earth’s Climate,
and Supplemental Data,
www.researchgate.net/publication/379431497_Supplemental_Data_for_A_1470-Year_Astronomical_Cycle_and_Its_Effect_on_Earth's_Climate#fullTextFileContent - Climate - the Movie: a hot mess of (c)old myths!
Eclectic at 08:59 AM on 4 April, 2024Jimsteele @97 / 98 :-
John Mason is quite correct, in that the SkS website is open to all-comers. And so, unsurprisingly, as you gaze around the threads, you will occasionally see comments by climate crackpots who have delusional unscientific fixations and who are impervious to reason and scientific facts ~ whereas, at the WUWT website, those sorts of commenters come in droves. (Indeed, they are the 95% majority there.)
But at SkS , you need to comply with the very reasonable rules of posting ~ and you should provide rational fact-based discussion, not pseudo-science & repetitive ranting.
Jimsteele, you have some serious work to do, to reconcile your self-contradictory statements.
- Climate - the Movie: a hot mess of (c)old myths!
jimsteele at 13:43 PM on 3 April, 2024
Eclectic, First the skin surface dynamics are essential. The skin surface is the only layer from which heat can leave the ocean.
Second It is your narrative that grossly incomplete! You make a totally unsubstantiated assertion that without CO2 the oceans would freeze. You totally ignore solar heating. However the heat flux into the ocean primarily happens due to tropical solar heating in the eastern oceans, where La Nina like conditions reduce cloud cover and increase solar heating. The ocean sub surface can trap heat but the skin surface cannot.
- Climate - the Movie: a hot mess of (c)old myths!
jimsteele at 06:07 AM on 3 April, 2024A Netherlands journalist, Maarten Keulemans, tried to denigrate Climate the Movie: The Cold Truth in about 50 tweets using much of the same arguments posted to here on SkepticalScience. I successfully debunked all of his arguments in 16 tweets (originally I intended 20) listed below, and so I was just honored with being interviewed for a Dutch TV segment regards how the Climate the Movie promotes vital scientific debate. Too often alarmists try to suppress debate with weak arguments or denigrating the opposition as deniers. However I doubt alarmists can refute any of my arguments, but I will gladly entertain your arguments.
1 Denigrating the Climate Reconstruction graph by Ljungqvist https://twitter.com/JimSteeleSkepti/status/1771929435366940908…
2 Keulemans' Medieval Warm Period lie https://twitter.com/JimSteeleSkepti/status/1771933673488789868…
3 Contamination of Instrumental by Urbanization https://twitter.com/JimSteeleSkepti/status/1771939656504062260…
4 The Best USA temperature Statistic! https://twitter.com/JimSteeleSkepti/status/1771947116631580724…
5 Ocean Warming Facts https://twitter.com/JimSteeleSkepti/status/1771957182407536940…
6 US Heat Waves https://twitter.com/JimSteeleSkepti/status/1771963700951527487…
7 It is the Sun Stupid! https://twitter.com/JimSteeleSkepti/status/1771977013576024282…
8 Alarmists know better than Nobel Prize Winners ! https://twitter.com/JimSteeleSkepti/status/1771987039631921454…
9 Wildfires: Liar Liar Keulemans' Pants on Fire https://twitter.com/JimSteeleSkepti/status/1772000151596572844…
10 The Dangers of CO2 Sequestration and CO2 Starvation https://twitter.com/JimSteeleSkepti/status/1772016867265380795
11 Models Running Hot! Keulemans Disgraceful attack on the most honest Dr John Christy! https://twitter.com/JimSteeleSkepti/status/1772081300884852829…
12 Keulemans’ Blustering Hurricane Fears
https://twitter.com/JimSteeleSkepti/status/1772319957042479298
13. Dishonestly Defining Natural Climate Factors
https://twitter.com/JimSteeleSkepti/status/1773395443864736058
14. Denying Antarctica’s Lack of Warming
https://twitter.com/JimSteeleSkepti/status/1773473481637957758
15. Misinformation on CO2’s Role in Warming Interglacials during our Ice Age.
https://twitter.com/JimSteeleSkepti/status/1773777313924297210
16. Science journalists vs grifting propagandists – Antarctica
https://twitter.com/JimSteeleSkepti/status/1774428539858907444 - Climate - the Movie: a hot mess of (c)old myths!
One Planet Only Forever at 02:21 AM on 2 April, 2024Two Dog @55,
I offer the following as an example of the incorrectness of your beliefs, and your apparent resistance to learning:
A combination of understood natural factors explain the 'blip' of warm global average surface temperatures in the early 1940s. That warm blip, along with the other aspects shared by others, especially nigelj, for your potential learning benefit, is a significant part of the total understanding of why there 'appeared to be no warming from 1940 to 1970 in spite of CO2 levels increasing'.
- Climate - the Movie: a hot mess of (c)old myths!
nigelj at 04:48 AM on 1 April, 2024Two Dog @41
"Finally, on the "cherry picking" of the 50s, 60s and 70s. I think its a fair point to pick 30 years out of 150 in this case. Indeed, the argument above is, as I understand it, that the main and dominant factor in the current warming is human GHG emissions. For that theory to hold, in any period where GHG emissions are increasing year on year, then only a few years "blip" in warming must presumably call the theory into question? (unless we can find another new and temporary factor like air pollution)"
The reason the temperature record has "blips" and is not a smooth line is because the trend is shaped by a combination of natural and human factors that have different effects. However the overall trend since the 1970s is warming. The known natural cycles and infuences can explain the short term blips of a couple of years or so, (eg el ninos) but not the 50 year overall warming trend since the 1970s. Sure there may be some undiscovered natural cycle that expalins the warming, but its very unlikely with chances of something like one in a million. And it would require falsifying the greenhouse effect which nobody has been able to do. Want to gamble the planets future on all that?
The flat period of temperatures around 1940- 1977, (or as OPOF points out it was really a period of reduced warming) coincides with the cooling effect of industrial aerosols during the period as CB points out. This is the period when acid rain emerged as a problem until these aerosols were filtered out in the 1980s.
However the flat period mid last century also coincided with a cool phase of the PDO cycle (an ocean cycle), a preponderance of weak el ninos, and flat solar activity after 1950 and a higher than normal level of volcanic activity. Literally all the natural factors were in a flat or cooling phase. In addition atmospheric concentrations of CO2 were not as high as presently, so it was easier for the other factors to suppress anthropogenic warming.
So for me this is all an adequate explanation of why temperatures were subdued in the middle of last century. Just my two cents worth. Not a scientist but I've followed the issues for years.
- Climate - the Movie: a hot mess of (c)old myths!
Bob Loblaw at 04:38 AM on 1 April, 2024It's also worth noting that the trend values OPOF is providing from the SkS Trend Calculator use 2σ ranges for the uncertainties.
...and if you look closely, none of the trends OPOF mentions are significantly different from 0. So, the "cooling from 1940 to 1970" is really "no significant warming [or cooling] from 1940 to 1970". To argue "cooling", you need to
- ignore the statistical significance of the linear fit
- choose your starting point carefully.
In comment 41, Two Dog makes the point "...then only a few years "blip" in warming must presumably call the theory into question? ". That depends on "the theory" being that CO2 is the only factor causing warming on an annual or several-year basis. As we've been pointing out, this is not "the theory" that climate science is working with.
Two Dog is making the classical logic failure that is discussed in the SkS Escalator.

In fact, Two Dog is also arguing with himself. On the one hand, he is arguing that climate science can't possibly know all factors that might be affecting global temperature, no matter how many factors they have already considered in the relevant scientific literature. And then on the other hand, he is criticizing climate science because any blip in temperature that is not explained solely using CO2 as the only factor "...must presumably call the theory into question?". The two positions he argues are mutually contradictory.
Unfortunately this is a common thing in "skeptical" arguments against well-supported climate science - mutually-contradictory (and often impossible) positions on the subject. It's like the Queen in Alice in Wonderland:
I daresay you haven't had much practice,' said the Queen. 'When I was your age, I always did it for half-an-hour a day. Why, sometimes I've believed as many as six impossible things before breakfast.
- Climate - the Movie: a hot mess of (c)old myths!
One Planet Only Forever at 02:54 AM on 1 April, 2024Regarding my comment @46,
Using the Start date of 1940 and End date of 1970 in the SkS temperature trend calculator does evaluate 30 years of data, 1940 through 1969. The period of 1940 to 1970, including 1970, is 31 years.
But that difference does not make a big difference.
- Climate - the Movie: a hot mess of (c)old myths!
One Planet Only Forever at 02:46 AM on 1 April, 2024Note regarding my comments @39 and @45,
In the SkS Temperature Trend calculator the evaluation of 30 years of data from 1940 through to, and including, 1970 is actually done using the End date 1971.
Note the following trends for full 30 year periods:
- 1940 to 1971 is -0.037 +-0.057 C/decade
- 1942 to 1973 is -0.018 +-0.055 C/decade
- 1943 to 1974 is -0.001 +-0.057 C/decade
- 1944 to 1975 is +0.003 +-0.056 C/decade
- 1945 to 1976 is +0.018 +-0.054 C/decade
- 1946 to 1977 is +0.022 +-0.053 C/decade
- Climate - the Movie: a hot mess of (c)old myths!
One Planet Only Forever at 02:26 AM on 1 April, 2024Two Dog @41,
Regarding your persistent belief in the mystery of the 30 years from 1940 to 1970 I will add the following to my attempt to help you with my comment @39.
The SkS Temperature Trend Calculator (link here - again) shows that the temperature trend from 1940 to 1970 was: GISTEMPv4 Trend: -0.043 +-0.052 C/decade. A little bit of investigation of that 30 year period exposes the following facts:
- trend for 1941 to 1970 was -0.038 +-0.063 C/decade
- trend for 1942 to 1970 was -0.026 +-0.066 C/decade
- trend for 1943 to 1970 was -0.021 +-0.070 C/decade
- trend for 1944 to 1970 was -0.013 +-0.074 C/decade
- trend for 1945 to 1970 was +0.009 +-0.075 C/decade
- trend for 1946 to 1970 was +0.025 +-0.078 C/decade
- trend for 1947 to 1970 was +0.026 +-0.083 C/decade
- trend for 1948 to 1970 was +0.032 +-0.090 C/decade
So, within that 30 year data set there appears to be a ‘mysterious or questionable’ trend of the temperature trends. The claim of cooling since 1940 becomes a claim of warming since 1945. What’s up with that?.
Note the following trends for 30 year periods:
- 1944 to 1974 is +0.006 +-0.060 C/decade
- 1945 to 1975 is +0.019 +-0.057 C/decade
- 1946 to 1976 is +0.029 +-0.055 C/decade
Based on your most recent comment, a better question for you to investigate appears to be: What is preventing you from improving your understanding of this issue?
- Climate - the Movie: a hot mess of (c)old myths!
One Planet Only Forever at 13:21 PM on 29 March, 2024Two Dog @32,
Bob Loblaw has provided a good response to your question about the lack of warming from 1940 to 1970. And Eclectic has posed good questions for you.
I have something to add that may help you better understand things.
The SkS Temperature Trend Calculator (link here) can be used to see that the temperature trend for the data set from 1940 to 1970 was indeed negative (GISTEMPv4 Trend: -0.043 +-0.052 C/decade). However, within that time period:
- trend for 1945 to 1965 was positive (+0.017 +-0.108 C/decade)
- trend for 1950 to 1960 was more positive (+0.126 +-0.302 C/decade)
What’s up with positive trends within a negative trend? You may notice that the 2sigma values are significantly higher for the shorter data sets. The 2 sigma for 1940 to 1970 is also quite high. So look at longer data sets.
- trend for 1935 to 1975 is -0.003 +-0.040 C/decade
- trend for 1925 to 1985 is +0.048 +-0.024 C/decade
Factors other than CO2 appear to be the cause of the negative trend for the 1940 to 1970 data set. But within that data set the trend of the temperature was still positive. What’s up with that? A significant part of the explanation is apparent in the Temperature Trend Calculator image for the longer data sets.
The temperatures from 1940 to 1947 can be seen to be unusually high. That set of unusually high temperatures needs to be explained, not the apparent lack of warming through the next 30 years compared to that ‘high set of values' (just like the ‘appearance of cooling for a period of time after 1998’ is explained by the explanation for the unusually high temperature in 1998 - also see the SkS myth/argument “Did global warming stop in 1998, 1995, 2002, 2007, 2010?” which could have included 1944)
I am sure if you put in some effort you could find a reliable source (perhaps you could find such information on this SkS website) that would effectively explain why the 1940 to 1947 set of years were unusually warm (warning: there is an explanation - nothing mysterious or magical happened - warming influence of increased CO2 still happened)
- Climate - the Movie: a hot mess of (c)old myths!
Two Dog at 04:55 AM on 29 March, 2024"One Planet Only Forever" - I get the point about "having some merit" but couldn't the "deniers" make the same case? i.e. that there are uncertainties in the man-made climate change narrative. One uncertainty that confuses me is why was there no global warming from about 1940-1970? Presumably CO2 was increasing over that period.
John Mason - not sure I understand the point. Over history there has been many cooling and warming factors that are observed by the temperature record but largely unexplained. How do we know this current warming is not, at least in part, one such warming period?
- Skeptical Science New Research for Week #12 2024
Paul Pukite at 07:41 AM on 22 March, 2024NigelJ mentioned "extreme marine heatwaves"
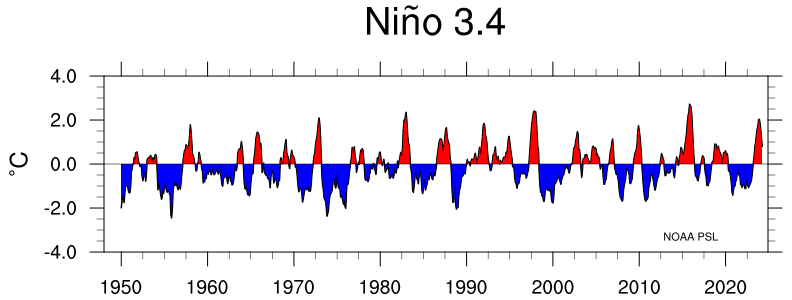
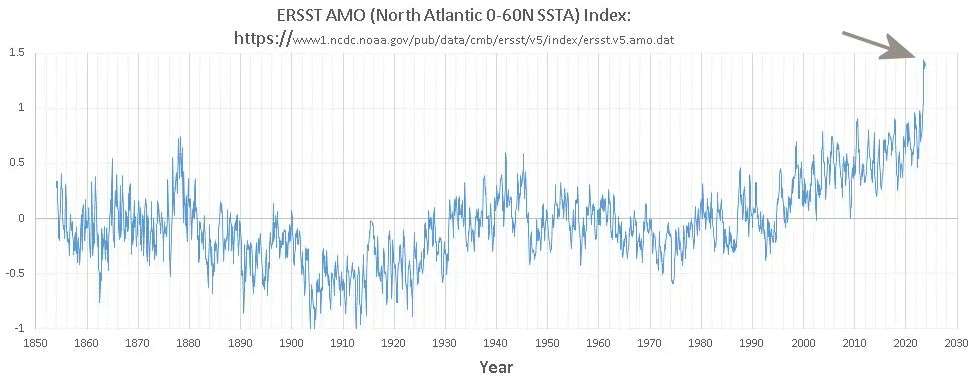
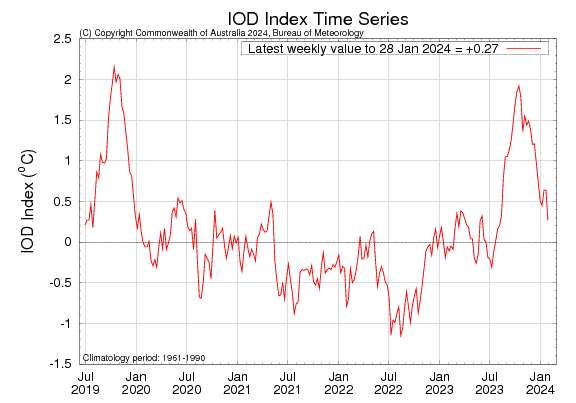
Heatwave spikes in the each of the major ocean basin indices — Pacific (Nino 3.4), Atlantic (AMO), and Indian (IOD). These are additive in terms of a global anomaly.
- It's a natural cycle
Paul Pukite at 06:55 AM on 22 March, 2024For the context of this thread, the important observation will be whether the anomalous global temperature rise of 2023 will recede back to "normal" levels. If that's the case, it will be categorized as a natural cycle.
So far it appears that there are simultaneous spikes in the temperature of 3 different ocean indices ENSO (Pacific), AMO (Atlantic), IOD (Indian). The last time that happened was in 1878, the year known for a super El Nino. Can see the 2 spikes in AMO for 1878 and 2023 in the following chart.
That holds interest to me in Minnesota in that this year's ice-out date for Lake Minnetonka almost broke the record for earliest date (in 1878 it occurred March 11, this year March 13)
https://www.usatoday.com/story/news/nation/2024/03/12/lake-minnetonka-ice-out/72941498007/
- The U.S. has never produced more energy than it does today
Paul Pukite at 10:18 AM on 21 March, 2024Energy use is outside the deep expertise of climate followers. Most don't appreciate that even though USA is the largest extractor of crude oil in the world, they still need a large fraction of imported oil. The USA only extracts <13 million barrels/day of crude oil from it's territory, yet the USA consumes 20 million/day of finished product. Compare that to a USA wheat crop where we harvest much more than we consume.
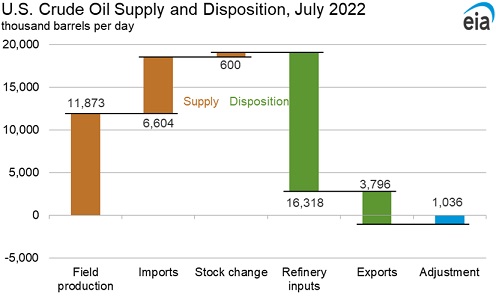
Note that the above is crude oil only, and other liquid fuels make up the amount to reach 20 million.
- CO2 is just a trace gas
Bob Loblaw at 06:13 AM on 2 March, 2024In addition to what OPOF says about ozone, it should be noted that ozone in the stratosphere is an important absorber of UV radiation as well. Not that absorption of UV radiation in the stratosphere causes any noticeable heating. Oh, wait. It does.

As for the errors in using % or ppm as a measure of CO2 quantities, I'll beat my own drum and point to this blog post from a couple of years ago.
- The promise of passive house design
AussiejB at 08:32 AM on 21 February, 2024I studied Archecture and while I did not finish my studies the house I desigened for my first house followed the principles of this article.
The second house built on the secondary dune on a beach north of Cairns in tropical Far North Queensland, Australia did not need airconditioning.
Flow through ventilation from the sea breezes cooled the house and the ceiling area.
Large over hanging roof lines ment that no thermal heat was absorbed by the house.
If I could do this in the early 1970's, we can do much better in the 20's, especially with the building materials available now with thermal insulation to mitigate heat gain in the tropics and subtropics or heat loss in cooler latitudes.
Good article I must add.
- Other planets are warming
One Planet Only Forever at 13:52 PM on 7 February, 2024I recommend a minor update to the first sentence of last paragraph of "Further Details".
"For lots of useful information about Pluto and the other dwarf planets, NASA has a useful resource on its website, including a link to Pluto: Facts."
And some interesting Pluto: Facts are quoted below:
- Pluto's 248-year-long, oval-shaped orbit can take it as far as 49.3 astronomical units (AU) from the Sun, and as close as 30 AU. (One AU is the mean distance between Earth and the Sun: about 93 million miles or 150 million kilometers.)
- From 1979 to 1999, Pluto was near perihelion, when it is closest to the Sun. During this time, Pluto was actually closer to the Sun than Neptune.
- When Pluto is close to the Sun, its surface ices sublimate (changing directly from solid to gas) and rise to temporarily form a thin atmosphere.
So, maybe Pluto would appear to warm rapidly during that orbit event ... but that would explain things in ways that climate science deniers, and the related delayers of harm reduction, would resist learning from.
- 2023's unexpected and unexplained warming
Daniel Bailey at 07:24 AM on 17 January, 2024cctpp85, one answer is that it's the difference between theory-based calculations (reanalysis products) and direct observations.
Parker 2016 - Reanalyses and Observations: What’s the Difference?
- At a glance - Is the CO2 effect saturated?
Just Dean at 09:44 AM on 11 January, 2024I think this is where data from paleoclimatology can help as well. Three recent studies have looked at the earth's temperature vs CO2 during the Cenozoic period, Rae et al., Honisch et al., and Tierney et al. . Each of those show that the temperature of ancient earth continues to rise as CO2 increases. As I understand it the first two are based solely on proxy data while the Tierney effort includes modeling to try and correlate the data geographically and temporally.
All of these are concerned with earth system sensitivities that include both short term climate responses plus slower feedback processes that can take millenia, e.g. growth and melting of continental ice sheets. Both Rae and Honisch include reference lines for 8 C / doubling of CO2. In both cases, almost all the data lie below those reference lines suggesting that 8 C / doubling is an upper bound or estimate of earth's equilibrium between temperature and CO2. Also notice that there quite is a bit of spread in the data.
In contrast, when Tierney et al. include modeling they get a much better correlation of T and CO2. They find that their data is best correlated with 8.2 C / doubling, r = 0.97. Again, this represents an equilibrium that can take millenia to achieve but does to my way of thinking represent "nature's equilibrium" between T and CO2.
In these comparisons, the researchers define changes in temperature relative to preindustrial conditions, CO2 = 280 ppm. For Tierney's correlation then on geological timescale, the temperature would increase by 8.2 C at 560 ppm. At our present value of 420 ppm there would be 3.7 C of apparent warming potential above our 1.1 C increase already achieved as of 2022, i.e., global warming in the pipeline if you will.
Bottom line, based on paleoclimatological data, there is no apparent saturation level of CO2.
- Skeptical Science New Research for Week #26 2023
MA Rodger at 21:14 PM on 2 January, 2024Just Dean @11,
I would not agree that the Holocene paper Osman et al (2021) co-authored by Tierney is the sole reason behind what has become the “Holocene temperature conundrum.” Other studies also found an absence of a Holocene Thermal Maximum, eg Kaufman et al (2020) or Bova et al (2021), or a very weak one, eg Kaufman & Broadman (2023), or regional differences, eg Cartapanis et al (2022).
Chen et al (2023) [ABSTRACT] characterises it as a model-proxy thing with these methods needing to sharpen their game if the conundrum is to be resolved.
- CO2 limits will harm the economy
One Planet Only Forever at 11:11 AM on 16 December, 2023PollutionMonster,
I agree that Jason Stanley's book, How Fascism Works, is recommended reading.
I recommended How Fascism Works, along with Timothy Snyder's book On Tyranny, in a comment I made in 2021 on a different SkS item, "The New Climate War by Michael E. Mann - our reviews". My comment there is @17 (linked here). Note that Bob Loblaw makes an additional excellent recommendation, for "The Authoritarians", on that comment string.
We are indeed in "Strange Daze" (Days misspelled intentionally) full of examples of trouble-makers succeeding in "Strange Ways". Maintain your focus on learning to be less harmful to others. And help others, including trying to help them learn to be less harmfully misled (admittedly you will encounter some Almost Lost Causes - People very deep into the delusions and fantasy beliefs of misinformation and disinformation).
- 2023 SkS Weekly Climate Change & Global Warming News Roundup #44
MA Rodger at 19:54 PM on 12 December, 2023Dessler's post does rather hedge its bets by suggesting it might be "due to natural variability persisting over an extended period" which will at some point come to an end (so as per the 2007-12 slowdown but in reverse). But he also points to the recent deep La Niña which may be amplifying the impact of the less-than-massive El Niño.
The ENSO indices do show the build-up to present weak El Niño conditions were unusually preceded by strong La Niña cinditions which had been, if anything, strengthening through the period rather than, as is usual, weakening as El Niño conditions approach. (The MEI perhaps shows this situation best.) Yet the big 1997-98 El Niño also strengthened quite suddenly and showed nothing like this 2023 bananas situation.
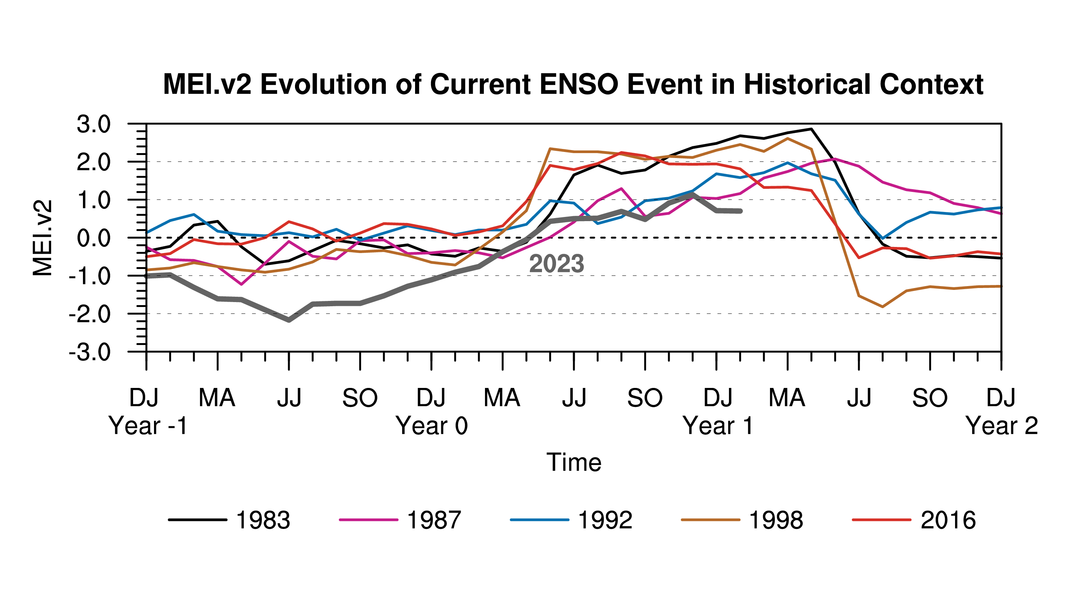
The bananas (sudden appearance of an additional +0.2ºC in the global average temperatures) won't be some sudden forcing as there is no sign of anything (or things) approaching the required force. That means we have a natural wobble.
But is that wobble reversing something that has been shielding the impacts of AGW and so it won't reverse? Or is going to abate in coming months/years? Dessler looks to the climate models as suggesting it is the latter. But the question is still an open one!!
- Most people don’t realize how much progress we’ve made on climate change
One Planet Only Forever at 07:41 AM on 7 December, 2023There is reason to continue to be skeptical regarding the rate of progress on the undeniable need for corrections of many ‘harmful popular profitable developments’ to limit the harm done to future generations by ‘most fortunate people’ today.
Things are undeniable worse today than they should have been. The following quote describes actions that caused less correction to occur than could have and should have happened.
“After years of inaction despite constant warnings from climate scientists, hopes had been high for a breakthrough in climate agreements in 2009, leading up to the U.N. summit — known as COP15 — in Copenhagen.
But just a few weeks before that event began, a hacker broke into a server at the University of East Anglia’s Climatic Research Unit and released a tranche of climate scientists’ stolen emails. Though there was no indication of wrongdoing in those emails, some phrases taken out of context, combined with the then-unusual nature of the public release of private email correspondence derailed the Copenhagen summit, which was ultimately widely considered a failure.
Climate science denial and policy obstruction thrived in the ensuing years (after the theft of East Anglia emails and misleading promotion of them prior to COP . That was exemplified by an incident in which then-Sen. James Inhofe, a Republican from Oklahoma, brought a snowball to the floor of the Senate in February 2015, because he apparently believed that winter snow proved that global warming was a hoax. (it doesn't)”
Inhofe was likely promoting a misleading marketing scam. And the ‘liking to benefit from making things as bad as can be gotten away with’ crowd is still at it today.
This recent NPR item “Oil firms are out in force at the climate talks. Here's how to decode their language” (linked here) exposes that those who resist harm reduction efforts rely on science, the science of misleading marketing. See the NPR item “U.N. climate talks head says "no science" backs ending fossil fuels. That's incorrect" (Linked here) which includes the following: “...al-Jaber responds to Robinson's suggestion with this incorrect statement: "I respect the science, and there is no science out there, or no scenario out there, that says that the phase-out of fossil fuel is what's going to achieve 1.5 [degrees Celsius]." That is my basis for stating that the beneficiaries of being more harmful ‘love the science ... of misleading marketing’.
As presented in the first NPR item the Oil (and gas) firms have developed misleading marketing abuses of the following terms (watch out for how they are abused):
- Low carbon and Lower carbon (no admission of the need to meet the Paris objective)
- Unabated fossil fuels (abated gets a free pass even if it isn’t a significant abatement)
- Net-zero (relies on the magic of actions that suck carbon out, or relies on the harm of their actions, providing fossil fuels that ‘other harmful people burn’, being perceived to be net-zero)
- Reliable. Affordable and ‘secure’ energy (questionable claims made using these terms – all dismissive of harm done.
The worst claims are the one about reducing perceptions of poverty - without mentioning that is accomplished via unsustainable and harmful actions – which means that no real reduction of poverty has occurred, just fleeting impressions that things have improved.
- At a glance - Evidence for global warming
Daniel Bailey at 06:20 AM on 6 December, 2023Yes, this is getting off-topic. Risking pushing the envelope, all ENSO phases are clearly warming, due to the underlying and overburdening human forcing of climate becoming increasingly pervasive. Perhaps a better thread can be suggested for such (but not here).

- At a glance - Evidence for global warming
One Planet Only Forever at 14:11 PM on 3 December, 2023Paul Pukite @23,
I will continue to pursue the points I raised regarding your comment @2.
I am confident that nigelj’s comment about similar trends was regarding ‘a trend like the global average surface temperature data - warming rather than cooling with more significant warming occurring after 1950 than prior to 1950’.
Your comment @2, and later comments except for your latest @23 (sort of), appear to insist that it is not possible to have confidence regarding a warming trend in the NINO 3.4 region (the middle of the equatorial Pacific).
Your comment @2 starts with:
"All these show a similar warming trend." [nigelj’s point]
Not the middle of the equatorial Pacific. (your response)
As my comments should indicate, I learned from and accepted nigelj’s finding of an explanation about the current models indicating a larger amount of warming in the equatorial Pacific (especially the east part) than the actual observations. However, as I commented, that does not alter the incorrectness of your comment @2. But you do appear to have finally accepted your incorrectness (sort of) by ‘seeing’ a warming trend in the NINO 3.4 SST data.
However, I am still confident that it is incorrect to declare that having confidence that ‘the NINO 3.4 SST historical data indicates warming similar to the global average surface temperature data’ requires an accurate explanation for the trend being lower than the current global climate models for that region and it requires that understood influence to be removed from the SST values.
The data is what it is regardless of the mechanisms producing it. Large variations of the temperature data simply requires a longer duration of the data set to have confidence that there is a warming trend. And a lower trend rate will also require a longer data set to establish confidence.
The NOAA presentation of the centered 30-year base periods (linked here) that I provided a link to in my comment @16 helpfully presents the trend of the SST NINO3.4 data set in spite of significant variations in the data values. Each 30-year period contains a substantial variety of the variation. Comparing the 5 year steps for the data starting in 1936 shows that there is indeed a recent trend (more significant after 1950 than before 1950 – consistent with the NINO3.4 chart you included in your comment @23). The 1966 to 1995 values, and all the more recent ones, are clearly warmer than the earlier ones. However, it also shows that the ENSO perturbations in the data are large enough to make the warming trend hard to be confident of, even appearing to potentially be a cooling trend in a shorter data set. The 1981 to 2010 results are not clearly warmer, and may even be cooler, than 1976 to 2005.
Global average surface temperature data evaluations using the SkS Temperature Trend Calculator (linked here) can also provide an example supporting my confidence that the ‘noise’ of ENSO variations do not need to be removed to be able to have confidence regarding a trend.
As I indicated in my comment @17, using the GISTEMPv4 dataset in the SkS Temperature Trend Calculator (linked here) the trend of the data after 1950 is 0.152+-0.018 C / decade (high confidence of a warming trend). I add the following set of shorter recent time periods and the resulting trend and level of confidence (2 sigma value compared to trend value):
Years Trend +- 2 sigma
2016 to 2023 = -0.148 +- 0.513
2015 to 2023 = -0.066 +- 0.428
2014 to 2023 = +0.074 +- 0.379
2013 to 2023 = +0.180 +- 0.331
2012 to 2023 = +0.244 +- 0.289
2011 to 2023 = +0.284 +- 0.249
2010 to 2023 = +0.262 +- 0.220
2005 to 2023 = +0.229 +- 0.129
The longer the time period is the more confidence there is in the evaluated trend. Admittedly the global average surface temperature variation in the evaluations is only about 2 degrees C. So a longer time period would be expected to be required for the NINO SST values because they have larger variation of temperature and a smaller trend. But confidence regarding the trend can still be established without a detailed understanding of the mechanisms at play. And I am confident that the authors of 2012 report you (mis)quoted in your comment @2 had reason to be confident with their evaluation and reporting (repeating part of the quote I had included in my comment @4)
“...While centennial trends are not assessed here, we note that using a reduced period results in more consistent linear trends in SSTs over the 61-year record (Fig. 1), which are significantly positive throughout the tropical Pacific Ocean.”
What the authors of the paper observed and explained, was that the pre-1950 data was not as reliable as the post-1950 data. And since the main interest is ‘warming similar’ to the global average surface temperature which has more significant warming since 1950 than before 1950, the earlier SST values are not that important.
- At a glance - Evidence for global warming
nigelj at 05:09 AM on 3 December, 2023OPOF & M Sweet. You guys sound correct in your technical analysis and correct that the equatorial part of the pacific ocean is warming (and I also thought the graphs posted by PP showed a slight warming after 1970). But the warming in a narrow band along the equator is at a significantly slower rate than the pacific ocean as a whole (roughly 0.2 compared to 0.6 in the maps in link I posted). The map posted by MS is a bit too large scale to pick up this level of detail and difference.
This basic pattern is important, and the explanation seems quite good. I think that is the main point.
- At a glance - Evidence for global warming
nigelj at 05:44 AM on 2 December, 2023I don't think PP is a denialist. Have seen his comments at RC. We sometimes just get on edge and jump to the conclusion that anyone who says "flat trend" is a denialist because its a common denialist talking point.
We know the oceans as a whole have warmed considerably since the 1980s. But then you do have a few areas with cooling like the cold blob in the nothern atlantic.
I'm eyeballing Paul Pukete's graphs of the equatorial pacific and at best I can only see a very slight warming trend from around 1970 - 2022. I mean it does look flat or near flat, so I looked for an explanation and this is interesting. I have highlighted the main pargraphs only:. It seems to be consistent with what PP is saying.
Part of the Pacific Ocean Is Not Warming as Expected. Why? BY KEVIN KRAJICK |JUNE 24, 2019
State-of-the-art climate models predict that as a result of human-induced climate change, the surface of the Pacific Ocean should be warming — some parts more, some less, but all warming nonetheless. Indeed, most regions are acting as expected, with one key exception: what scientists call the equatorial cold tongue. This is a strip of relatively cool water stretching along the equator from Peru into the western Pacific, across quarter of the earth’s circumference. It is produced by equatorial trade winds that blow from east to west, piling up warm surface water in the west Pacific, and also pushing surface water away from the equator itself. This makes way for colder waters to well up from the depths, creating the cold tongue.
Climate models of global warming — computerized simulations of what various parts of the earth are expected to do in reaction to rising greenhouse gases — say that the equatorial cold tongue, along with other regions, should have started warming decades ago, and should still be warming now. But the cold tongue has remained stubbornly cold.
Why are the state-of-the-art climate models out of line with what we are seeing?
Well, they’ve been out of line for decades. This is not a new problem. In this paper, we think we’ve finally found out the reason why. Through multiple model generations, climate models have simulated cold tongues that are too cold and which extend too far west. There is also spuriously warm water immediately to the south of the model cold tongues, instead of cool waters that extend all the way to the cold coastal upwelling regions west of Peru and Chile. These over-developed cold tongues in the models lead to equatorial environments that have too high relative humidity and too low wind speeds. These make the sea surface temperature very sensitive to rising greenhouse gases. Hence the model cold tongues warm a lot over the past decades. In the real world, the sensitivity is lower and, in fact, some of heat added by rising greenhouse gases is offset by the upwelling of cool water from below. Thus the real-world cold tongue warms less than the waters over the tropical west Pacific or off the equator to the north and south. This pattern of sea-surface temperature change then causes the trade winds to strengthen, which lifts the cold subsurface water upward, further cooling the cold tongue.
news.climate.columbia.edu/2019/06/24/pacific-ocean-cold-tongue/
- 2023 SkS Weekly Climate Change & Global Warming News Roundup #44
MA Rodger at 10:04 AM on 11 November, 2023Just Dean @22,
My apologies for misreading your comment @20.
The climatology community do not generally spend their time awaiting monthly global temperature anomalies and (as in the kerfuffle with the so-called 'hiatus' a decade back) tend to react to issues after they have arisen; and then not very fluently. So in that regard Jason Box is an oddity.
Concerning the contribution of El Niño to 2023 global temperatures, it is true that there were stronger La Niña conditions in mid-2022 than there was in mid-1996 and particularly in mid-2014. Thus the change from a cooling La Niña would perhaps suggest more resulting warming in 2023. But the flip side of that is the La Niña conditions so far in 2023 being far weaker than 1997 & 2016 suggesting less resulting warming. (Note the 2009-10 El Niño also began from strong La Niña conditions in 2008.) The net effect for 2023 should then perhaps be 1997 or 2015-like. But they are not.
Thus I would suggest there is ample evidence from the global temperature record to indicate something with perhaps even more warming impact on global temperatures than the coming La Niña.
If the temperature rise (using ERA5 with assumed Nov/Dec 2023 anomalies as per @21) the global temperature rise through the first year and then the additional second year rise run as follows:-
1996-97 ... +0.12ºC ... ... 1997-98 ... +0.19ºC
2008-09 ... +0.13ºC ... ... 2009-10 ... +0.10ºC
2014-15 ... +0.15ºC ... ... 2015-16 ... +0.18ºC
2022-23 ... +0.30ºC ... ... 2023-24 ... +???ºC
Perhaps it would be worth setting out the same data for was the most powerful El Niño of recent decades. This was overwhelmed by the El Chichón eruption of April 1982 which resulted in a cooling in 1982:-
1981-82 ... -0.20ºC ... ... 1982-83 ... +0.19ºC
So perhaps the Jan 2022 Hunga Tonga eruption and its water vapour is acting as a booster for 2023. (I mentioned satellite data @21 supporting this contention. See th 6 min video from Andrew Dessler here. It's now 3 months old.)
- 2023 SkS Weekly Climate Change & Global Warming News Roundup #44
Just Dean at 23:36 PM on 10 November, 2023MA Rodger,
If you read my previous comment closely, you will see that I understand we are in the first year of an El Nino event. I am indeed comparing 2023 to 2015 or 1997.
If you look at the global temperature series referenced in Zeke's July 26 CarbonBrief article, you will saw-tooth like structures for both the 1998 and 2016 El Nino events. The total temperature excursion over the two years was about 0.3 C, with each year adding about 0.15 C. I realize that 2023 is extraordinary and might be closer to a jump of 0.2 or 0.25 C but we need to see how this year and 2024 play out. To quote Zeke from his 10/31 post on The Climate Brink, "It remains to be seen if we will see more exceptional warmth in the latter part of this year and early next as the El Nino event peaks or if this El Nino is behaving differently – potentially contributing more warming early on due to the rapid transition out of unusually persistent La Nina conditions – than we’ve seen in past events."
We are observers in an unfortunate global warming experiment. We will need wait to see how it unfolds. To my earlier point to Michael, Zeke is trying his best to interpret this in real time, and allowing us to look over his shoulder, basically giving updates on a weekly or biweekly basis. I am not aware of any other climate scientist that is sharing insight that frequently. Between Zeke, Mann and Hansen, I find Zeke to be the most moderate, consistent and coolheaded. Yes, I'm a fan.
- 2023 SkS Weekly Climate Change & Global Warming News Roundup #44
MA Rodger at 20:48 PM on 10 November, 2023Just Dean @20.
It is not correct to make a comparison of 2023 with El Niño years 1998 & 2016. We are in the first year of a 2023/24 El Niño and the earlier ones were 1997/98 and 2015/16. 2023 is not the El Niño year in which the temperatures jump.
(Using ERA5 numbers), if we assume the October anomalies coutinue for Nov/Dec, 2023 would show a record year averaging +0.16ºC above all previous years. 1998 & 2016 saw similar +0.15ºC & +0.18ºC respectively. But 2023 is not another 1998 or 2016. We would have to wait for 2024 to make a comparison with previous El Niño years. And the coming El Niño is not looking anything like 1998 or 2016. It is forecast to be "moderate El Niño event", so more like 2010.
That is why 2023 is being described as "Staggering. Unnerving. Mind-Boggling. Absolutely gobsmackingly bananas." The big question, which is yet to be answered, is 'Why?'
You'll be familiar with this graphic if you follow Jason Box. It well-explains the temperature rise 2014-2023 but it does not show anything that would explain the "staggering, unnerving, mind-boggling & absolutely gobsmackingly bananas" temperatures we've seen over the last five months.
(If you want to see how bananas, have a play on the UoMaine Climate Reanalyser and compare 2023 with previous years, then blank off 2016-23 and repeat for 'pre-El Niño' 2015. And again for 1997.)
My suggestion as to 'Why?' is that the Jan 2022 Hunga Tonga eruption which was exceptionally large and being sub-ocean blew large amounts of both SO2 and H2O into the stratosphere. These two would cancel each other out so the rather chilly 2022/23 winter (globally) with the SO2 marginally more powerful. But that SO2 has dropped out now and the remaining H2O is still there providing us the bananas. If this is the situation (& there is satellite data showing SO2 dropping out quicker than the H2O), the bananas do thankfully have a shelf-life.
- SkS Analogy 26 - Earth's Beating Hearts
Bob Loblaw at 11:19 AM on 10 November, 2023groovimus @2:
Congratulations. Your second post at SkS, and you've provided two incredibly bad arguments in a single paragraph.
First, you're making an "argument from incredulity" I can't believe that people are still making "I can't believe" types of arguments these days. [See how that works?]
Second, you're making an "it's only a trace" argument. Usually people that are making an "it's only a trace" argument are doing it with respect to CO2 concentrations. At least we should give you some points for originality - for making it about the mass of humans vs. the mass of the earth - but you're still only scoring 2-3 points out of 100. If you were really creative, you'd go onto the CO2 is a trace gas thread and tell us how the mass of CO2 is sooo small in comparison to the mass of the earth, instead of the usual comparison with the mass of the atmosphere alone. It would still be a completely bogus argument, but boy oh boy could you really throw around some huge ratios!
Also, you never did go back to follow up your first SkS comment, where you completely failed to provide any argument why anyone should listen to John F Clauser (the subject of the post you were supposed to be commenting on). All you had there was ad hominem rants and insults.
- 2023 SkS Weekly Climate Change & Global Warming News Roundup #44
MA Rodger at 21:23 PM on 8 November, 2023This Hansen et al (2023) paper was pre-published back in January and did result in a bit of discussion here at SkS. And there was supposed to be a second paper specifically on SLR.
Hansen et al rattle through a pile of stuff, some of which I would agree has merit and some which I find difficult to accept, some very difficult. The high ECS is one of the very difficult ones. (Perhaps the point that the big part of the difference between high ECS values and the IPCC's most likely value ECS=3ºC, [something the IPCC tend not to identify preferring a range of values as in AR6 Fig1.16]: the difference is due to warming that follows the forcing by a century or more. That time-lag is one of the reasons the ECS estimates are not better nailed down and still has its 'fat tail' . It also would give mankind a fighting chance of dodging it.)
SLR is certainly a big subject of concern. It is a long-term problem, multi-century. The equilibrium position for a +1.5ºC is perhaps 3m and the threat of setting Greenland into unstoppable meltdown at higher levels of warming would triple that. I do tend to get irked by the SLR by 2100 being the sole subject of discussion.
Of course, predictions of that 2100 SLR being massive (5m) is one of Hansen's foibles. The worry is, I think, specific to Antarctica and it is a genuine worry. But to achieve 5m by 2100 would need massive numbers of icebergs bobbing around in the southern oceans and result in global cooling. And there is also the awkward point for climatologists that increased snowfall over Greenland/Antarctica could provide a significant reversal of SLR.
The final issue raised by Hansen et al (2023) is the impact of the reduction of aerosols from our falling SO2 emissions. Quantifying the impact of SO2 emissions is not entirely global a thing, so emissions in, say, China may induce more cooling than, say, Europe. But that said, global SO2 emissions data I identify tends to be way out-of-date. The most recent is this one from a Green Peace publication. This shows the reduction in SO2 is well in hand over the last decade. And the CERES data showing EEI does show a drop in albedo (yellow trace in the 2nd graphic) through that period. My own view of these CERES numbers is that they include a lot of bog-standard AGW-feedback-at-work.


There is also the last 5 months of crazy global temperatures (so post-dating Hansen et al's pre-publication). I don't see these as being sign of things to come. I'd suggest it is casued by the January 2022 Hunga Tonga eruption which threw both SO2 and H2O into the stratosphere, the cooling SO2 dropping out leaving the warming H2O to do its thing before eventually it too dropping out.
And the in-the-pipeline thing. Climatology is/has-been saying we need to halve CO2 emissions b 2030, and following the point of net zero in mid century we enter a century-plus of net-negative CO2 emissions. That would see all emissions 2008 to year-of-net-zero removed by human hand and stored away safely. So that is on top of the natural draw-down of CO2 into the oceans. And if we don't do that, it will not be from ignorance of the situation.
- New report has terrific news for the climate
One Planet Only Forever at 03:06 AM on 22 October, 2023Fred Torssander,
In addition to the helpful responses by MA Rogers and nigelj, I offer another perspective regarding the question you ask @3:
How can we know that government action, external governing of the socioeconomic-political marketplace rather than simply allowing marketplace game players the freedom to believe and do whatever they want, has resulted in reduced harm?
This can be particularly challenging if pursuers of benefit from harmful actions deliberately develop and disseminate disinformation and misinformation.
How much less harmful are things today, or will things be in the future, due to policy actions? A more important question not asked by people asking that question is: How much more harmful are things due to a lack of development and implementation of effective harm reduction actions – especially the lack of effective limitations on the ‘freedom to benefit from developing and disseminating disinformation and misinformation’?”
A good example of this problem is NPR’s recent, well researched and presented (and long and detailed), reporting (in parallel with efforts by the regarding the efforts to cast doubt on the science regarding harm done by gas stoves “How gas utilities used tobacco tactics to avoid gas stove regulations”.
Essentially, the understanding is that "...industry-backed reports confused consumers and muddied the science that regulators relied on about the potential dangers of cooking with gas, according to an investigation by NPR and documents uncovered in a new report from the Climate Investigations Center (CIC), a research and watchdog group." And that can happen regarding climate change impact reduction efforts.
The section of the NPR reporting “How Gas Utilities followed the tobacco strategy” presents ways that science can be harmfully biased by the pursuit of money (the American Gas Association – AGA – referred to its pursuit of popular support for gas use in homes as “Operation Attack”). As mentioned in the article “the AGA was hiring researchers who previously accepted research funding from tobacco companies”.
A particularly enlightening part of the NPR article is
“Ralph Mitchell of Battelle Laboratories conducted work for the tobacco industry and had sought funding for research from Philip Morris in 1964 and the Cigar Research Council in 1972. Mitchell and colleagues at Battelle and the Ohio State University reexamined earlier studies that concluded there were health problems linked to use of gas stoves. Using an alternative, and in some cases controversial, analysis technique, Mitchell's team found "no significant difference in reported respiratory illness between the members of households cooking with gas and those cooking with electricity."
None of the authors of the 1974 Battelle paper are alive today to answer questions about their work.
"The research in question occurred nearly 50 years ago, and it would be inappropriate to speculate on the researchers' methods or conclusions," said Benjamin Johnson, spokesman for Ohio State, in an email to NPR. A Battelle spokesman offered a similar statement and wrote that the organization "conducts research that conforms to the strictest standards of integrity."”
It is challenging to ‘conclusively prove the harm reduction of a policy action’. The only ‘certain way to eliminate doubt about the benefits of harm reduction actions’ is to have a parallel planet where the only difference is the action in question with monitoring for a long enough period of time to be highly confident of the ‘measurable differences’. Without that ‘impossible proof’ any suggested harm reduction action is open to the ‘raising of doubt about its merits’. Of course, there is also an inability to be certain about the benefits of actions that are potentially harmful ... but the potential perception of personal benefit can tragically over-power the ability to learn to be less harmful and more helpful.
An obvious problem is the ways that disinformation and misinformation efforts can unjustifiably raise questions about the effectiveness of ‘likely very effective harm reduction actions’, especially when ‘perceived benefits’ have to be given up to reduce the damage being done, or when being less harmful requires more effort or is more expensive.
- 2nd law of thermodynamics contradicts greenhouse theory
Eclectic at 14:46 PM on 28 September, 2023Sorry, Likeitwarm @1597 . . . but the Miskolczi "paper" proves no such thing. His "constant infrared optical depth" ideas are junk science.
Rob Honeycutt is pointing you in the right direction. Look inside yourself and ask why you choose to cherrypick these disproven ideas originating from a few - a very small handful - of "contrarian scientists". That is the question for you . . . if you are brave enough to face yourself in the mirror.
Let me hasten to add : AFAIK the good Dr Miskolczi may well be a nice guy and kind to children & animals. And AFAIK, lawyers would not consider him legally insane . . . but he is delusional about this area of climate physics.
Sadly, Likeitwarm, there's a small number of scientists who are simply delusional. It's a quirk of their personality, a crazy streak. But that is no reason for you to be sucked in by them.
- 2nd law of thermodynamics contradicts greenhouse theory
Likeitwarm at 04:38 AM on 28 September, 2023Sysop, Thank you for allowing this conversation with scaddenp and myself to continue.
1562 scaddenp
You said "What I am asking is whether you can remember what switched you into looking for sites like CO2Science or temperature.global? Was it just disbelief about trace gases or were there other considerations?"
I've been thinking about an answer for you.
I started looking into "global warming" back in the mid 2000s, 25 years ago,
I think with this site https://www.geocraft.com/WVFossils/ice_ages.html.
Many other places and books since then.
I find a lot, 1000s or more, of scientists that disagree with AGW.
One is Nasif Nahle who has calculated the emissivity of CO2 at less than .003 and and says that it doesn't absorb or emit much if any IR. You can see his calculations at https://jennifermarohasy.com/2011/03/total-emissivity-of-the-earth-and-atmospheric-carbon-dioxide/
Then there is the Club Of Rome, a bunch of rich elitists that think they know best for the rest of us. Back in 1968-1974 they decided they needed a scare tactic to get people to reduce births, thus reducing the population of the earth and the resources used by them. They settled on AGW because CO2 is emitted when fossil fuels are burned. Reduce the available energy and you will reduce the birth rate.
The U.N. IPCC was not charged with finding out what makes the climate change but rather how to pin it on human causes. See https://shalemag.com/manmade-global-warming-the-story-the-reality/ and https://principia-scientific.com/the-club-of-rome-and-rise-of-predictive-modelling-mafia/
UN’s Top Climate Official: Goal Is To ‘Intentionally Transform the Economic Development Model’
https://www.investors.com/politics/editorials/climate-change-scare-tool-to-destroy-capitalism/
You see, the goal was not to save us all from overheating the planet or acidifying the oceans. The goal was to scare everyone into giving up cheap fossil fuels.
I don't know what the goal of you and your colleagues at Skeptical Science is but I do know you can create logic and equations to describe anything, so I remain skeptical of your site.
Now you know where I'm coming from. See www.ourwoods.org.
Cheers - 2023 SkS Weekly Climate Change & Global Warming News Roundup #38
nigelj at 16:56 PM on 25 September, 2023Just Dean
Regarding Hannah Ritchies video. I read the main points that she made in her video. Her points were basically that infant mortality is much lower than 300 years ago, poverty has come down, we have made some progess with wind and solar power, coal fired power is declining, and levels of deforestation have generally stopped and environmental pollution in America has fallen (despite economic growth). All worthy points to make and a good counter to the doom and gloom.
Other writers have put a positive spin on human progress such as Seven Pinker in Enlightenment Now and Michael Shermer in The Moral Arc and IMO both books make good points.
However economic growth has a good and bad side. The good side is obvious, but the article did point out the bad side. I don't agree with all the points it made, but economic growth has been a prime contributer of deforestation and its a bit naive to think it can continue indefinitely without causing more deforestation. There is also depletion of the worlds fisheries. Economic growth is also generally accepted to be one of the prime causes of mineral resource depletion (along with population growth) that is on track to leave future generations short of basic materials. Economic growth has been one prime cause of pollution in the development phase of many societies. While its possible to have economic growth and keep pollution at moderate levels as America shows, a necessary condition is a strong rule of law absent in many countries and America ( and other developed countries) is not exactly free of all pollution.
It therefore looks like it would be very difficult and perhaps impossible to have indefinite economic growth based around resource extraction and processing and also have a sustainable environment, and also maintain ever expanding wealth. It is also hard to see how such economic growth would be maintained indefinitely if we are using up finite resources. So it looks like economic growth may fall naturally over time all other things being equal. Economic growth rates have been falling in developed countries since the 1970s anyway.
Japan has had relatively minimal economic growth over the last 30 years but has maintained a good standard of living. So once countries reach a certain level of wealth it looks like we could have zero or near zero economic growth and maintain a good standard of living.
However the commentary seemed to call for a more rapid and deliberately planned end to economic growth. This might face difficulties because our entire financial system is based on debt finance reliant on at least some economic growth to pay off the debt. If economic growth was abruptly switched off for good banks would not be able to make loans.
Any governmnet brave enough to have a policy of zero economic growth (easily achieved through monetary policy) might find the entire business sector waging war against them along with a large part of the population. A zero growth world would probably require large modifications to how capitalism operates and this should be possible but doesn't look like it would be rapidly achieved. It seems more likely to me that economic growth will slow and stop of its own accord due to emerging resource scarcity, demographic changes, etc,etc.
Its very hard and slow turning large ships around.
- It's cosmic rays
MA Rodger at 21:33 PM on 22 September, 2023sailingfree @120/121,
The H. Svensmark input into AGW science has been in general seen as entirely overblown unless you are in denial about AGW when the idea that the sun plays a much bigger role than the climatology shows is usually seen as supportive of their denialism.
Svensmark first published a cosmic ray climate effect back in 1997 demonstrating a remarkable fit between cosmic rays and global cloud cover. The fit proved to be spurious while experiment has demonstrated the causal link between cosmic rays and cloud formation to be very very weak. Undeterred by these setbacks, Svensmark has since been examining the detail of the cosmic ray/cloudiness relationship in an attempt to show there was a climatic effect after all.
Part of this analysis by Svensmark homed-in on Forbush Decreases, a phenomenon identified back in the mid-1900s and today catalogued at an average rate of over 100 events per year. A relationship bewteen these Forbush Decreases and changes in cloud had been observed back in the 1990s.
Svenmark first published on this phenomenon back in 2009. They used the most energetic Forbush Decreases (just 26 over 21 years) to produce a correlation between peak cloudiness and the Forbush Decrease strength (Fig 2- not entirely convincingly) and plotting the averages of cosmic ray evolution and average cloudiness evolution for the five most energetic Forbush Decrease events (Fig 1) although the reason for showing the averaging of these five alone is not evident to me in this paper.
Svensmark et al (2021) which you ask about is simply Svensmark et al (2009) but using a correlation with the CERES radiation data. The CERES data restricts analysis to post-2000 events and now only the 13 most energetic events are analysed for the correlation (fig 2) with event evolutions averaged from (again) the five strongest events (fig 1), this apparently because there is too much "dominant meteorological noise" if more events are included, although I'm not sure that squares up with the effect being climactically significant.
Of course, with the sun less active since SunSpotCycle 23, and thus presumably the cosmic rays increasing cloudiness which cools the climate, this would suggest that Svensmark's work would be implying amplification of the role of AGW rather than a diminution which denialists hope for. But such understanding may be a bit too involved for denialists to grasp.
- At a glance - Does cold weather disprove global warming?
scaddenp at 11:51 AM on 13 September, 2023Just to address the point, consider another cold country with frozen seas about it - Sweden. According to this -
"In the 1970s, three quarters of Swedish homes were heated with oil boilers. Today, electric-powered heat pumps have all but replaced oil in single-family homes (most multi-family homes rely on district heating). That has driven greenhouse gas emissions from oil heating of buildings down 95 per cent since 1990, according to the Swedish Energy Agency"
The difference is Sweden's willingness to act. A carbon tax in 1990 and revised building codes certainly helping. The very common district heating schemes also use waste heat and wood waste as well as GSHP.
- 2023 SkS Weekly Climate Change & Global Warming News Roundup #36
michael sweet at 03:21 AM on 10 September, 2023The Guardian had an article about Powis et al 2023. This paper shows that heat waves hot enough to kill humans will spread to many locations with 2C of warming. They use a lower wet bulb temperature of 31.5C where previous studies of extreme heat used 35C wet bulb . Recent studies have found the 31.5C wet bulb temperature is fatal without fans or AC.
I have not seen a similar article that discusses when agriculturatal animals like cattle and goats will begin to be killed by heat. Obviously it will be impossible to air condition pastures. If the heat cannot be withstood by animals even occasionally, it will be very difficult to keep animals in those areas. Imagine if they could not raise cattle in Texas for the entire summer!! At 2C warming large areas of the world are too hot for humans (and presumably agricultural animals) (sorry, I could not copy the diagrams showing where the heat would be too hot for humans)
Does anyone have a link for the threat of extreme heat to agricultural animals?
- John F. Clauser: the latest climate science-denying physicist
nigelj at 06:10 AM on 9 September, 2023Eclectic
"In comparison, Simon Michaux [referred to briefly in a different SkS thread, recently] does know what path we should be taking towards a wind-turbine & solar-panel powered economy . . . but says we cannot reach that goal, owing to inevitability of materials supply shortfalls. (We can't get there from here.)"
IMO Michaux is taking a very doomy, pessimistic approach to the materials issue. The crowd who wrote the limits to growth in around the 1970s were the same and proclaimed the world would run out of key metals like lead, zinc etc,etc, by the 1990s and of course that never happened. Lets explore why.
Now firstly obviously materials are a finite resource. Some of the elements are quite rare and so scattered in the crust they cant be extraced economically. Even the concentrated mineral despots of those elements are not common in the earths crust. So we have a problem and are at risk of running out of some things longer term.
But Michaux takes a particularly doomy view of the situation. He looks at known current high grade / medium grade reserves and says red alert we are running out. But he is basing his warnings on known reserves of good grade ore depoits. He makes insufficient allowance for our ingenuity in extracting low grade deposits, making new discoveries, mining the sea bed, extracting minerals from sea water (there are trillions of tons), high levels of recycling. And its highly likely we will get better at doing these things and in energy efficient ways.
Im not talking techno hype where anything is possible and we will conquer all problems. Im just taking the view that its very likely we will find ways of finding more materials.
If we do run into severe shortages of materials we will have to reduce our energy use. Michaux concerns do not seem a good enough reason to give up on renewables completely, and he doesnt provide an alternative if we did do that.
- It's cooling
CORK at 04:27 AM on 5 September, 2023Climate's changed beforeWhat bothers me in the "Escalator" is the time scale. From 1970 to 2022 the temperatures rise, yes.
But this is not incompatible with a cooling at geological time scales. We may be in a rising part of the curve which will go down and over several 1000s of years the average will show a cooling trend.
The scale of time can be used and the curves can defend both arguments. Therefore the "escalator" is of no use.
The only pure fact in all the climate change saga is that humans are producing greenhouse gasses.
From that fact a whole theory of climate has been built. It is very difficult to say things like that without being insulted today.
- 2023 SkS Weekly Climate Change & Global Warming News Roundup #34
nigelj at 06:59 AM on 28 August, 2023The retracted study made questionable claims that food production hasn't been affected by climate change. I came across this commentary recently, following a discussion on another website that suggests food production is already being negatively impacted by climate change:
Climate change is affecting crop yields and reducing global food supplies
Published: July 9, 2019 11.22pm NZST
Farmers are used to dealing with weather, but climate change is making it harder by altering temperature and rainfall patterns, as in this year’s unusually cool and wet spring in the central U.S. In a recently published study, I worked with other scientists to see whether climate change was measurably affecting crop productivity and global food security.
To analyze these questions, a team of researchers led by the University of Minnesota’s Institute on the Environment spent four years collecting information on crop productivity from around the world. We focused on the top 10 global crops that provide the bulk of consumable food calories: Maize (corn), rice, wheat, soybeans, oil palm, sugarcane, barley, rapeseed (canola), cassava and sorghum. Roughly 83 percent of consumable food calories come from just these 10 sources. Other than cassava and oil palm, all are important U.S. crops.
We found that climate change has affected yields in many places. Not all of the changes are negative: Some crop yields have increased in some locations. Overall, however, climate change is reducing global production of staples such as rice and wheat. And when we translated crop yields into consumable calories – the actual food on people’s plates – we found that climate change is already shrinking food supplies, particularly in food-insecure developing countries.......
theconversation.com/climate-change-is-affecting-crop-yields-and-reducing-global-food-supplies-118897
I wonder if Sky news have published the fact that the paper was retracted?
- Ice age predicted in the 70s
Bob Loblaw at 07:17 AM on 19 August, 2023MA Rodger @ 138:
Yes, this discussion is wandering off the blog post's topic. There is no way to determine Don Williamson's motives unless he explains them, but it appears that he is trying to do two things:
- Take Oreskes' paper out of context to make it look like the 1970s "cooling" story was an indicator of a huge shift in climate science [it wasn't] - I presume to discredit climatology as a science [he hasn't].
- Bootstrap the idea that "they don't know what they are talking about - they'll just make stuff up" by using the hiatus as an indicator that warming isn't linked to CO2 increases [he's wrong] and we might flip back into decades or centuries of cooling even if we burn every last bit of fossil fuels [we won't].
I have an off-topic challenge to Don that he has not yet responded to (review one example of the many "hiatus" papers he insinuates support him). I need to let him respond, if he is willing or able.
If the off-topic sound bites continue without responding to that challenge, I will probably need to bow out of the conversation and take on a moderator role.
- Ice age predicted in the 70s
MA Rodger at 00:33 AM on 19 August, 2023Don Williamson @133 & others,
Discussion of the early 21st century SAT/SST record is hardily on-topic for this comment thread. The handful of years showing a reduced rate of warming surface tempertures did not lead to a reversal of warming but to an increased rate of warming, so any linkage to 1970's ideas of a coming ice age is entirely absent, despite an attempted linkage @108 up-thread. (And for the record, the take-away from the SciAm article referenced @133 is the ascribed response fro 'researchers' to all the 'hiatus' nonsense:-
"Picking a period of a decade or so where one part of the Earth's climate system fails to warm and using it to discredit all of climate science is a fallacious argument, and one driven by those with an agenda to discredit climate scientists."
Don Williamson, you have up-thread referenced Oreskes in the discussion of the 1970's idea of a coming ice age and insist there is some missing argument that gives continuing credibility to this 1970's idea (which are also ideas of earlier times according to Oreskes. "Throughout most of the history of science, geologists and geophysicists believed that Earth history was characterized by progressive, steady, cooling.") Do note the referenced pre-print conference paper does not constitute proof of a 'missing argument'. And were one sought, perhaps Oreskes (2007) 'The scientific consensus on climate change: How do we know we're not wrong?' can provide it.
- Ice age predicted in the 70s
Bob Loblaw at 00:01 AM on 19 August, 2023As a further part of the challenge to Don:
You have referred to "the hiatus". I will repeat the graphic of the Escalator:
Since the topic of the OP here is "cooling in the 1970s", and The Escalator shows seven periods of "no warming", please be specific as to which of those seven periods represents "the hiatus" you are talking about. Or a different period, if you have found an eighth.
- Ice age predicted in the 70s
Eclectic at 10:39 AM on 17 August, 2023Don Williamson @123 and prior :
To put things in a more realistic perspective : the Ocean Heat Content continued to rise during the so-called Hiatus of atmospheric temperatures. So there was actually no real Hiatus ~ it was just an interesting talking-point. The globe was continuing to warm.
Yes, we can discuss "the hiatus" as an abstract concept or as a propaganda topic ~ but we are wasting our time if we tie ourselves into a pretzel trying to argue about consensus or scientific opinion regarding a physical non-event in overall global warming.
Propaganda point: Yes . . . a real scientific point: No
However, the 1945-1975 "cooling pause" was definitely real.
- Ice age predicted in the 70s
Rob Honeycutt at 04:09 AM on 17 August, 2023Don @120... The "dominant view" changed precisely because it became clear the planet had moved from a cooling period into a warming period.
You're clearly not grasping there is no inconsistency here. What Oreskes is discussing is how "contrarians" might pick up on this fact and utilize it to create doubt in the minds of the general public related to the critical nature of CO2 driven climate change.
It's not like before 1970 researchers thought CO2 played no role in climate. It's not like they didn't know atmospheric aerosols would cool the planet.
I think the difference here is related to changes in the earth's mean temperature and the cause of changes in the earth's mean temperature.
- Ice age predicted in the 70s
Rob Honeycutt at 23:58 PM on 16 August, 2023Also, Don... It was around the 1970's when there was some disagreement in the climate science community regarding whether the cooling effects of industrial aerosols or the underlying CO2 driven warming would dominate. At that point in time, there wasn't a strong consensus. It took additional study to convince the leading experts that CO2 was the larger, longer term problem.
The good news was that we, as a species, were able to substantively address the issue of industrial aerosols through the clean air acts in the US and similar regulations in other countries.
- Ice age predicted in the 70s
Rob Honeycutt at 12:51 PM on 16 August, 2023"Why not acknowledge the 'dominant view' was wrong and science coalesced into a new consensus?"
Don... This comment is exactly what I'm talking about. There was (and still currently is) a dominant view that the earth has been cooling for the past several thousand years. There was (and still currently is) a dominant view that the earth had been cooling from the 1940's up to about the early 1970's.
What she's saying is that "contrarians" might exploit these facts of science in order to seed doubt in the minds of the general public about the clear reality of CO2 driven global warming.
- Ice age predicted in the 70s
Rob Honeycutt at 05:01 AM on 16 August, 2023Don... I know Dr. Oreskes fairly well, and have had several one-on-one conversations with her in the past during AGU in SF.
I think perhaps you're misinterpreting what's being stated in this piece. Re-reading it myself, I wonder if you're thinking stating the dominant scientific view in the 1950's, 60's and into the 1970's was that the earth was cooling and would continue to do so. That would be an inaccurate interpretation.
Mid-century cooling was, and is, very well understood and accepted. There was some exploration at that time whether cooling or warming would dominate in the coming decades, but even then the dominant view was that it would likely be CO2 induced warming.
Famously, the renowned climate scientist Dr. Stephen Schneider, produced one paper suggesting that cooling due to global dimming from aerosol pollution was the bigger problem. Fairly soon, though, he also became convinced by the weight of evidence that the underlying warming from CO2 was the larger problem.
- Ice age predicted in the 70s
Don Williamson at 04:30 AM on 16 August, 2023To Rob Loblaw
I couldn't find any reference to MacDonald saying the dominant view of the 1950s to 1970s was a cooling climate in your wikipedia link. Perhaps you could demonstrate that it was his thoughts not hers. I can't really bend my brain into that logic without supporting documents. What have you found?
- Ice age predicted in the 70s
Bob Loblaw at 00:50 AM on 16 August, 2023Don:
That is a pretty short article by Oreskes, with very few references, and carries no date. It has a ucsd.edu email address (U California at San Diego). For her current Harvard web page, you can find a link to her CV, which tells us she was at UCSD from 1998 to 2013. So it is potentially a rather old article.
In the 1970s, there was indeed speculation that the observed cooling might continue, but the "Further reading" section of this rebuttal shows more detailed analysis of how much of the scientific literature believed it was likely (not much).
Also note that the title of the paper you link to includes "The work of Gordon J.F. MacDonald". Wikipedia has a page on Gordon J.F. MacDonald, and it is likely that Oreskes is summarizing the views of MacDonald rather than presenting her own detailed analysis. After all, she is a science historian. Also note that in her first paragraph, Oreskes states (emphasis added),
...not very long ago most earth scientists held the opposite view. They believed that Earth was cooling. Throughout most of the history of science, geologists and geophysicists believed that Earth history was characterized by progressive, steady, cooling
MacDonald was a geophysist, and according to the Wikipedia page he also was skeptical about continental drift/plate tectonics. The contrarian community is littered with geologists that have limited understanding of climate science.
I don't see this as an expression by Oreskes that she thought the "it's cooling" crowd had a legitimate argument.
- Ice age predicted in the 70s
Don Williamson at 23:40 PM on 15 August, 2023There was an article by Naomi Oreskes regarding the cooling climate dominant view of the 1950s to 1970s.
I was finally able to locate her work after months of research, I heard rumors about it but it turns out to be real.
It might advance the discussion if this is included in the consensus debate. It needs to be tackled head-on, what does Naomi Oresekes say about her previous paper?
- Wildfires are not caused by global warming
Scott at 02:48 AM on 31 July, 2023Eclectic @14 /Bob Loblaw @13 You are correct, I assumed the diagram was from the IPCC, it isn't, and the increase it shows has very little to do with global warming. In that respect it is extremely misleading. The area burnt by wild fires has been decreasing not increasing. You criticised this conclusion as being from 2016 - yet in a 2020 blog post by the Royal Society the authors of the paper were interviewed again to find out whether things have changed since its publication. The answer was basically no. "... when considering the total area burned at the global level, we are still not seeing an overall increase, but rather a decline over the last decades. This has been confirmed in a series of subsequent studies, using data up to 2017 or 2018."
royalsociety.org/blog/2020/10/global-trends-wildfire/
From: 'Large Variations in Southern Hemisphere Biomass Burning During the Last 650 Years' Z. Wang,1 J. Chappellaz,2 K. Park,1 J. E. Mak1 (Science Vol 330 17 December 2010)
"These observations and isotope mass balance model results imply that large variations in the degree of biomass burning in the Southern Hemisphere occurred during the last 650 years, with a decrease by about 50% in the 1600s, an increase of about 100% by the late 1800s, and another decrease by about 70% from the late 1800s to present day."
[For some reason images are not showing in the preview but the source is correct]
The same picture is repeated globally. In 'Climate and human influences on global biomass burning over the past two millennia' by J. R. MARLON et al. (Nature Geoscience 1, 697–702; published online: 21 September 2008), they measure sedimentary charcoal records spanning six continents to document trends in both natural and anthropogenic biomass burning for the past two millennia. From this they obtain the following graph - again showing a very clear 20th century decline.
All this begs the question of why there has been such an increase in fires in California.
"Autumn and winter Santa Ana wind (SAW)–driven wildfires play a substantial role in area burned and societal losses in southern California. Temperature during the event and antecedent precipitation in the week or month prior play a minor role in determining area burned. "
"Models explained 40 to 50% of area burned, with number of ignitions being the strongest variable. One hundred percent of SAW fires were human caused, and in the past decade, powerline failures have been the dominant cause. Future fire losses can be reduced by greater emphasis on maintenance of utility lines and attention to planning urban growth in ways that reduce the potential for powerline ignitions."
See 'Ignitions explain more than temperature or precipitation in driving Santa Ana wind fires' by Jon E. Keeley et al. Science Advances 21 Jul 2021 Vol 7, Issue 30
In 'Nexus between wildfire, climate change and population growth in California' by Jon E. Keeley and Alexandra D. Syphard (Fremontia vol 47 Issue 2 2020) is a detailed analysis of wildfires in California. A distinction is drawn between fuel dominated and wind dominated fires.
Population increase leading to urban expansion, accompanied by expansion of the electric power grid, increasing the chances of a powerline failure was a significant cause of wildfire. (The 2021 Dixie fire at 389,837 hectares was caused by a tree falling onto a powerline and could have been prevented had the power company acted promptly - see California Department of Forestry and Fire Protection, Investigation Report Case Number: 21CABTU009205-58). General poor maintenance by utilities has caused many wind dominated wildfires.
Fuel-dominated fires are mostly forest fires in lightly populated regions and so tend to result in less property damage. A century of fire suppression has led to a huge accumulation of fuel at ground level. As a result a low intensity surface fire can easily become a high intensity crown fire.
How 100 years of a misguided policy outlawing controlled burns has left California vulnerable to wild fires
www.theguardian.com/us-news/2019/nov/21/wildfire-prescribed-burns-california-native-americans
In conclusion, the total area burnt has been decreasing globally and in California where it has increased this is largely due to misguided policies of forest management and poorly maintained, overloaded power infrastructure. (Urban planning which doesn't adequately address fire hazard doesn't help either). I think linking wildfires to global warming is misguided and likely to backfire when it is revealled to be the least important factor.
- It's not urgent
PollutionMonster at 18:07 PM on 29 July, 2023I used the tactic of asking for a source rather then trying to debate an incoherent argument.
This seems very similar to the other arguments they make usually focusing on how expensive and infeasible renewable energy is. Certainly more subtle than other deniers who deny the 97% scientific consensus.
- How big is the “carbon fertilization effect”?
Bob Loblaw at 06:06 AM on 14 July, 2023Yes, Daniel, Mr Burton certainly is consistent in wandering off topic in his comments. At least in this case he followed it off the Hansen post, but now he is mixing in CO2 fertilization and drought.
He is also showing his years of experience in picking cherries.
So many of the "CO2 is plant food" argument depend on studies in greenhouses, etc, where other limiting factors are not limited. The SkS post "Plants cannot live on CO2 alone" provides background. That may be a better place to continue this discussion.
As for his drought comments, he has picked a global diagram (figure 5 out of the Hao et al paper he references) that contains absolutely no regional information at all.
Figure 2 from that paper (available online) shows some examples of the regional droughts as detected by their methodology, but the paper does not provide any information about regional trends. The figure (below) does indicate that "global" really is rather global. I suspect that changes in the desert zones (look at the Sahara) or high latitudes have little effect on agricultural productivity.

Mr. Burton's U.S. drought trend also suffers the same failure: ignoring regional trends. It is also purely a precipitation-based wet/dry analysis - not looking at the important temperature effects on drought. And each classification of "very wet/very dry" is solely an indicator of whether each region is wetter or drier than its own regional value - which tells us very little about drought. Quoting from the original source:
Climate divisions with a standardized anomaly in the top ten percent (> 90th percentile) of their historical distribution are considered "very warm/wet" and those in the bottom ten percent (< 10th percentile) are classified as "very cold/dry".
A normally very wet area that is only seeing precipitation in its bottom 10 percent will in all likelihood still be getting more precipitation than a normally dry area that is in its top 10 percent. The student that typically gets 85-95% on exams and score 85% on this one still gets a better grade than the student that typically gets 65-75% on exams and scores 75% on this exam.
If you start to look at regional patterns, other features begin to emerge. SkS had a re-post of a 2018 Carbon Brief article that looks at specifics. It gives a good explanation of the factors other than precipitation that need to be considered. When it comes to agriculture, even the "correct" amount of precipitation can be bad if it is at the wrong time. Fields that are "too wet to plough", crops ready for harvest that are rotting in the fields and can't be harvested, etc.
As usual, Tamino does an excellent job of taking data and picking out regional patterns. He did one in 2019, looking at "The West Burns and the East Drowns - so it averages out, right?". Spoiler alert: the two regions show different trends. Borrowing two of his images:


Tamino also had a post in 2018 about US drought patterns. Again, there are major regional differences, with the west (especially the southwest) getting drier, and the northeast getting wetter.
The sort of analysis that Mr. Burton is presenting is the kind of argument that leads one to conclude that the average person has one testicle and one breast.
Follow-ups on the drought discussion should probably be removed from this thread and posts on the 2018 Carbon Brief article repost.
- How big is the “carbon fertilization effect”?
daveburton at 00:59 AM on 13 July, 2023I wrote elsewhere, "Due to the temperature dependence of Henry's Law, a 1°C increase in temperature slows CO2 uptake by the oceans by about 3%."
In reply, Rob asked, "Where do you come up with this 3% figure?"
From Weiss (1974), an approximate relationship is (as summarized by Pro-Oceanus):
The equilibrated ratio of partial pressure to dissolved concentration is governed by solubility:
pCO2 = Kₒ [CO2 (aq)]
where pCO2 is the partial pressure of CO2 in the gas phase, Kₒ is a solubility coefficient, and CO2 (aq) is the concentration of CO2 dissolved in the water.
The solubility of CO2 in water is a function of both the temperature and the salinity of the water, one relationship from Weiss (1974):
ln (Kₒ) = -60.2409 + 93.4517(100/T) + 23.3585(ln(T/100)) + S(0.023517-0.023656(T/100)+0.0047036(T/100)²)
where the solubility coefficient (Kₒ) has the units of mol kg⁻¹ atm⁻¹, temperature (T) is Kelvin, and salinity (S) is in parts per thousand (approximately equal to PSU).
Note that for non-saline waters, the second term of the equation becomes zero, leading to
ln (Kₒ) = -60.2409+93.4517(100/T)+23.3585 ln (T/100)
To get the "3%" figure, you can plug in suitable values, or you can look at a graph, like this one:
- Hansen predicted the West Side Highway would be underwater
daveburton at 07:21 AM on 7 July, 2023Michael wrote, "the last time Carbon dioxide was over 400 ppm the sea level was more than 20 meters higher than current sea level."
Yes, many things were different 4.5 million years ago. They weren't all caused by CO2.
For example, the highest-quality Pacific sea-level measurement record is from Honolulu, on Oahu. But it would be difficult to say anything meaningful about how sea-level there has changed since CO2 levels were last this high, because Oahu (and the Big Island) didn't exist 4 million years ago!
Michael wrote, "Your sea level graphs are obviously flawed."
I guarantee that they are not flawed.
They are accurate plots of sea-level measurements at those two sites, which are the best long NOAA Atlantic sea-level measurement record (The Battery, NYC), and the best long NOAA Pacific sea-level measurement record (Honolulu, HI). The linear and quadratic regressions are accurately calculated from the most recent 100 years of data at each site, shown with deep blue traces. Earlier data (not included in the regressions) is shown in light blue.
If you click the links, you can adjust the measurement periods over which the regressions are calculated, and see the effect of those adjustments. You can also smooth the plots, and choose whether to plot linear and/or quadratic fits, as well as confidence and/or prediction intervals. At the top of each graph you'll also find links to the corresponding NOAA and PSMSL web pages for those sites. You can also do the same analyses for other NOAA measurement sites, and for over 1000 sites with data available from PSMSL (though the PSMSL data aren't as up-to-date as the NOAA data).
Michael wrote, "you have cherry picked two single locations to do your calculations without justifying your choice."
They aren't "cherry-picked," I told you why I chose them: they are "the best long U.S. Atlantic and Pacific sea-level measurement records, respectively."
The analysis period of 100 years is arbitrary, of course, but if you click the links which I provided you can easily change it:
https://sealevel.info/MSL_graph.php?id=Battery&c_date=1923/6-2023/5
https://sealevel.info/MSL_graph.php?id=Honolulu&c_date=1923/6-2023/5
I also reported the conclusion of a comprehensive study: "Hogarth studied many long measurement records, and concluded, 'Sea level acceleration from extended tide gauge data converges on 0.01 mm/yr²'" (That's negligible, BTW.)
Beware of "global" sea-level analyses which use varying mixes of measurement locations. As you can see from the striking difference between Oahu and New York, sea-level trends vary considerably from one location to another. So if you use a different mix of measurement locations for the left and right ends of a plot, you can easily create the illusion of a sharp acceleration or deceleration which is not evident in the individual measurement records.
Also, beware of the fact that there are also regional effects, in some places. For example, ENSO causes changes in low-latitude easterly Pacific trade winds. During El Niños easterly Pacific equatorial trade winds diminish, so the Pacific ocean sloshes east, raising sea-level in the eastern Pacific, and lowering it in the western Pacific. This is very striking when you compare the sea-level measurement records of Kwajalein (in the western Pacific) and San Diego (in the eastern Pacific). They are almost perfect mirror images!
https://sealevel.info/1820000_Kwajalein_San_Diego_2016-04_vs_ENSO_annot4.png

(One of the nice things about Honolulu is that it is near the ENSO "teeter-totter pivot point," so, unlike other long Pacific sea-level measurement records, Honolulu's is scarcely affected by ENSO.)
Another example of regional effects is the southeastern United States, where Gulf Stream variations are apparently the cause of well-known multi-decadal fluctuations in sea-level trends. For a discussion see Zervas (2009), NOAA Technical Report NOS CO-OPS 053, Sea Level Variations of the United States, 1854-2006. Here's a relevant excerpt:

- Hansen predicted the West Side Highway would be underwater
Rob Honeycutt at 01:30 AM on 6 July, 2023Dave... So much is wrong in that post. Let's just start with atmospheric CO2 perturbation. No one claims it stays up there forever. But the change in CO2 concentration will persist for centuries and millennia to come.
https://climatehomes.unibe.ch/~joos/papers/joos97eps.pdf
Your sealevel.info snippet is misleading, and I assume you understand that virtually no one is going to follow the link to the actual IPCC page to read the full passage, because it will directly contradict what you're saying.
What you're looking at in those changes is a function of partial pressure. The ocean takes up about half of our emissions (lucky for those of us who live in the atmosphere, not so lucky for sea dwelling creatures). The increases you're demonstrating are merely a function of increased atmospheric concentrations. The oceans, in particular, are not going to continue to take up CO2 beyond what it's capable of doing due to partial pressure.
- 97% consensus on human-caused global warming has been disproven
Eclectic at 11:07 AM on 5 July, 2023Duran3d @75 ~ the short version is that Rob Honeycutt is correct. The long version is that Rob Honeycutt is still correct. [See also: Bob Loblaw @77 ]
In derivation, the word consensus has a (narrow) range of meanings . . . but the meaning which you wish to use is nowadays an extreme outlier (used by hardly anyone). Over decades, the meaning of a word can gradually drift in one direction ~ and the drift does occur by consensus ;-)
Consensus does not mean merely a majority, or even a supermajority [indeed some sources claim "over 75%" agreement is a consensus ~ but that is far too weak for expressing consensus among scientists]. And some people try to gild the lily by going all mathematical: e.g. in year 2010 the consensus among scientists was >97% about the human cause of modern Global Warming . . . a figure which has now risen to >99% agreement (at time of writing). # But that sort of thing is unnecessary, because the overall evidence (of AGW) is so overwhelming, that it is a justifiable short-hand to use the simple word consensus.
Duran3d , you may be pleased to hear that one of the range of meanings of consensus used by the Ancient Romans . . . included a situation involving "plotting together". That fact could be joyous news to current climate-science-denying contrarians & Conspiracy Theorists ! Though I think most of that group are not really interested in meanings or facts.
As an aside ~ the word consensus is attacked by one of the (current) U.S. Presidential candidates [RFK.Jr] who uses his lawyerly skills to advocate the Anti-vaxxer cause. But coming from him, it is all just a torrent of words intended to convince the already-convinced intransigent Anti-vaxxers. He continually demands "scientific evidence in controlled studies" while also continually ignoring the bleeding-obvious evidence which already exists as a huge mountain. He is a true Denialist.
- At a glance - Ocean acidification: Global warming's evil twin
Bob Loblaw at 10:12 AM on 5 July, 2023By the way, Gordon. We're still waiting for you to provide a definition of "catastrophic" on this thread here. Don't think we've forgotten about your previous evasive behaviour on other threads.
Have you read the Comments Policy yet?
- Hansen predicted the West Side Highway would be underwater
daveburton at 01:56 AM on 4 July, 2023It appears that Hansen added that "assuming CO2 doubled" caveat later. Many years later he claimed to recall that that's what he had said to Reiss back in 1988, but there doesn't seem to be any contemporaneous evidence of it.
Moreover, his claim doesn't pass the smell test, not only because of the implausibility of remembering such details years later, but also because in 1988 the atmospheric CO2 concentration was less than 352 ppmv, and it was rising by only 1.63 ppmv or +0.476% per year. For the CO2 level to reach 570 ppmv by 2028 would have required a wildly accelerated average annual increase of ((570-352)/40) = 5.45 ppmv or +1.21% per year.
The rate of CO2 level rise did accelerate, but only slightly. Over the last decade the atmospheric CO2 concentration has increased at an average rate of 2.45 ppmv or +0.603% per year.
With only five years to go before 2028, the average sea-level at The Battery in Manhattan has risen by only about 6.7 inches (some of which is due to subsidence), and the "West Side Highway" (Henry Hudson Parkway) is still about ten feet above mean sea-level. - Greenhouse effect has been falsified
EddieEvans at 23:53 PM on 26 June, 2023Has the greenhouse effect been falsified?
Robotic Reading: Has the greenhouse effect been falsified?
While Earth’s climate has changed throughout its history, the current warming is happening at a rate not seen in the past 10,000 years.
According to the Intergovernmental Panel on Climate Change (IPCC), "Since systematic scientific assessments began in the 1970s, the influence of human activity on the warming of the climate system has evolved from theory to established fact."1
Scientific information taken from natural sources (such as ice cores, rocks, and tree rings) and from modern equipment (like satellites and instruments) all show the signs of a changing climate.
From global temperature rise to melting ice sheets, the evidence of a warming planet abounds.
- Greenhouse effect has been falsified
EddieEvans at 23:50 PM on 26 June, 2023"Has the greenhouse effect been falsified?" with current NASA evidence for anthropogenic greenhouse gas warmoing.
EVIDENCE
How Do We Know Climate Change Is Real?
There is unequivocal evidence that Earth is warming at an unprecedented rate. Human activity is the principal cause.
While Earth’s climate has changed throughout its history, the current warming is happening at a rate not seen in the past 10,000 years.
According to the Intergovernmental Panel on Climate Change (IPCC), "Since systematic scientific assessments began in the 1970s, the influence of human activity on the warming of the climate system has evolved from theory to established fact."1
Scientific information taken from natural sources (such as ice cores, rocks, and tree rings) and from modern equipment (like satellites and instruments) all show the signs of a changing climate.
From global temperature rise to melting ice sheets, the evidence of a warming planet abounds.
- Cranky Uncle: a game building resilience against climate misinformation
Rob Honeycutt at 09:26 AM on 19 June, 2023Peppers, here is a link to the appropriate thread for the breathing CO2 topic. But before you respond, please take the time to read the article and consider the science presented.
- Water vapor is the most powerful greenhouse gas
Charlie_Brown at 03:13 AM on 18 June, 2023Bob @388
We agree more than you think. I did not intend to imply that only two atmospheric layers need to be considered for emittance. I was intending to illustrate the many strong and weak absorption lines in the layers that were most important for emittance from CO2 and H2O. A useful concept is to look down from the top of the atmosphere. Integrate absorptance/emittance for energy loss to space from the top and descend until a value of 1.0 is reached. MODTRAN Infrared Light in the Atmosphere (MILIA) model, which is a multilayer model, does the calculations.
Maybe we disagree on descriptions for the magnitude of contribution to the upward heat flux from the tropopause and the stratosphere, because I conclude that the major emitting layer for CO2 is the tropopause (11-20 km in the 1976 U.S. Std atmosphere) and the stratosphere contributes only a small amount. This can be demonstrated by changing the altitude in MILIA from 20 km (217 K) to 50 km (271 K). At 20 km, the bottom of the spectrum in the CO2 band of 14-16 microns reaches 217 K, which matches the Planck distribution. Raising the altitude to 50 km brings the bottom of the band up a little bit to 222 K, but not to the higher temperature of the stratosphere. Also, and very interesting, is the appearance of a sharp peak at 14.9 microns that matches a Planck temperature of 240 K. This is caused by the contribution from a few very strong CO2 absorption lines.
We agree that Manabe’s work is awesome, but I don’t think that it necessarily supports a description “A lot of IR loss to space comes from the stratosphere.” It demonstrates a significant effect of CO2 on the temperature of the stratosphere. However, the stratosphere has so few molecules that small differences in the total IR energy flux can have large differences in temperature.
- Water vapor is the most powerful greenhouse gas
Charlie_Brown at 07:47 AM on 16 June, 2023Actually, I think that Vidar2032 @383 is correct. When he/she says GHGs emit at a fixed temperature, I believe he/she means at the temperature of the atmosphere as fixed by the atmospheric temperature profile. The 1976 U.S. Std Atmosphere for the tropopause, where CO2 emits to space, is close to 220K, while the emitting layer of H2O vapor in the troposphere is about 240-270 K. When he/she says that the effect of increased concentration is to broaden the band, that also is correct when considering that increasing concentration strengthens weak absorption lines. Look at the Figure in Bob Loblaw @7 in his linked thread to Beer’s Law above, which Bob kindly produced for me at that time. The weak absorption lines on the wings get stronger as concentration increases. There is sufficient path length in the tropopause to bring most of the absorption lines for the CO2 band between 14-16 microns close to 1.0, which means that the emittance is close to 1.0. Stacking the strong absorption lines in the middle of the band, which means increasing the path length and bringing an emittance of close to 1.0 even closer to 1.0, is not how increasing CO2 increases the emittance. Note that increasing emittance means more energy is emitted from a colder temperature which has less intensity than the energy emitted from a lower altitude at a warmer temperature. This is in accordance with the Planck black body distribution curves that Bob presents. The difference between a black body and a gas is that a black body absorbs/emits at all wavelengths while gases absorb/emit only at wavelengths specific to their molecular structure. What would be interesting, if only I could post my own Figure, would be the HITRAN absorption lines for CO2 at conditions of the tropopause and H2O for the troposphere.
Meanwhile, Vidar’s question is an excellent opportunity to use the Univ of Chicago link to MODTRAN Infrared Light in the Atmosphere. Choose the 1976 U.S. Std Atmosphere. All one has to do is increase the water vapor scalar to 1.07 to show a 7% increase, then adjust the temperature offset until the original value is matched. It turns out to be about 0.25 C. Better, to see if 7 % is about right, set CO2 to 280, CH4 to 0.7, and Freon to 0 to get pre-industrial conditions. Save the run to background. Then change CO2 to 415, CH4 to 1.8, and Freon to 1.0 to get current conditions, adjust the temperature offset to match the starting value, and choose holding fixed relative humidity. The raw model output shows that it changes the water vapor by about 6%, and the temperature offset is about 1.0 C. It's a very good approximation, but be careful not to place too high of an expectation on the accuracy and precision of this model. Realize that it is designed to be an educational tool with high computational speed and limited flexibility that provides good results, but better models exist for professional use.
- 2nd law of thermodynamics contradicts greenhouse theory
Rob Honeycutt at 11:21 AM on 13 June, 2023Actually, Bob, I think this is the paper CO2 Science is discussing.
- At a glance - How reliable are climate models?
Bob Loblaw at 06:01 AM on 2 June, 2023PSBaker @ 15:
First, let's address your statement "I was not referring to..."
In your first comment (#1), you weren't referring to anything specific. You finished off with a broad, sweeping generalization about "senior scientists and journal editors". This gives the appearance that you are casting a wide net - as Eclectic said in comment #2 "unless you feel something misleading or nefarious is being concealed by their omission."
So, now that you have actually provided some specific references, let's look at them. Eclectic has already made some comment in #18, but I have a few more points to make.
For your first reference (link to full artcle):
- Eclectic commented on the vagueness of much of the discussion. I tend to agree.
- I also note that the key figure 2, on precipitation changes, makes what I would consider to be a fundamental error in the use of global climate model projections. It uses the multi-model mean as if it is the predicted path. It is not. In the figure I included in comment #8, the Model ensemble spread that gives a better indication of the possible future paths as predicted by the models.
- In section 2.1, they talk about people often use an average from several models "so that only the trend remains", so they are aware of the issue, but then they went and used that same ensemble mean to do their analysis in figure 2.
- In the first part of section 2, they actually state "Although the limitations of climate change projections are well-documented... the consequences of these limitations for practical decision-making in development practice have not been clearly laid out for the nonspecialist." [emphasis added]
- I also note that the sentence from the abstract immediately preceding the one that you quote states: "Climate model projections are able to capture many aspects of the climate system and so can be relied upon to guide mitigation plans and broad adaptation strategies..."
Thus, your first reference is not a broad condemnation of climate models - and basically sounds like a cry that it's the fault of climate scientists that non-specialists don't pay attention to the well-documented efforts of those climate scientists to explain the limitations of climate models.
Now, for your two references to Nature Climate Change:
- The Lembrechts one is a short News & Views article, and the first reference it contains is to the Maclean and Early paper (the other reference you provide). It hardly constitutes a second, independent analysis.
- In the Maclean and Early paper, the data that they use to evaluate their microclimate approach (as opposed to a macro-climate approach that global climate models work with) uses two time periods: 1977-1995, and 2003-2021.
- The changes in "heathland and grassland plant taxa" that they are looking at would not experience substantial change during that period, compared to the expected changes over the next century. The differences in range shift they get from their two modelling approaches are 14km (macro) and
- The short time periods means that much of what they are modelling in the way of microclimate changes is going to be related to weather and short-term variability, not long-term major shifts.
- A major weakness in their argument is that they basically present a case where short-term small changes in climate conditions do not lead to major range shift - but the concerns for future climate are not related to minor shifts that have already occurred. They are related to the major shifts expected in the future, and how they will be occurring much faster than species have adapted to in the past.
So, your second and third references also do not reflect on unreliability of global climate models.
P.S. The next time you want to post a comment similar to #1, please provide the references you are relying on in your first post. And as Eclectic has stated in #18, you should also be providing some sort of detail on what it in those papers that you think is relevant, and what point you want to make.
- At a glance - How reliable are climate models?
nigelj at 17:19 PM on 31 May, 2023Gordon @10
The IPCC WR5 projection in your comments includes observational data from 1970 - 2012 only. Its old data possibly from an older IPCC report. The observational data is quite close to the modelling for much of that period but the years 2005 - 2012 (approx) in that graph clearly fall significantly below the modelling mid line prediction. But this is a relatively short time frame, and it represents short term natural variation that models can't fully predict in terms of timing. This is the alleged pause in surface temperatures, which amounted to a flat period in the warming trend of about 7 years and was due to the influence of natural variation ( in simple terms)
The graph posted by Bob Loblow @ 8 includes observational data from 1970 - 2022 and so its much wider and more recent data, and its obvious that the warming trend from 2012 - 2022 has swung back to near the model mid line prediction, and that the observational trend is tracking quite close to the modelling overall for the full period 1920 - 2022. The modelling is obviously not running significantly hot.
I'm surprsied you didn't notice any of this.
- 10 year anniversary of 97% consensus study
One Planet Only Forever at 03:35 AM on 31 May, 2023The discussion here regarding the potential position of climate scientists regarding climate change impacts being catastrophic is interesting.
Based on Gordon’s comments it is obvious that the question to be asked of climate scientists is “Does your understanding support the claim that 4 C of warming would be potentially catastrophic?” His alternative question, evading the term potentially’ misleads the discussion into a ‘simplistic but complicated’ debate about the meaning of ‘catastrophic climate change impacts’.
‘How significant’ a catastrophe needs to be to ‘count’ is not a matter of personal opinion. It also is not a matter of political popularity or business popularity and profitability. Applying ethical considerations to the available evidence can establish a general common sense understanding that relates to this matter. Morality and Ethics basically say that preventable harm done is unacceptable, especially if the damage done is irreparable. The construction industry pursuit of ‘zero-injury’ in more advanced nations is a ‘business’ example of the application of this concept. However, political popularity or business popularity and profitability can compromise that fundamental ethics with questionable ethical ‘evaluations that consider the benefits obtained by some people to be worth the harm done, especially of the harm is done to ‘identifiable others’.
Many people unethically consider a catastrophe to only count if it happens to the sub-set of humanity that they have decided to identify with. They are not open to accepting the broad diversity of less harmful and more helpful ways of being human in pursuit of developing sustainable improvements for the future of humanity. Those people can be expected to make up a diversity of arguments attempting to distract from learning about harm done to others. They will even try to diminish harm done to others in the future (a classic ethical test of the merits of things happening later being less important is the question of the ethics of burying a long lasting land mine in a region where it is likely that the mine will only be detonated and harm someone in the distant future).
Using structural engineering or business management as examples of consideration of catastrophe is also helpful. I am a professional civil/structural engineer with an MBA. So these are areas of understanding I am quite familiar with and able to understand in depth.
When engineering things like a structure or surface run-off drainage system there is an important difference between ‘temporary failure of part of the system causing limited and repairable damage’ and a ‘more significant catastrophe affecting more of the system or producing harmful results that are not repairable’. The general engineering rule regarding repairable failure of parts of the system is that the probability of such a localized limited ‘potential catastrophe (because some irreparable harm could occur as a result of the repairable failure) needs to be less than 2%. The potential for a larger or irreparable failure needs to be significantly less than 2%.
For a business, the quarterly or annual lack of performance by a portion of a larger operation is a concern. And a business venture’s sustainability requires the chance of each of those ‘limited catastrophes’ to be small because too many of them happening too often would be a bigger problem. And a larger aspect of the business failing to perform as hoped would need to have a significantly lower probability of occurring.
Sustaining a structure, drainage system, or business requires actions that understandably, based on the evidence, reduce the risk of catastrophic results. Benefiting from harm suffered by others, including avoiding the costs of being less harmful, may be temporarily regionally popular and profitable. But developing sustainable improvements for global humanity requires limitations on the sovereignty (freedom) of ‘all’ portions of the population (business and political) to believe and act as they please.
Relating that understanding to climate change, the probability of ‘catastrophic (irreparable) regional results’, such as needing to relocate or ‘adapt’ any small percentage of already developed human activity, would have to be less than 2%. And the probability of ‘needing to relocate, or revise to adapt, a larger amount of developed human activity’ would need to be a much lower than 2%.
Based on that understanding, open to improvement, the evidence indicates that catastrophic climate change impacts have already occurred at levels of impact below 1.5 C. So, applying that ethical perspective, it is highly likely that a vast majority of climate scientists, perhaps more than 97%, would say that their understanding supports the claim that 4 C of warming would be potentially catastrophic.
Note: There is a very important difference between understanding and opinion. Common sense requires common evidence based ethical understanding. Opinion is free from the restrictions of evidence or ethical consideration.
- Antarctica is gaining ice
Bart Vreeken at 19:51 PM on 24 May, 2023Thank you very much, scaddenp #579
So text was just removed, which is very annoying! I wasn't sure if I had done anything wrong myself.
But indeed, a rising air temperature and reduced sea ice mean more snowfall and a higher Surface Mass Balance according to multiple models. The question is how that relates to the increased melting and calving along the edges. Nobody knows exactly, and therefore it's good to have a close look on what happens.
BL #577 "He's made a big thing about NASA's 149 Gt/yr value"
Huh ...? I simply changed the number, for it was wrong. Bob Loblaw was the one who kept talking about it. And yes, "it ignores all the data in between." But that's not what the discussion was about. Replacing the 'last-first' by 'regression' doesn't make it better, for that still ignores all the data in between.
- Antarctica is gaining ice
Bart Vreeken at 05:44 AM on 21 May, 2023"Where the 149 Gt/yr number comes from was discussed in March"
OK, let's have a look at the data of IMBIE, then. IMBIE is the Ice Sheet Mass Balance Inter-comparison Exercise. They compare data from different sources: gravimetry, altimetry, input-output.
essd.copernicus.org/articles/15/1597/2023/
There, the average number over April 2002 - December 2020 is 114,9 Gt/Yr. Very much like my calculation, but without the data of 2021 and 2022.

- 10 year anniversary of 97% consensus study
Bob Loblaw at 00:20 AM on 18 May, 2023To borrow a contrarian meme, "one more nail in the coffin" of Gordon's quest "to find out what percentage of climate scientists believe that global warming will be catastrophic."
The study referenced in the OP is not a survey of "what scientists believe". Skeptical Science has a longer post on the 97% consensus theme. The Cook et al (2013) study is just one of the papers discussed there, and this is how it is described (including a link to the paper itself):
A Skeptical Science-based analysis of over 12,000 peer-reviewed abstracts on the subject 'global climate change' and 'global warming', published between 1991 and 2011, found that over 97% of the papers taking a position on the subject agreed with the consensus position that humans are causing global warming. In a second phase of the project, the scientist authors were emailed and rated over 2,000 of their own papers. Once again, over 97% of the papers taking a position on the cause of global warming agreed that humans are causing it
Note that the study looked at the abstracts of published papers. And in a second phase, the study did not ask scientists "what they believed" - they asked authors of papers to rate the papers they had written.
That Gordon confuses reading the literature with "asking what someone believes" tells us more about Gordon than we probably need to know.
If Gordon seriously wants an answer to his "catastrophic" question, along the lines of the study done by Cook et al (2013), there is an obvious solution:
Read the scientific literature
- 10 year anniversary of 97% consensus study
Eclectic at 09:58 AM on 17 May, 2023Gordon ~ regarding Dana Nuccitelli, it's all a matter of context.
Easy to see when "catastrophic" is being used as a deflection / strawman that is being shouted (to abort rational thinking).
Catastrophic is defined by the effect (not the absolute temperature e.g. 4 degrees rise). As I am sure you know very well, Earth's surface temperature was above that 4 degC level in the distant past ~ but then there was much more carbon in the biosphere. Nowadays . . . not so much carbon "available", but the biosphere is far less resilient against rapid warming (in large part, thanks to the presence of 8+ Billion humans ~ and many of whom live in poverty already).
Your question about % of scientists "believing" in catastrophic probabilities, is a question that is moot. It is a question that is designed (consciously or otherwise) to deflect thought away from the practicalities of our current situation. Or to deflect from the 97% topic?
- 10 year anniversary of 97% consensus study
Eclectic at 16:35 PM on 16 May, 2023John Mason @7 ,
You are quite right ~ "going red giant" is vastly more likely (tho' gradual)
. . . so I rate that as only # 97% catastrophic.
~Was going to say # 95% , but 97% is an almost inescapable climate figure .
- 10 year anniversary of 97% consensus study
Gordon at 10:12 AM on 16 May, 2023On the 10th Anniversary of the 97% consensus study maybe it is time to find out what percentage of climate scientists believe that global warming will be catastrophic ?
- Skeptical Science News: The Rebuttal Update Project
BaerbelW at 05:21 AM on 12 May, 2023The blog post was updated on May 11 with the links ot the latest rebuttals getting the "at a glance treatment":
The 97% consensus on global warming
- There is no consensus
Rob Honeycutt at 09:25 AM on 22 April, 2023Okay, let's go over this again, Albert.
The premise of the paper is as stated in the introduction.
We examined a large sample of the scientific literature on global CC, published over a 21 year period, in order to determine the level of scientific consensus that human activity is very likely causing most of the current GW (anthropogenic global warming, or AGW).
Do you honestly not see the words: human activity is very likely causing most of the current AGW?
That statement creates the fundamental basis of papers that either endorse or minimize that position.
If you're telling me that most "skeptics" agree that human activity is very likely causing most of the current GW... hey! We're good!
"It is a clear indication that only 1.6% of the papers thought that humans were causing most of warming."
Nope, precisely because categories 1, 2 and 3 all endorse the idea that human activity is very likely causing most of the current GW.
"...AMS in 2016 and it explicitly asked members if they vpbelieved humans were responsible for the majority of warming and 67% said yes."
And they also explain that most of their members were NOT experts in climate science and do not publish climate research. The greater their expertise, the greater their level of agreement, with the highest level of expertise also demonstrating ~97% agreement with the idea that human activity is very likely causing most of the current GW.
"...why Cook went to considerable lengths to hide the category numbers."
He didn't.
"I am passionate about truth in science..."
Clearly, quite the opposite.
"...I have an open mind on all matters..."
As Carl Sagan used to say, "It's good to keep an open mind, but not so much that your brain falls out." I think that perfectly describes your position in this matter.
"In the sixteenth century, 99.9% of scientists believed the Sun orbited the Earth."
No, it was 16th century scientists who were explaining to people the earth orbited the sun. Once presented within a scientific/mathematical structure, scientists of the day readily accepted this fact.
"i Won't be commenting on this thread again."
We are relieved.
- There is no consensus
Albert at 09:03 AM on 22 April, 2023"a) If you had bothered to read the actual paper it's explained why the figures are organized as they are."
I have read the paper multiple times and the so called explanation groups 1,2 and 3 together and compares them to groups 5 6 and 7 and as I have said, most sceptics would be in group 3.
The "minimise" option Is a red herring as most sceptics believe in an ECS of 1.2C which is both group 3 and groups 56 and 7.
"b) Your 1.6% figure only relates to papers that explicitly quantify human contribution. With that you'd have to compare that to other papers that explicitly minimize human contribution."
Nonsense. It is a clear indication that only 1.6% of the papers thought that humans were causing most of warming.
You can't count, for example, a paper that explicitly quantifies against a paper that implicitly endorses human contribution.
Nomsense. Most sceptics who write papers would be in several categories and that is the lie in Cooks paper.
The only time that a scientific organisation has polled its members was by the AMS in 2016 and it explicitly asked members if they vpbelieved humans were responsible for the majority of warming and 67% said yes.
They didn't play the pretend game of setting up false categories and compare warmists against sceptics like Cook did.
The AMS were extremely embarrassed by this and tried to spin the result saying it was misinterpreted blah blab blah but since this no scientific body has ever dared poll their members again.
Roh you still havenot explained why Cook went to considerable lengths to hide the category numbers. It took me a couple of days to eventually figure out how to chuck the file into a spreadsheet and extract the totals.
I am passionate about truth in science, you're not, so let's just agree to disagree.
PS engaged with you on this subject because I have an open mind on all matters and wanted to read whether there were aspects of the "97%" I wasn't aware of, but your comments show me that there aren't.
Last comment
A few years ago the Australian sceptic society had a comment on their home page saying nothing was exempted from scepticism but also had a manifesto on global warming saying the science was settled and gave theit reasons.
I went through the manifesto line by line discrediting it by referring to data and submitted it. However next day it had disappeared and I contacted the editor and he said he had passed it on to "experts" to see if it was valid. He said he would get back to me but never did.
So a sceptic society now determines what you can be sceptical about. You can challenge the theories of Newton and Einstein but not the high church of climate change. That makes it a faith, not science.
Very last comment
In the sixteenth century, 99.9% of scientists believed the Sun orbited the Earth.
i Won't be commenting on this thread again.
- Arctic sea ice has recovered
Albert at 15:26 PM on 20 April, 2023I tried to insert a graphic from DMI showing Arctic ice extent from 1979 but without success.
https://ocean.dmi.dk/arctic/icecover_30y.uk.php
The URL shows a decline of about 15% from 1979 to about 2012 but unfortunately most warmists only refer to the minimum monthly values rather than all the data.
Its like only giving January rainfall totals instead of the yearly totals.
The graph above showing Arctic ice just shows reconstructions because there was no accurate way to measure total Arctic ice before satellites.
I could show you reconstructions showing significantly different trends but I know it would be a waste of time.
- There is no consensus
Rob Honeycutt at 15:03 PM on 20 April, 2023Albert... I think you should take a moment to read the comments policy for this site. Accusations as you've just leveled are against policy.
As for your question, no one was trying to hide anything. The data is there available for anyone who wishes to dig into it. But it's not really relevant to the results of the paper. It just creates fodder for people like you whose intent is to misinterpret the data.
Regarding the AMS paper, different from the Cook paper, that research was about the opinions of their members. As already stated, the paper was structured similar to Doran/Zimmerman where the subjects had varying degrees of expertise in the subject matter. Once you got to publishing PhD level scientists, yes there was a consensus in the 97% range.
- There is no consensus
Rob Honeycutt at 10:06 AM on 20 April, 2023@932... "How can you misinterpret a plain English statement saying 'explicitly endorses >50% of warming is human induced'?"
Yes, this is indeed the exact sentence you're attempting to use to reject the conclusions of the paper. Remember, the conclusion of the paper is that 97.3% of the research agrees that human activities are primarily responsible for global warming.
- Arctic sea ice has recovered
Albert at 09:57 AM on 20 April, 2023"BL] In the absence of an argument from you that short-term variations actually indicate a departure from long-term trends, there is nothing to challenge."
You keep misinterpreting the point I am making is that Arctic ice thickness and volume stopped shrinking at least 11 years ago, I made no other claim.
What do you mean by a "long term trend"? the Satellite measuring of Arctic ice and global temperatures started in 1979 and we know that global temperatures reduced from about 1940 until the mid 1970s and we know that Arctic ice is sensitive to global temperature so it is logical to believe that Arctic was low in 1940.
I will find some evidence that scientists believed Arctic ice was low in 1940 but I suspect that even if I did, you wouldn't acknowledge it
- There is no consensus
Albert at 21:01 PM on 19 April, 2023"Quite commonly I see statements saying that Cooks paper said the "97% of scientists believe that humans are largely (>50%) responsible for global warming" but Cooks paper category 1 clearly and unambiguously states that the figure is 1.6%."
please stop throwing in red herrings like "minimise" and tell me why my direct quote is wrong?
- There is no consensus
Rob Honeycutt at 14:44 PM on 19 April, 2023And... "Quite commonly I see statements saying that Cooks paper said the "97% of scientists believe that humans are largely (>50%) responsible for global warming" but Cooks paper category 1 clearly and unambiguously states that the figure is 1.6%."
Here you muck up pretty much everything. The Cook paper is an analysis of research papers, not scientists' opinions.
Category 1 explicitly endorses the idea that human's are the primary cause of global warming, and makes quantifications.
Category 2 explicitly endorses the idea that human's are the primary cause of global warming without making quantifications.
Category 3 implicitly endorses the idea that human's are the primary cause of global warming.
Category 5 implicitly minimizes the idea that human's are the primary cause of global warming.
Category 6 explicitly minimizes the idea that human's are the primary cause of global warming without making quantifications.
Category 7 explicitly minimizes the idea that human's are the primary cause of global warming, and makes quantifications.
The level of consensus is the measure of the papers that endorse vs those that minimize.
It's that simple. A child can understand this.
- There is no consensus
Rob Honeycutt at 14:31 PM on 19 April, 2023Albert @914... "Once again I ask, why have 3 categories lumped into the "97%" result when only one category saying 'explicit or implicit support that humans contribute to global warming'."
Think of it in terms of "endorse" vs "minimize" and think of the IPCC position being the subject being either endorsed or minimized.
Three endorse categories and 3 minimize categories.
- Arctic sea ice has recovered
Albert at 13:42 PM on 19 April, 2023Looking at the graph should indicate quite clearly that there is definitely no decline since 2012 and your tabulated data also clearly shows this.
Average Arctic ice extent has also plateaud since 2012 (SII) or 2006(MASIE).
If you look at yearly averages since 1979, Arctic ice has only reduced by about 15% and as I wrote above, all this was prior to 2012.
DMI, JAXA, Bremen uni, and others all say the same.
"i would be curious to learn what you believe explains the observed Arctic Sea Ice Mass changes since 2012."
My guess is the cyclic currents that bring warm waters to the Arctic have reached the top of their cycle and are changing to a cooler mode.
Evidence seems to suggest that the cycle is around 80 years and we know that Arctic ice extent was also low around 1940.
- There is no consensus
Albert at 13:09 PM on 19 April, 2023Once again I ask, why have 3 categories lumped into the "97%" result when only one category saying "explicit or implicit support that humans contribute to global warming".
Again, virtually every sceptic scientist, meteorologist, geologist, etc would agree with the above statement so they will not be publishing a paper saying there is little or no anthropogenic warming.
Skeptics believe in the direct effect of CO2 causing an ECS of about 1.2C but reject the positive feedback theory pushing ECS to 3C and beyond.
So categories 5,6 and 7 are really meaningless, because of the above.
Quite commonly I see statements saying that Cooks paper said the "97% of scientists believe that humans are largely (>50%) responsible for global warming" but Cooks paper category 1 clearly and unambiguously states that the figure is 1.6%.
- There is no consensus
Bob Loblaw at 05:04 AM on 19 April, 2023Albert @909 starts off by questioning the groupings in the Cook et al 2013 study, saying that he searched and could not find totals for the individual categories.
I have linked to the journal article above, and you can scroll down and find the "Supplementary data" link. In that data, one of the files provides every single paper/abstract included in the study, and it's ranking. It's pretty trivial to read that into a spreadsheet and get totals for each group. Those totals are:
1
Explicitly endorses and quantifies AGW as 50+%
64
2
Explicitly endorses but does not quantify or minimise
922
3
Implicitly endorses AGW without minimising it
2910
4
No Position
7970
5
Implicitly minimizes/rejects AGW
54
6
Explicitly minimizes/rejects AGW but does not quantify
15
7
Explicitly minimizes/rejects AGW as less than 50%
9
The paper points out that category 4 includes two groups, which need to be treated differently:
- No position (7930 papers)
- Uncertain (40 papers)
"No position" must be excluded entirely, as it is impossible to conclude a position that is not expressed in the paper's abstract. That makes a total of 4014 papers that express an opinion (explicitly or implicitly).
Given the groupings of 1-3 and 5-7, it is obvious that 1-3 share the trait of "not minimized". It is perfectly reasonable to treat "not minimized" as ">50%", when the paper does not quantify a value.
Likewise, grouping 5-7 together is the opposite: they all share the trait of "minimizes", whether they have quantified the minimization or not.
The point of the three categories is to distinguish between explicit quantification, explicit without quantification, and implicit without quantification - on both sides of the equation.
Now, what about that 1.6% number that Albert throws out? To get 1.6%, you have to pick category 1 (64 papers) and divide by 4014 (the total number that expressed an opinion, explicitly or implicitly).
So, while Albert is questioning the grouping of papers into 1-3 and 5-7, he sees no problem in grouping 2, 3, 5, 6 and 7 together into one category and calling it "papers that disagree that humans caused most of the recent warming". That grouping is far less supportable than the grouping used in the paper. Categories 2 and 3 (totalling 3832 papers) clearly are not defined in such a way that you can interpret "not minimized" as "<50%".
In fact, if you only consider the papers that explicitly quantify the effect as >50% or <50%, there are only 73 papers in categories 1 and 7 - and 64 of them say >50% of recent warming is due to humans. That is 88% of the total. A far cry from Albert's 1.6%.
We can also compare categories 2 vs. 6. 98% are on the "endorses" side.
And we can compare categories 3 and 5. Again, 98% on the "endorses" side.
Either Albert has not really considered where the 1.6% value came from, or he is deliberately trying to bias the result in one direction.
As for his final claim about "skeptics" being included in the 97%, Skeptical Science has another blog post on that matter. Scroll down to the section titled "Confused Contrarians Think they are Included in the 97%".
Albert is just repeating frequently-debunked crap.
- There is no consensus
Albert at 20:41 PM on 18 April, 2023why does the original paper list the seven categories but not the seven individual totals. I searched but couldn't find any totals.
instead it lumps categories 1,2 and 3 into a single number. So what was the point in having 3 categories?
but we frequently hear that the paper showed that "97% of scientists believe that humans caused most of the recent warming" which is not true because only 1.6% of papers said that.
I don't know of any sceptic who doesn't think humans are causing some warming so they would all be in the 97% consensus.
- Gas stoves pose health risks. Are gas furnaces and other appliances safe to use?
Bob Loblaw at 23:50 PM on 30 March, 2023A quick reference to a news item I came across this week. Earlier this month, Desmog had an article about this gas stove issue, with the under-the-headline statement "The American Gas Association is trying to discredit research on the health impacts of gas stoves today. But newly revealed documents show it was discussing indoor air pollution concerns five decades ago."
As described in the Desmog article, the pattern of behaviour by an industry trade group looks awfully familiar. It is a lot like the tactics that we have seen from the fossil fuel industry over climate change issues - and by the tobacco industry over smoking and cancer issues.
- CO2 effect is saturated
Bob Loblaw at 10:43 AM on 25 March, 2023Gootmud:
Don't play word games. It's the climate contrarians that make the claim that "the CO2 effect is saturated". You need to get the ones making that claim to explain what they mean.
In years of watching this (I've been studying climatology since the late 1970s, specialized in the subject for my PhD, and taught it at university for a number of years, and for over a decade made my living measuring climatologically-important radiation fluxes), I have yet to find a climate contrarian who can define it in a way that actually presents a real description of radiative transfer processes.
The people that make the claim pretty much always end up demonstrating a critical lack of understanding of how radiation transfer theory works. As you try to get them to define what they mean, it readily becomes apparent that they don't know what they are talking about.
There are several variations in the contrarian "CO2 is saturated" meme, and each goes wrong in a slightly different way. The term is rarely seen in proper radiation transfer discussions of climate, because the very few ways in which it is a meaningful term are ones that are not an issue for earth's climate - past or future.
The few climate contrarians that do understand radiation transfer theory do not make the "CO2 is saturated" claim - as you have discovered. They make other bad claims, but not the "CO2 is saturated" one.
- The Big Picture
Bob Loblaw at 06:11 AM on 21 March, 2023Rob @ 139:
In spite of Bart's map stating (on the US one):
"Please click on the map for historical temperature data and snow depth of places in the U.S. since 1974
...you actually need to click on the place names on the map to get a page showing data for that city. Clicking anywhere else on the map does nothing.
Another case of Bart saying one thing, but meaning something else.
- The Big Picture
Bart Vreeken at 04:22 AM on 19 March, 2023Hi Bob Loblaw, I'm afraid you don't understand the figure well.
Above a) you see the mass loss of Greenland where the calculation is based on. It says -166 Gt/yr. This causes a global sea level rise of something like 0,46 mm/yr. Due to the gravitation effect there are places on earth where the sea level rise is less then that, and places where it's more then that. The border between these two area's is the green line on the map between Africa and South America and in the Pacific. So, the Netherlands are in the area with less then 0,46 mm/yr sea level from Greenland, but it's more then zero. Then there is an other line, between yellow en blue. In the blue area there is no sea level rise by Greenland at all. Instead there is a drop of the sea level.

- The Big Picture
Rob Honeycutt at 02:50 AM on 19 March, 2023Bart @84... You were doing so well in your explanation up to the point you started making up stuff on your own, like: "Netherlands are close enough to Greenland to take profit of this effect..."
The Netherlands are 3000km away.
Here is a map from NASA, created through the JASON and TOPEX satellite missions to measure SLR over the past 23 years. This map represents the change in SLR over that period. Blue/white areas are where SL has fallen or stayed the same. Orange/red are SLR.
Now, look close at the area between Greenland and The Netherlands.
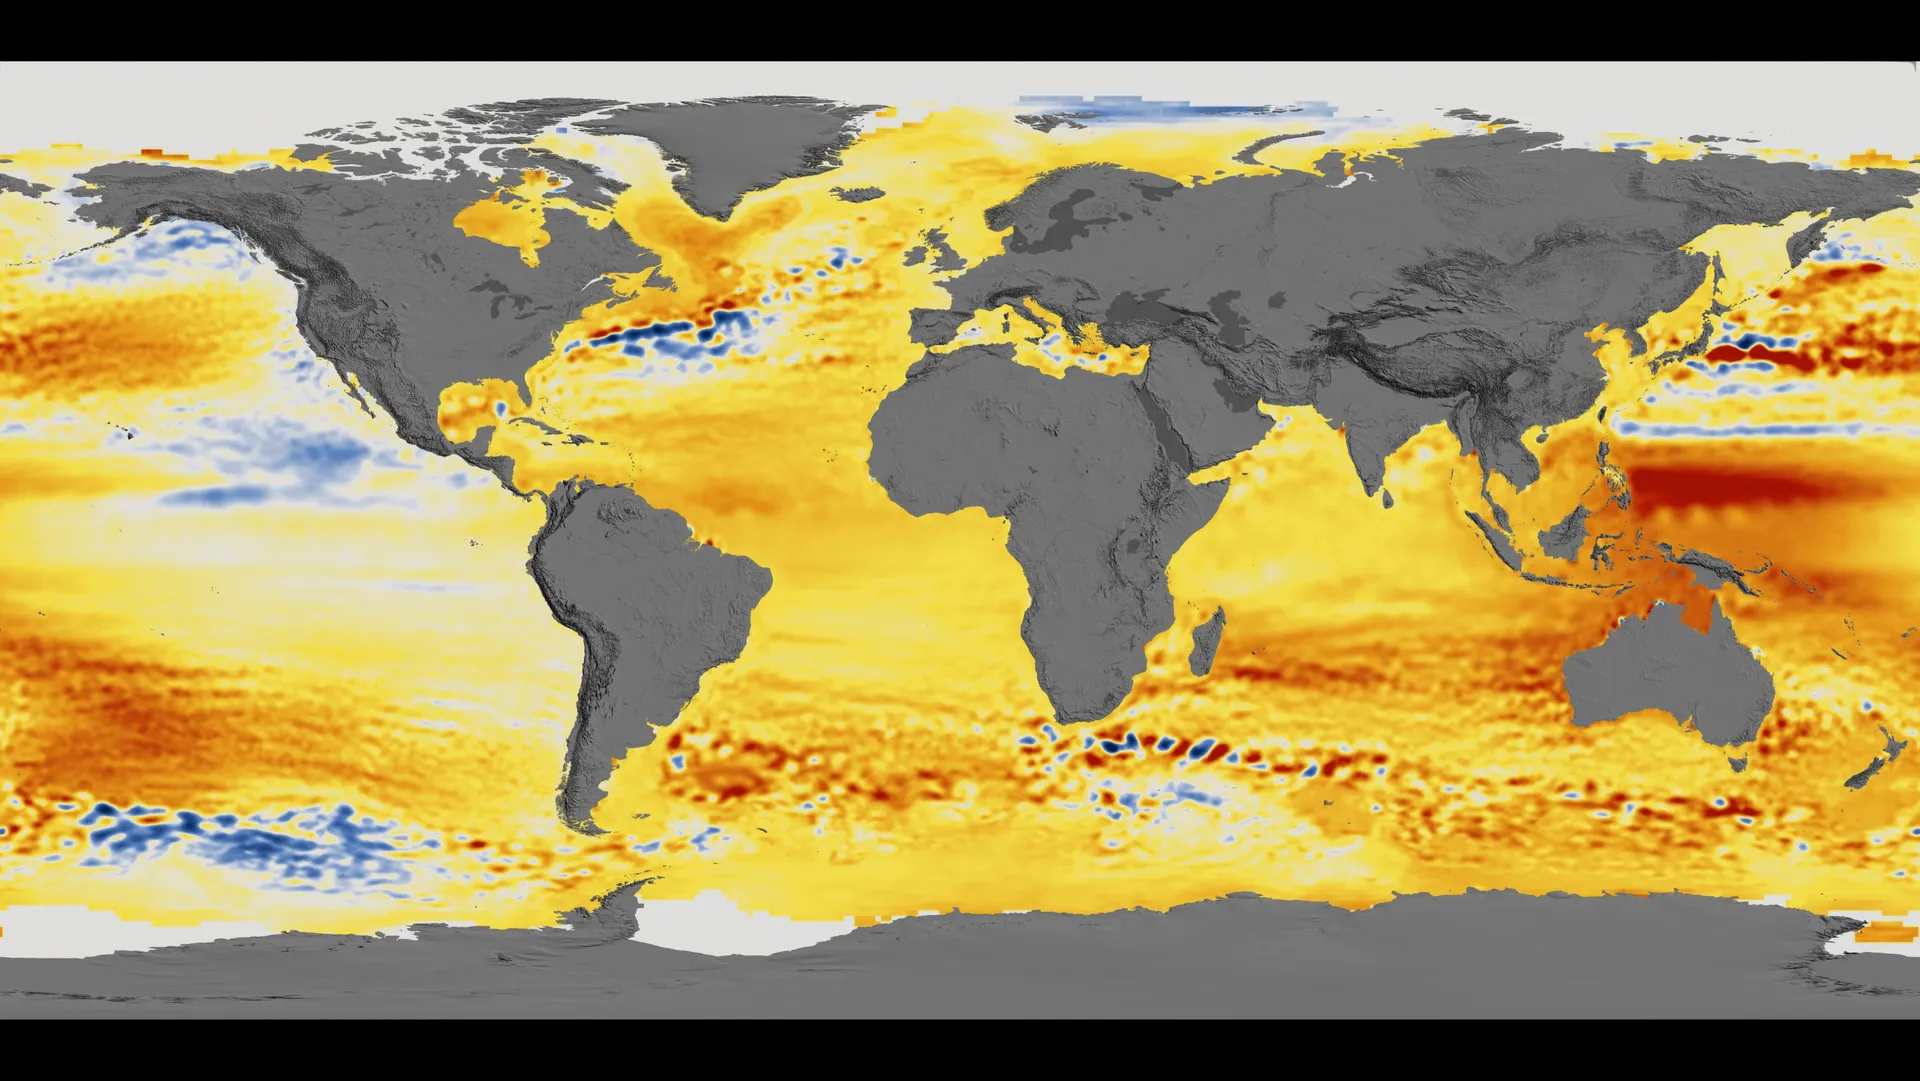
- The Big Picture
Bart Vreeken at 22:30 PM on 18 March, 2023MA Rodger @82 your quote is about the global sea level rise, not the local SLR.
This is how it works. The Greenland Ice Sheet has a lot of mass, so it attracts sea water. Due to that, the sea level in a large area around Greenland is higher then it should be without the mass of the ice. When the ice starts to melt a part of this effect disappears. So, around Greenland the sea level will drop, not rise. Netherlands are close enough to Greenland to take profit of this effect, but not enough to avoid sea level rise from Greenland completely.
More than 100 comments found. Only the most recent 100 have been displayed.
More than 100 comments found. Only the most recent 100 have been displayed.


THE ESCALATOR

(free to republish)