


 Arguments
Software
Resources
Comments
The Consensus Project
Translations
About
Support
Arguments
Software
Resources
Comments
The Consensus Project
Translations
About
Support
![]()
![]()
![]()
![]()
![]()
![]()
![]()
![]()
![]()
![]()


![]()


Latest Posts
- Skeptical Science New Research for Week #19 2024
- Climate Adam: How to visualise Climate Change (ft. Katharine Hayhoe)
- At a glance - Tree ring proxies and the divergence problem
- Why India is key to heading off climate catastrophe
- 2024 SkS Weekly Climate Change & Global Warming News Roundup #18
- Skeptical Science New Research for Week #18 2024
- At a glance - Clearing up misconceptions regarding 'hide the decline'
- Pinning down climate change's role in extreme weather
- 2024 SkS Weekly Climate Change & Global Warming News Roundup #17
- Fact Brief - Is Antarctica gaining land ice?
- Simon Clark: The climate lies you'll hear this year
- Skeptical Science New Research for Week #17 2024
- Water is at the heart of farmers’ struggle to survive in Benin
- At a glance - The difference between weather and climate
- India makes a big bet on electric buses
- 2024 SkS Weekly Climate Change & Global Warming News Roundup #16
- EGU2024 - An intense week of joining sessions virtually
- Skeptical Science New Research for Week #16 2024
- How extreme was the Earth's temperature in 2023
- At a glance - Is the science settled?
- What is Mexico doing about climate change?
- 2024 SkS Weekly Climate Change & Global Warming News Roundup #15
- Fact Brief - Did global warming stop in 1998?
- Skeptical Science New Research for Week #15 2024
- EGU2024 - Picking and chosing sessions to attend virtually
- At a glance - The Pacific Decadal Oscillation (PDO) is not causing global warming
- Climate Adam: Is Global Warming Speeding Up?
- 2024 SkS Weekly Climate Change & Global Warming News Roundup #14
- Gigafact and Skeptical Science collaborate to create fact briefs
- Skeptical Science New Research for Week #14 2024
Comment Search Results
Search for feedbacks
Comments matching the search feedbacks:
- Shakun et al. Clarify the CO2-Temperature Lag
Ignorant Guy at 09:17 AM on 6 May, 2024DeeplyMoronic @158
I suspect that you misunderstands what "lag" is and how it is shown in the diagram you ask about.
First: It is not so simple that the horizontal displacement distance of the yellow curve and the blue curve is the time lag. The yellow 'curve' (collection of measurement points, rather than a curve) and the blue curve represents two quite different things (CO2 concentration vs temperature) and their respective scales are a bit arbitrary. They are selected to make the diagram easy to read with a glance. Imagine that the scale of the blue curve was selected so that it was much taller than the yellow curve. Then, if you assume that the horizontal distance was directly indicative of the lag, it would appear as the time delay was different, i e smaller. Just because of a change of scale.
Second: The concept 'lag' is a bit fuzzy. In this case we have one variable, representing a certain phenomenon, temperature, that depends on another variable , representing the phenomenon concentration of CO2. The temperature responds to changes in CO2 concentrations. This can be compared to signal theory where an out-signal responds to an in-signal. If the in-signal is a step then the out-signal is the step reponse. A typical step response starts immediately after the input but will take some time to reach its final value. In fact it will take some time before it's clearly visible - even if it really starts immediately.
See
https://en.wikipedia.org/wiki/Transient_response
and
https://en.wikipedia.org/wiki/Step_response
If the in-signal is not a perfect step (and in the real physical world it never is) then the response will look a bit more complicated and will take longer time to reach its final value.
Lots of physical system has this kind of behaviour. So in this case we have that when the CO2 concentration rather suddenly rises the temperature immediatly also start to rise, but the response takes quite a long time to finish. The climate is a very complicated physical system with all sorts of feedbacks and 'filter functions' involved so you should expect a diagram of past events to be a bit hard to read.
For our current situation we have a change in CO2 concentration that is not 'rather sudden' but very, very sudden. So we can expect that the temperature response will be visible a lot faster.
- Climate - the Movie: a hot mess of (c)old myths!
scaddenp at 06:38 AM on 3 April, 2024Two dog. The OHC content data in red comes from the Argo array. You can find reasonable description here. The old pentadecadal data is ship-based and has much bigger error bars. I cant immediately find the paper that determined the accuracy of the Argo data but if interested I am sure I dig it out.
On interannual and to some extent the decadal scales, variations in surface temperature are strongly influenced by ocean-atmosphere heat exchange, but I think you would agree that the increasing OHC rules that out as cause of global warming?
"I did also read that the warming effect of CO2 decreases as its concentration increases so the warming is expected to reduce over time. Is there any truth in that?"
Sort of - there is a square law. If radiation increase from 200-400 is say 4W/m2, then you have to increase from CO2 from 400 to 800ppm to get 8W/m2. However, that doesnt translate directly into "warming" because of feedbacks. Water vapour is powerful greenhouse gas and its concentration in the atmosphere is directly related to temperature. Also as temperature rises, albedo from ice decreases so less radiation is reflected back. Worse, over century level scales, all that ocean heat reduces the ability of the ocean to absorb CO2. From memory, half of emissions are currently being absorbed there. Hot enough and the oceans de-gas. These are the calculation which have to go into those climate models.
Which brings us to natural sources. Geothermal heat and waste heat are insignificant so would you agree that the only natural source of that extra heat would be the sun? Now impact of sun on temperature has multiple components that climate models take into account. These are:
1/ variations in energy emitted from the sun.
2/ screening by aerosols (natural or manmade). Important in 20th century variations you see.
3/ changes in albedo (especially ice and high cloud)
4/ The concentration of greenhouse gases in the atmosphere.
Now climate scientist would say that changes to all of those can account for all past natural climate change using known physics. They would also say very high confidence that 1/ to 3/ are not a significant part of current climate change (you can see the exact amount for each calculated in the IPCC report). Why are they confident? If you were climate scientist investigating those factors, what would you want to measure to investigate there effects? Seriously, think about that and how you might do such investigations.
Is it possible there is something we dont understand at play? Of course, but there is no evidence for other factors. You can explain past and present climate change with known figures so trying to invoke the unknown seems to be clutching at straws.
- A New 66 Million-Year History of Carbon Dioxide Offers Little Comfort for Today
nigelj at 05:38 AM on 13 December, 2023The information on earth system sensitivity of 5 - 8 degrees C is very sobering. There are many accounts of what a 6 degree world is like easily googled and its very inhospitable for humans and other species. Because ESS develops on long time frames we might adapt to some extent, but that doesn't really make it any less inhospitable.
This is one authors depiction of a 6 degree world based on available research. The description is based on such a world developing over the next couple of centuries and a failure to curb emissions, but even if it takes thousands of years as a result of ESS, many of the outcomes would be similar.
"Special coverage is given to the positive feedback mechanisms that could dramatically accelerate climate change. The book explains how the release of methane hydrate and the release of methane from melting permafrost could unleash a major extinction event. Carbon cycle feedbacks, the demise of coral, the destruction of the Amazon rainforest, and extreme desertification are also described, with five or six degrees of warming potentially leading to the complete uninhabitability of the tropics and subtropics, as well as extreme water and food shortages, possibly leading to mass migration of billions of people."
The IPCC seems to have focused most attention on warming and sea level rise rates by 2100. We have projections of around 3 degrees C of warming and worst case about 5 degrees, and SLR around 1 metre with a worst case 2 metres. The details on longer term trends several centuries into the future, or millenia into the future like earth system sensitivity, are buried away in their reports or not given much attention.
The IPCC have a chart buried in their reports showing a worst case of about 10 degrees C by about 2300 if equilibrium climate sensitivity turns out to be high and we just go on burning fossil fuels. Likewise by 2300 SLR could be well over 2 metres. This may be somewhat attenuated by the impacts of renewable energy already reducing projected coal use, but it would still be a big number and theres a lot of SLR already baked in even if we stop warming right now.
I wonder if this focus on year 2100 is a deliberate psychological strategy to focus on our immediate future. If they focused on the longer term trends there might be a risk that people would say why worry that won't effect me or my children.
However warming of for example 3 degrees by 2100 and one metre or so of SLR doesnt sound very scary to some people, while numbers like 5- 8 degrees longer term and SLR of 10 - 20 metres are obviously intuitively far more scary and certainly get my attention. Clearly we do need a focus on year 2100, for obvious reasons, because its in our lifetimes and adaptation would be very costly, but I wonder if a bit more attention on longer term time frames would have really shown people the huge scale of change we are facing.
- Skeptical Science New Research for Week #49 2023
nigelj at 04:35 AM on 10 December, 2023MS Sweet. Good information to know.
"I note that Dr. Hansen has long held an Earth System Sensitivity of 6 C. The IPCC consensus has been 3C"
The IPCC number is "equilibrium climate sensitivity", a different thing from earth system sensativity as below. Making it hard to compare the two numbers.
"By definition, equilibrium climate sensitivity does not include feedbacks that take millennia to emerge, such as long-term changes in Earth's albedo because of changes in ice sheets and vegetation. It includes the slow response of the deep oceans' warming, which also takes millennia, and so ECS fails to reflect the actual future warming that would occur if CO2 is stabilized at double pre-industrial values.[38] Earth system sensitivity (ESS) incorporates the effects of these slower feedback loops, such as the change in Earth's albedo from the melting of large continental ice sheets, which covered much of the Northern Hemisphere during the Last Glacial Maximum and still cover Greenland and Antarctica)...."
(Climate sensitivity, wikipedia)
We will probably never know any of these numbers for sure because you can't put the planet in the laboratory. (Although I think paleo studies like the one you posted have a lot of credibility - because they are based on real world conditions). But IMHO that uncertainty is not necessarily a crucial problem. Current rates of warming are bad and are having very visible effects, and huge implicatrion in the short to medium term, and so whatever the level of climate sensitivity using whatever definition, we clearly have a huge problem.
- Skeptical Science New Research for Week #49 2023
michael sweet at 01:16 AM on 10 December, 2023This MSN article, Which is apparently a press release from the Columbia Climate school describes a paper in Science. The paper is a collaboration of many scientists summarizing knowledge of CO2 concentrations for the past 65 million years. The MSN article is easy to read. Since it is a press release it would be a good OP here at SkS. I have not yet read the paper.
Unfortunately, they conclude that Earth system sensitivity, the climate response when all slow feedbacks respond, is 5-8 C. The processes involved can take a long time to equilibrate (as much as thousands of years). Still, it is a very grim conclusion. I note that Dr. Hansen has long held an Earth System Sensitivity of 6 C. The IPCC consensus has been 3C. This is unlikely to affect anyone living but bodes very bad for 1000 years from now. The question of how long the slow processes take to equilibrate is left unanswered.
- CO2 effect is saturated
MA Rodger at 18:47 PM on 27 October, 2023chuck22 @709,
I would suggest it is more that Venus shows what a thick atmosphere does to climate while Mars shows it for a thin atmosphere. Both have an atmosphere comprising about 95% CO2. Yet the surface of Mars has zero GH-warming while on Venus it is an impressive +407ºC.
Venus has about 80% of the solar warning relative to Earth, this due to its higher albedo (left hand graphic below) which more than compensates for being closer to the Sun. Thus the "naked planet" temperature for Venus (230K) is lower that Earth's (254K). Venus has a 92 bar atmosphere and the clouds in such a thick atmosphere are a major insulation mechanism preventing IR across the entire spectrum from escaping to space from anywhere near the surface.

Zhong & Haig (2013) show (their Fig6b) that the climate forcing on Earth from CO2 (which at 389ppm provides with feedbacks GH-warming of +34ºC) would be perhaps trebled by CO2 levels up near the 90% mark, (Fig6b shows the direct forcing up to ~30% CO2) an unrealistically high level, but it does show that additional CO2 does not "saturate".
- Hansen predicted the West Side Highway would be underwater
daveburton at 17:24 PM on 5 July, 2023One Planet, why are you asking me "about the human origins of global warming"? My comment had nothing to do with that.
As for your first indented question, it appears that you've made two unjustifiable assumptions:
Assumption #1: You assume that there's such a thing as "a locked-in doubling of CO2."
If I understand you correctly, that means you think CO2 added to the atmosphere just stays "locked in" there, forever, and the longer we add CO2 to the air the higher the level will rise. Is that what you think?
If that's what you think, you're mistaken. CO2 doesn't just stay in the atmosphere. Nature is rapidly removing CO2 from the air, into other carbon reservoirs. The only reason the atmospheric CO2 level is nevertheless rising instead of falling is that we're adding CO2 to the air even faster than nature is removing it.
But it's becoming harder and harder to keep up with natural CO2 removals, because they're accelerating. This is an excerpt from AR6 WG1 Table 5.1, showing how the removals are accelerating:
LINK (Note: 1 PgC = 0.46962 ppmv = 3.66419 Gt CO2.)
At the current 420 ppmv level (i.e., 135-140 ppmv above a 280-285 ppmv baseline), those negative feedbacks already remove an average of about 5.5 PgC per year (= about 2.6 ppmv), and for each 20-25 ppmv increase in atmospheric CO2 concentration those removals accelerate by another 1 PgC/year.
With our current emission rate, the CO2 level is only rising by about 5.1 PgC/year (+2.4 ppmv). So it won't take much of a CO2 level increase before natural removals match our current emission rate: just (20 to 25 ppmv/PgC) × 5.1 PgC = (102 to 128) ppmv.
420 + (102 to 128) = 522 to 548 ppmv. That's the "plateau level" beyond which the atmospheric CO2 level cannot rise, unless our emissions increase further. If we were to continue our current anthropogenic emission rate indefinitely (or until the coal runs out), we'd still not quite reach 560 ppmv.
Assumption #2: You seem to think that the CO2 level controls sea-level. But the data do not support that assumption. Most coastal measurement sites have seen negligible acceleration in sea-level trend over the last century, even as the atmospheric CO2 level rose by 115 ppmv.
Here are the best long U.S. Atlantic and Pacific measurement records, respectively:
https://sealevel.info/MSL_graph.php?id=Battery&c_date=1923/6-2024/12
https://sealevel.info/MSL_graph.php?id=Honolulu&c_date=1923/6-2024/12
Both show a statistically insiginficant acceleration of 0.006 mm/yr² (± at least twice that) over the last century.
Hogarth studied many long measurement records, and concluded, "Sea level acceleration from extended tide gauge data converges on 0.01 mm/yr²"
That's very, very slight.
To calculate the effect of that acceleration use the following quadradic formula:
y = B + M·x + (A/2)·x²
where:
x is elapsed time
y is position or sea-level after time x
B is initial position or sea-level
M is current rate
A is acceleration
So (choosing some fairly typical values) if:
M = 1.5 mm/yr
A = 0.01 mm/yr²
x = 100 yrs
And if the trends were to continue:
y = B + 100·1.5 + (0.01/2)·100²
= B + 150 + 0.005·10000
= B + 150 + 50
= 200 mm = 7.9 inches
6" of that 8" is from the linear trend, and 2" of that 8" is due to acceleration.
However, there's a subtle twist. When acceleration is estimated by quadratic regression, we're fitting a quadratic curve to the measurement record to date. Extending that curve is the projection. But the curve's slope matches the linear tread at the midpoint, not at the end.
So, to find y (sea-level) 100 years from NOW, we should use x = 100+(L/2), where L is length of the measurement record.
So if we have a 100 year measurement record, to calculate the accumulated effect of the acceleration 100 years from now we should use x=150, not x=100.
Remember our formula:
y = B + M·x + (A/2)·x²
That last term is the effect of acceleration; using x=150 we get:
(A/2)·x² = 0.005·150² = 0.005·22500 = 112.5 mm = 4.4 inches.
So, an acceleration of 0.01 mm/year² is still negligible, but it's a "slightly bigger negligible."
A warming climate is know to have effects which both increase and decrease sea-level. Based on the negligible effect that the last century's CO2 increase and consenquent warming has had on sea-level trends, it is clear that, so far, the effects which increase and decrease sea-level must be similar in magnitude, and roughly cancelling.
So the assumption that a particular CO2 level "locks in" a particular sea-level is not justifiable. - Why the food system is the next frontier in climate action
One Planet Only Forever at 03:08 AM on 2 May, 2023Evan @6,
I briefly reviewed the 2014 Research Article you pointed/linked to (note it is almost 10 years old). I would update my previous comments to add that human actions causing increased N2O in the nitrogen cycle are to be considered the same way I refer to impacts on the carbon cycle. And I would add that there are other good reasons for more aggressive reduction of nitrogen cycle impacts than climate change (refer to Planetary Boundaries).
I will also clarify that reducing methane emissions from rice is still an opportunity for reducing the peak level of ghg impacts even if that methane could be considered to be ‘part of the natural carbon cycle (an action that does not increase the amount of carbon in the carbon cycle the way that burning fossil fuels or leaks of methane from fossil fuel operations or permafrost melting do).
More specifically, the report’s evaluated floor level of non-CO2 emissions from food production and consumption (Global total 7 GtCO2e/year by 2050 with more if population continues to grow beyond 2050 and also influenced by 'potential changes of attitudes towards being less harmful') appears to be based on the perceived willingness of the UK population, at the time the report was prepared, to learn and be less harmful consumers. And the evaluated UK willingness is extended globally with all people expected to want develop to live in ways comparable to the less harmful ways that the UK population was evaluated to be willing to live.
The following is a quote from the “Options and barriers to mitigating food system non-CO2 emissions - Agriculture” section of the Research Article:
“For both N2O and CH4, socioeconomic and environmental circumstances dictate the extent to which changed agricultural technologies and practices can deliver cuts in emissions at a systems level. Stakeholders suggested that important factors influencing uptake of mitigation options affecting the UK revolve around cost, dominant practices, the aging farming community and attitudes of ‘young farmers’, existing infrastructure, cultural norms, changing climate as well as a feedback linked to levels and patterns of consumption.”
A quote from the “Options and barriers to mitigating food system non-CO2 emissions - Consumption” section of the Research Article:
“Within the UK consumption-based scenarios, the most significant dietary change considered was a 70% per capita cut in meat consumption, with the deficit replaced with rises in other food types. However, even with changes to per capita meat consumption, absolute emissions levels are driven by population growth (consistent across the scenarios) as well as growth in per capita consumption levels. Population growth per se strongly constrains N2O mitigation, as crops for consumption and for feed for livestock continue to require manure or mineral fertilizer. Barriers to changing patterns of consumption are confirmed through consumer focus group analysis: moderate changes in meat consumption (20% per capita) were considered in line with financial pressures to reduce expenditure given the context of the 2009–2012 recession, whereas a 70% reduction was perceived too substantial a change for many [Citation33].”
That indicates that the evaluation was (likely unwittingly) biased by accepting questionable opinions like ‘the higher cost of being less harmful is a valid reason to be more harmful’ and ‘the developed popularity of eating more meat is a valid reason to not reduce meat consumption’. Note that I tried to present both of those points in a way that highlights that populist political misleading messaging significantly caused those attitudes to develop to be so influential that they compromise the evaluation and the way it is reported.
Quote from “Discussion - Implications for cumulative GHG emissions”
“Finding ways of reliably reducing non-CO2 emissions will become increasingly pressing as global demand for food rises. A wide range of feasible CH4 mitigation options were put forward by stakeholders, taken from the literature and quantitatively assessed during the scenario process, providing evidence for greater scope for achieving substantial CH4 mitigation than for N2O. This, coupled with the much longer lifetime of N2O compared with CH4 as well as the influence of carbon cycle feedbacks in raising the GWP of CH4 from 21 to 34, highlights the critical importance of fully exploiting CH4 mitigation potential whilst increasing the research effort towards developing agricultural systems that can minimize N2O production.”
That indicates that if the developed research bias is corrected there could be more reduction of N2O resulting in a lower ‘floor level’.
Quote from “Discussion - Implications for managing and mitigating CO2”
“The focus here on non-CO2 reinforces other studies that identify the existence of an emissions floor, further emphasizing an urgent need to mitigate CO2 emissions where it is most feasible and quickest to do so. The higher the non-CO2 floor, the more rapidly CO2 emission cuts are needed within the constraints of a chosen climate target. Conversely, relying on a low or non-existent emissions floor suggests a larger CO2 budget is available, again relaxing the rates of mitigation for a chosen climate change target, delivering a more palatable but less realistic assessment of the climate change challenge.”
This emphasizes that the learning from the report is that more rapid efforts to reduce fossil fuel use are required.
Quotes from the “Conclusion” of the research article:
“A continuation of absolute growth in global N2O emissions, despite assuming optimistic mitigation has, because of cumulative emissions, direct implications for how urgently and deeply to cut both CO2 and CH4 for an assumed climate target.”
This reinforces the need for more research to reduce N2O and the need to more aggressively cut CO2 and CH4 unless new research develops viable ways to rapidly reduce N2O.
“As energy systems become decarbonized, global non-CO2 emissions largely associated with food consumption and production will increase in the share of annually produced GHGs. Emphasizing the importance of making cuts in food-related emissions highlights an urgent need for policymakers in Annex B nations to consider not only technological and supply-side interventions, but tackle the thorny issue of levels and types of consumption. Unlike large-scale infrastructure developments, measures tackling consumption and demand have the potential to cut emissions of CO2 and non-CO2 alike in the short term and could improve the diminishing chances of remaining within the carbon budget commensurate with the 2ーC threshold.”
That highlights the need for policymakers to “tackle the thorny issue of levels and types of consumption” because the reports conclusion is that current over-developed populations are not as willing to be less harmful as they should be.
A quote from the “Future perspectives” part of the research article:
“If the challenges posed by climate change are to be overcome, at least in part, a meeting of minds to define problems can offer new, much needed insights. This is already emerging in some quarters, with an increase in interest from research funders around the food–water–energy nexus as well as a rise in the number of researchers keen to engage in genuinely interdisciplinary activity. Of course disciplinary research may, out of necessity, continue to dominate, but the emerging expertise in interdisciplinary research needs support and encouragement given the extent of the systemic and complex challenges facing society.
"The climate change challenge becomes ever more urgent each year, with time limiting the options available for mitigating emissions to be largely those that can deliver change in the short term. Perhaps with agronomists, biologists, engineers, political and social scientists working increasingly in single units, systemic ‘solutions’ to the climate challenge can be found. Specialists in demand and consumption require the same prominence in the portfolio of research endeavour as technologists, physical scientists and engineers. Only then will resilient options be derived and ultimately implemented in a timescale befitting of the scale of change facing society.”
- There is no consensus
Rob Honeycutt at 10:03 AM on 20 April, 2023@931... "This puts them in category 2 or 3 and not category 5,6 or 7."
Nope.
Rejecting well established feedbacks in favor of an unsupportable idea that ECS is 1.2°C is clearly minimizing human contribution since it's abundantly obvious that CS is higher just based on warming to date.
- There is no consensus
Albert at 09:26 AM on 20 April, 2023"Dismissing feedbacks is an assertion of blind faith in the face of overwhelming evidence to the contrary. You just have to read the body of research."
I haven't dismissed any feedbacks, only the belief that they can be accurately measured. Many scientists believe that the positive feedback theory because of any temperature change in the atmosphere is grossly overstated and some even think the feedback is negative.
The only "evidence" for the positive feedback theory are models which are trying to model something where many variables are only guesstimates.
I programmed process computers for over 20 years and have a reasonable understanding of how models work.
If you you gave me the source code and runtime variable values of any model that purports to ""prove" positive feedback theory, I could show you in a short period of time that by adjusting these variables, any desired output could be achieved.
- There is no consensus
Rob Honeycutt at 00:52 AM on 20 April, 2023Albert @920... "...but if you believe that feedbacks are "well known" pleas provide an exampl that is not ambiguous."
a) You've accepted that the direct effect from doubling CO2 would cause 1.2°C of warming, therefore there would be some loss of ice cover and some increase in water vapor, both producing additional warming.
b) We have currently raised CO2 levels by about 50% and already seen about 1.2°C of warming in the modern era.
c) Such low ECS figures would mean the earth's climate should be almost perfectly stable over geologic time (no glacial-interglacial cycles) and we know that's not true.
d) CO2+feedbacks (~3°C) explain a great many other geologic effects related to temperature including the gradual fall in global temp over the past 60my.
Dismissing feedbacks is an assertion of blind faith in the face of overwhelming evidence to the contrary. You just have to read the body of research.
- There is no consensus
Eclectic at 23:28 PM on 19 April, 2023Albert @921 & other posts ,
Evidently, you have not read the second part of the Cook 2013 paper, where it clearly shows your "1.6%" figure is so grossly wrong about the consensus. So grossly wrong, that it is difficult to believe you are being serious.
Likewise, you seem suspiciously uneducated about feedbacks/ runaways.
Just to throw you a bone : note that the global surface temperature has increased ~1.2 degreesC over about 170 years & an atmospheric CO2 rise of 50%. Try your math on that.
- There is no consensus
Albert at 20:54 PM on 19 April, 2023"The direct effect from CO2 is, as you say, ~1.2°C but you can't just reject physics and say there wouldn't be feedbacks. The feedbacks are very well known"
Not true. Even a basic knowledge of the complexity of modelling feedback would tll that it is impossible to model or prove.
it cannot be replicated in the lab or models, and any so called proof can easily be shown to be nit true.
if you know the basics of feedback theory you would know that the output to any given input has to be known precisely otherwise you cannot determine anything.
To give just one example, increased evaporation causes clouds and precipitation and there Are many scientists who believe that the feedback can only be negative or else there would be an exerthermic runaway.
but if you believe that feedbacks are "well known" pleas provide an exampl that is not ambiguous.
- There is no consensus
Rob Honeycutt at 14:35 PM on 19 April, 2023And... "Skeptics believe in the direct effect of CO2 causing an ECS of about 1.2C but reject the positive feedback theory pushing ECS to 3C and beyond."
Actually, that would be a denial position. You'd have to throw out an enormous body of research to come to such an absurd conclusion.
The direct effect from CO2 is, as you say, ~1.2°C but you can't just reject physics and say there wouldn't be feedbacks. The feedbacks are very well known.
- CO2 effect is saturated
Rob Honeycutt at 01:04 AM on 25 March, 2023Gootmud... Reading through that Happer paper is interesting in that they're essentially confirming the consensus position on man-made climate change is correct. Their climate sensitivity figure of 1.4K is the direct effect without water vapor feedback. The 2.9K is with WV feedback per M&W1967, and the 2.2K figure is with updated calculations for WV.
So, why is that 2.2K figure so much lower than the central estimates of ~2.9K/2xCO2? Well, there are other feedbacks that are not included in Happer's calculations, like ice sheet feedbacks.
This paper is a good demonstration that Happer knows the climte science is correct but he continues to speak out against it, ostensibly in order to instill doubt in the research.
Why? If you up for a little light reading, try Oreskes/Conway's The Merchants of Doubt. (Hint: it's not really about the science.)
It's also important to note, the warming we've seen over the past 60 years is largely in line with central estimates for climate sensitivity. We've increased CO2 by about 50% and we seem committed to around 1.5°C of warming. The numbers kind of work, unfortunately.
- CO2 effect is saturated
Bob Loblaw at 00:19 AM on 25 March, 2023Gootmud @ 680 - you said:
An excited CO2 molecule will lose its energy by bumping into an N2 or O2 molecule before it can radiate it away. Around the tropopause there's a laser effect, in which CO2 radiation stimulates other CO2 molecules to emit their own radiation, so more CO2 means more radiation transfer.
To expand on what MA Rodger says in comment 684, your first sentence is almost correct. Nearly all absorbed radiation energy will be lost thermally to surrounding molecules - but a very small proportion will be emitted as radiation again. As has been mentioned in previous comments here, there is a good description of the time constants involved at Eli Rabett's blog.
Your second sentence is not so correct. Nearly all energy that is used to emit radiation in the atmosphere comes from the reverse of your first sentence: CO2 or other greenhouse gas molecules gain energy by collision with other molecules. Again, most of that will be lost by thermal collisions with other molecules, but a small amount will be emitted as radiation. As the temperature rises, more thermal energy is transferred by collisions, and more will be emitted as radiation.
This dance between IR absorption, thermal collisions, and IR emission occurs at all levels in the atmosphere, not just the tropopause.. At each level, the exact quantities in each energy flow will depend on local temperature. You also get vertical energy transfer through convection. The overall temperature profile depends on a balance of all these energy flows.
All this is incorporated into climate models. It is not news.
The feedback question is important - distinguishing the "no feedbacks" response to doubling CO2 from the total response when proper feedbacks are included.
I suggest you read a previous comment of mine in this thread for more information and links to two relevant papers from the 1960s. (Like I said: this is not news.)
- CO2 effect is saturated
Eclectic at 16:18 PM on 24 March, 2023Gootmud @680 ,
The explanation of "Greenhouse" by Rob Honeycutt @681 is basic and straightforward, if you stop to think it through. And yet a vast number of climate-science-deniers completely fail to understand the concept (most likely because they wish to stay in denial mode).
You are right that the eminent Dr Happer (et Wijngaarden) has re-invented the wheel, and finds that all the climate scientists are correct about the climate sensitivity of atmospheric CO2 as being (roughly) 1.2 degC for CO2 change alone, without feedbacks. Here, we definitely should trust the experts.
Strangely, most of the denizens at WattsUpWithThat blog (and similar) are giving out the impression that Happer has shown them (the denialists) to be right and all the climate scientists to be wrong. Very strange indeed. Perhaps they (the denialists) are not actually reading/understanding Happer's confirmation of previously-known climate science ~ I suspect they they are in sympathy with Happer's extremist wingnut politics (which he makes no effort to hide).
Probably they are using wishful thinking, in that they use the faulty paradigm : 'Happer is an eminent scientist and he is "one of us wingnuts" ~ and therefore the mainstream scientists must be wrong.' [~ Which does not compute.]
(B) Gootmud , I must beg you to tell more about this idea you present about a CO2 laser effect at the tropopause level. I have not heard of this before (unless it is something to do with a certain notorious Congresswoman who talks of Jewish Space Lasers ).
- The Big Picture
MA Rodger at 02:20 AM on 20 March, 2023Gootmud @109,
CO2 will not "saturate" prior to the planet warming to ridiculously high levels. The potential for some magic negative feedbacks to counteract further GHG warming or for some magnetic field effect to appear is lower enough to be ignorable. And I don't see why you need complex models to tell you that.
- It's not urgent
Rob Honeycutt at 08:14 AM on 9 March, 2023Hm... Yeah, those are quotes from 2019 and I think she's probably conflating two issues. One being the likelihood of staying below 1.5°C or 2°C, and the other being the likelihood of setting off irreversible feedbacks. To my understanding, they're two different issues with very different confidence levels.
- It's not urgent
Rob Honeycutt at 07:22 AM on 9 March, 2023PM @17... Would you have the precise quote from Thunberg's book related to "50% chance of runaway greenhouse effects beyond human control at 2°C"?
My suspicion is that's not an entirely correct assessment, though I'm confident Thunberg's book went through a thorough review by researchers prior to publication. My understanding is, past 2°C we move into a realm of much greater uncertainties. Also, even at 2°C significant feedbacks (say, from methane releases) remain long tail uncertainties. But I could be wrong.
- It's not urgent
MA Rodger at 00:37 AM on 9 March, 2023EddieEvans @13,
The net carbon sink into the oceans is far more predictable than the carbon interchange in/out of the biosphere. There is still some uncertainty and re-assessment (eg Watson et al 2020) in the matter but generally the only big variable is the ocean surface temperatures. So as long as we prevent massive SST rises, I would think it is safe to say "the global ocean will continue to act as a viable carbon sink." The actual size of that sink over the coming millennium will thus depend on how well we do preventing AGW but otherwise it's size is fairly predictable. What is far less predictable under AGW is the biosphere as a source/sink.
You also raise the threat of methane, this usually focusing on natural feedbacks and the melting permafrost. In the past I was rather worried by the poor coverage of this subject in the scientific literature but having dug into the subject I now feel more comfortable about it. Additionally the absence of significant methane fluxes resulting from the significant permafrost melt in recent decades is a reassuring sign.
- 2023 SkS Weekly Climate Change & Global Warming News Roundup #5
Rob Honeycutt at 01:55 AM on 9 February, 2023Eddie and Slum... Are you both aware that the 2°C limit is at least partially predicated on the fact that was how warm the Eemian interglacial got? There are reasonable assumptions that under 2°C the climate system would not set off feedbacks that send us toward far higher temps. There are also reasonable assumptions that the actions that are taking place can put us on a path to keep the earth at or below 2°C.
The challenge before us (humanity) is truly massive. Yelling that the ship isn't turning fast enough doesn't change its direction. Real energy solutions do. Positive support for those solutions does. Barring the use of private jets does vitually nothing. Putting a price on carbon so that flying in those jets comes in line with the damages they impose, along with all other FF uses, does.
The technical solutions for successfully transitioning off of FF's are already here. They're continually being improved upon. Spreading rhetoric that the game is already lost is doing the bidding of the FF's industry, because when people believe all is lost they give up trying. And that's exactly what the FF's industry wants.
- 2023 SkS Weekly Climate Change & Global Warming News Roundup #2
One Planet Only Forever at 15:35 PM on 25 January, 2023I have been an interested follower of this discussion. I am optimistic about humanity in the long term, but pessimistic about the short term.
My current understanding is that when the Keeling Curve levels off, when human activity is no longer causing CO2 levels to increase, there should not be a significant further increase of the global average surface temperature.
However, I also understand that increasing temperatures will activate feedback mechanisms that will increase CO2 levels. Therefore, before the Keeling Curve is levelled off, any activated feedback mechanisms will require more reduction of human impacts than would have been required before the feedbacks were triggered. In other words, more warming makes it harder for humans to reduce human impacts enough to ‘level-off the Keeling Curve’ (get to net-zero).
Also, the science (from decades ago) indicates that warming above 1.0 C risks significant harm (now proven). And warming beyond 2.0 C is considered to be very risky (hopefully never proven). That understanding is the basis for the 1.5 C objective that is paired with the need to limit the peak impact level to less than 2.0 C. (Refer to the Story of the Week “1.5 and 2°C: A Journey Through the Temperature Target That Haunts the World” in the “2022 SkS Weekly Climate Change & Global Warming News Roundup #50”)
Developed governing economic ideology is justifiably questioned. The short term competitive pursuit of status interests over-powering the reduction of harm is detrimental to the global future of humanity. Also, the perceived need for constant growth of activity that is perceived to be profitable develops harmful results.
The removal of excess CO2, levels above 1.5 C impacts, is now almost certain to be required. CO2 impacts exceeding 1.5 C are ‘in the pipeline’ because it will take time to correct the current harmfully over-developed activity that is the result of a lack of actions to limit impacts through the past 30 years. And the marketplace will not naturally develop CO2 removal to bring peak human impacts back down to 1.5 C levels because that will never be a profitable activity. External governing will be required to make it happen.
External governing of economic activity will also be required to limit the amount that impacts exceed 1.5 C before they are drawn back down. A key understanding is that the area under the global average temperature curve needs to be minimized to limit the future challenges. The more that 1.5 C level of impacts is exceeded the more harm is done. The longer the 1.5 C level is exceeded the more harm is done. But the required changes of the developed governing socioeconomic-political systems are contrary to ‘popular developed socioeconomic ideology and the developed status-quo’.
So, in my comment @2 I expressed optimism about the long term future of humanity. However, I am also pessimistic about how harmful the impacts of the ‘over-developed harmful marketplace system fuelled by marketing that is focused on promoting positive impressions’ will be before that system is corrected (I made a similar point in my comment @4 on the SkS item “Can induction stoves convince home cooks to give up gas?”). That pessimism will be reduced when a significant amount of ‘unprofitable’ CO2 removal facilities are operating. The sooner those ‘correction of harm done’ facilities are operating the sooner there is justification for optimism that there will be a sustained improving future for humanity.
Many of the supposedly highest status people today are obliged to pay for carbon removal facilities to be built and operated in the current day. That activity cannot ethically be pushed off to be a ‘future, development that will continue to face reluctance to be implemented because it is not profitable’. And it is important for those ‘unpopular and unprofitable’ facilities to be almost certain to be harmless. Less expensive and ‘more harmful in other ways’ ways of appearing to reduce the harm of CO2 need to be understood to be unacceptable. It is important to see evidence of leadership pursuing the limiting of harm done, not claiming to be reducing harm done by actions that are harmful in other ways. All harmful impacts need to be limited to sustainable Planetary Boundary levels of impact, not just CO2.
Therefore, I am hopeful and optimistic about the long term future of humanity. But I am skeptical/pessimistic regarding how soon there will be evidence to support that optimism. I am justifiably concerned about how much harm will be done that future generations have to overcome in order to develop sustainable improvements. Sustainable improvements can be achieved almost Forever within the Boundaries of this One Amazing Planet if that is a governing objective, which it really should be.
- 2023 SkS Weekly Climate Change & Global Warming News Roundup #2
Evan at 04:54 AM on 25 January, 2023Rob,
"Based on more recent research it's far from certain and may not be correct at all."
Can you provide a reference to recent research that is downplaying the effect of feedbacks?
- 2023 SkS Weekly Climate Change & Global Warming News Roundup #2
Rob Honeycutt at 02:07 AM on 25 January, 2023Evan... I was being sarcastic by inferring a complete collapse of modern civilization would also bring us to net zero.
This is the element of your statements that I'm challenging here: "...even if we reduce our emissions that feedbacks in the system may continue to drive the Keeling Curve upwards..."
Two years ago I would have agreed. Based on more recent research it's far from certain and may not be correct at all.
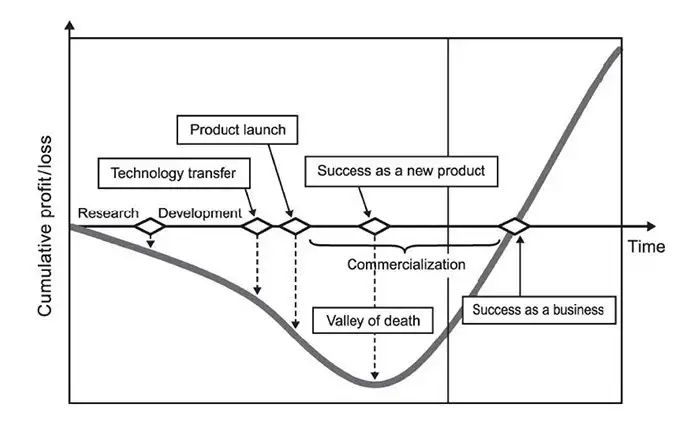
I think one other thing history teaches us is that early research is slow, difficult and costly (and that's where we've been). But once we get to a cost effective point markets can scale very quickly (and that's where we're headed). This very moment in history we are probaly at the inflection point between those two.
Renewable energy markets have been ploughing through R/D, getting through the expensive Valley of Death, and are now emerging with highly profitable businesses. I think the challenges in the coming 30 years are going to be more related to resource availability over carbon emissions. Those are infinitely better challenges for humanity to face over a civilization ending 4°C+ planet.
- 2023 SkS Weekly Climate Change & Global Warming News Roundup #2
Evan at 12:43 PM on 24 January, 2023I'm not sure on what basis you say that we will get to net zero emissions. Yes, airplanes eventually run out of gas and crash. If that's what you're referring to, then it is a moot point. When we talk about getting to net zero emissions I am framing it in the context of doing so while simultaneously preserving something that resembles our current civilization. That represents a planned landing, not a crash.
The problem with talking about net zero emissions is that this is only one component of what drives the Keeling Curve. I originally responded in this thread to the issue of whether there is effectively warming in the pipeline. That is governed by the behavior of the Keeling Curve. Even if we get our emissions to 0, we may have already triggered feedbacks that cause atmospheric CO2 to continue to rise. That is, the longer we delay, the less we are able to affect the behavior of the Keeling Curve.
Long story short, given the difficulty of reducing our emissions, and given that even if we reduce our emissions that feedbacks in the system may continue to drive the Keeling Curve upwards, I think it a far safer bet to assume that there is warming in the pipeline equivalent to the current atmospheric CO2 concentrations. It's been 35 years since the IPCC was established, and if history has taught us anything, it takes far longer than people project to bring about the kind of change needed to reach net zero emissions.
- 2022 SkS Weekly Climate Change & Global Warming News Roundup #45
Bob Loblaw at 05:26 AM on 15 November, 2022To illustrate my comment at 18, about time lags, let's consider a very simple case, where we can treat the earth as a zero-dimensional point with an instantaneous addition of CO2 to cause a 4 W/m2 imbalance in the global radiation balance. (This is a number typically associated with a doubling of CO2.)
This imbalance represents a positive energy input that will warm the system. It will not warm it instantaneously, though - we need to account for the heat capacity. (Yes, a point can have a heat capacity, just like calculus tells us a line can have a slope at a point.)
We will consider three heat capacities:
- Just the atmosphere.
- Oceans, but just to a depth of 60m (the mixed ocean layer)
- Oceans to a depth of 2000m.
The low heat capacity of the atmosphere would allow rapid heating. Each addition of ocean mass slows the heating.
This is what we'd see as heating rates for those three scenarios:

We see that if the atmosphere was the only thing heating, we'd be done in less than a year. We see the system reaching equilibrium, with a warming of about 3C. (I have tuned the model's albedo and water vapour feedbacks to get that 3C result.)
Adding the ocean mixed layer slows things down quite a bit, but we still reach equilibrium in roughly 10,000 days (about 30 years). Adding deep oceans really slows things down - we're still far from equilibrium at the end of the graph.
As the system heats, the radiative imbalance decreases. Those values are in the following graph. Atmosphere-only equilibrates quickly; ocean versions more slowly.

The shape and relative position of the three lines in each graph would not change if you did a 2W/m2 initial imbalance, or changed the model sensitivity - it depends on the heat capacity used.
Of course, the real world is more complex. You are not heating a single mass, and the atmosphere, land and oceans have transport between them (and transport to different parts within them). You can't include that in a zero-D model, though.
More importantly, we are not dealing with an instantaneous increase in CO2. It is gradually increasing. We can add those things sequentially over time, though:
- In year one, we add some CO2. The atmosphere reacts quickly, but the oceans react slowly. We still have some warming waiting "in the system".
- In year 2, we add more CO2. Again, the atmosphere reacts quickly, the oceans more slowly - and we also have the heating still going on from year one's "ocean lag".
- In year 3, we get another increase in CO2. Another rapid atmosphere warming, and some slower ocean arming from this year's CO2, plus a one-year lag form last year's ocean heating, and a two-year-lag from the first year's ocean heating.
- ...and so on.
What you can't do is assume that the temperature rise after 30 years is just the year one CO2 value after a 30-year ocean lag. CO2 has been increasing since then, with 29, 28, 27, 26 etc. years of heating since it was added.
- 2022 SkS Weekly Climate Change & Global Warming News Roundup #45
Bob Loblaw at 02:40 AM on 14 November, 2022Wayne:
The opening section of the post gives a link to a Carbon Brief article that discusses this. (Well, to pick a nit, it links to it three times...)
Perhaps you could look at it and tell us what you disagree with?
They considered the following. The first three items would seem to address your concerns.
- The estimate of global warming up to the present day;
- The assumed future warming from emissions of non-CO2 forcings such as methane and black carbon and the reduction of cooling sulphate emissions;
- The amount of warming still in the pipeline once emissions are brought back to zero;
- The ratio between cumulative CO2 emissions and global warming (also known as the transient climate response to cumulative carbon emissions, or “TCRE”); and
- The extra emissions from Earth system processes or feedbacks that are typically not included in the models used to make these estimates, such as thawing permafrost.
- No, a cherry-picked analysis doesn’t demonstrate that we’re not in a climate crisis
nigelj at 07:59 AM on 8 October, 2022Sea level rise appears to be following a quadratic (parabolic) curve. Perhaps this is not surprising because steadly increasing and accumulating CO2 levels in the atmophere and known positive feedbacks causing the warming trend, would be consistent with a parabolic function, and not so much a linear or exponential function. But if antarctic ice sheets physically destabilise that could be a local exponential function.
- How not to solve the climate change problem
Eclectic at 11:55 AM on 29 August, 2022Scvblwxq1 , your assertions [not-quite-arguments] are going off all over the place ~ and are missing the target. And missing the more appropriate threads, too.
The 20% figure you mention is cherrypicked from the Environmental Defense Fund ~ other reports/studies point to figures like 8% and 10% . . . and even those are based on short-term periods, and do not look at the bigger picture. Does it not occur to you that the Environmental Defense Fund has an advocacy role and might be doing its own cherrypicking? You yourself should be taking a more skeptical view, and be examining evidence/data in a more thorough and nuanced manner.
Your CO2 growth figures of 2ppm and 80ppm demonstrate your wildly inaccurate arithmetic, and your lack of understanding the basics.
Your "migration" argument is unscientific. What can we really conclude about rich elderly Noo Yorkers retiring to Florida? Or some Wisconsinites & Michiganders moving south to the warmer Texas . . . while Mexicans & others are moving north to the cooler Texas ;-)
Sun energy and cloud feedbacks are issues again pointing to your needing to educate yourself about these basics.
I suggest it would be logical for you to study the practicalities of reducing the 75% bulk of fossil-derived CO2.
- There's no tropospheric hot spot
MA Rodger at 01:01 AM on 23 August, 2022Cedders @33,
On boosting search rankings, the promotion from page 1,000 up to page 900 because a URL is used a single timesomewhere on the inerweb in my view is not very significant. If you want to give your webpage a proper boost, you'd use other means. But saying that, I do get criticised occasionally for using denialist URLs and thus boosting their rankings (and I am no expert in the matter). You can apparently make such a use without any boost whatever using the 'nofollow' extention in the HTML of a URL (but I'm not sure how you'd use that in the SkS URL inserter).
On the URL content, I haven't looked down that URL yet. And it is useful to take the whole argument thus presented (so I 'look forward' to all 24 pages of it) as one approach to dismissing a difficult bit of debunking is to point to all the obvious nonsense argued alongside the difficult debunking. This is of course an ad homenem logical argument but without the difficulty being resolved (one way or the other) it is not in any way a logical fallacy.
On atmospheric cooling from CO2, the equilibrium in the energy balance will be restored following a CO2 forcing. This would result in the troposphere warming by +1ºC per 2xCO2 increase (without feedbacks) which will act over the whole blackbody emissions spectrum of 7.5 to 100 microns, this balancing the +3.7Wm^-2 forcing from the CO2.
When it comes to the CO2 forcing itself, CO2 emissions only acts over a small part of the global emissions spectrum. See fig 5b3 of that useful paper Zhong & Haig (2013) 'The greenhouse effect and carbon dioxide' which shows the spectrum of a CO2 increase 389ppm to 878ppm (2xCO2 from 2013) and how the central micron of the emissions are already past the tropopause and thus cooling the planet rather than warming it. Thus the 3.7Wm^-2 CO2 forcing comes from a rather narrow part of the spectrum 13¼ micron to 16¾ micron (less that central 14½ to 15½ now operating to cool the planet). To make this narrow band have such a big effect, it has to result from a cooling of the emissions altitude, a cooling far bigger than the average that would be required over the full blackbody spectrum. So that emissions altitude increases on average enough to perhaps give you 10ºC drop in temperature.
Do note that the CO2 emissions will be reaching space from vastly different altitudes. The central part of the emissions are up in the stratosphere while the edges of the emissions will be low down in the troposphere. The bits inbetween the edge and the centre will thus stretch all the way up. So this effect will apply to the whole troposphere.
So the emissions altitudes post forcing will rise and thus become cooler by a far bigger amount than the compensating warming of the troposphere to reach post-forcing equilibrium. And that cooling will drop the emissions into space. So any diural temperature variation due to loss of daytime solar warming will be less due to this cooling/drop of IR emissions.
On the significance of this cooling. Meanwhile, because the emissions altitude is higher, there will be a drop in the pressure of the emissions altitude although only for the O2 & N2. The extra CO2 will presumably mean CO2 will be effectively constant. And this drop in pressure will mean a drop in the air's Specific Heat Capacity. (The temperature effect on SHC will be pretty flat.) And this drop in SHC will mean that for a constant loss of energy through the night, any diurnal cooling will be larger. This then operates in the opposite direction to the reduction in IR caused by the cooler emissions altitudes which will lower the energy loss and thus reduce the diurnal range.
And so the question is which effect is the larger? Indeed, are they of a significantly similar size? And given that, is the effect significant for the diurnal temperature range?
Given the proposal comes from this denialist URL, that is perhaps the first place to look for answers. So I will be looking at those 24 pages (although prior to that my own very cursory work on the first two of those questions suggests the pressure/SHC is the larger effect with a ration of 3:1).
I hope all that makes sense.
- Infrared Iris will reduce global warming
MA Rodger at 22:22 PM on 9 August, 2022I don't have a problem accessing Lindzen & Choi (2022) 'The Iris Effect: A Review'. The problems with any post-2011 up-date start when you do access Lindzen & Choi (2022). The vast majority of the 5,000-plus word account is re-fighting lost battles of the past, battles that actually pre-date the SkS OP above. In essence, all Lindzen & Choi are saying is that climatology has yet to nail down cloud feedbacks so don't forget the Iris Effect, although they give little enough reason for such remembering. And while Lindzen attempts to relive the past, the work on clouds continues along as it always did, including tropical ocean cloud with recently for instance Ito & Masunaga (2022) 'Process level assessment of the iris effect over tropical oceans' stating their "results show that a theory focusing on the air temperature structure around anvil clouds is likely at work in the tropical atmosphere, although the anvil's warming and cooling effects would offset each other during the whole day and night."
- Taking the Temperature: a dispatch from the UK
Fixitsan at 22:06 PM on 23 July, 2022I don't recall ever suggesting there has been no warming.
We are definitely only talking about a single location on the planet which continually monitors the temperature, unlilke most locations on the planet.
I suppose most people would think that the hottest day of any month, or the hottest average recorded temperature for a whole month would by now, given the frequency and strength of argument update in the media, show without doubt that all the hottest months are relatively recent.
But there is clearly 1 location on the earth where that is not true.
What is one to say to someone who shows to me that the hottest May was nearly 200 years ago ?
I'm in the UK, the UK news swamps me constantly with global warming warnings whenever a single hot day comes along and an idiot lights a fire (clearly even at 100C dry grass doesn't burst into flames, ignition is still always required, self ignition never happens at lower temperatures)
I have a similar issue with sea level rise to be honest, living near to the Forth Bridge which the Scottish National newspaper warned could be under water by 2050. A brief calculation reveals that in order to cover the Forth Bridge the required rate of sea level rise is 1500mm per year. Nasa shows it is currently 3.4mm per year and the historical record shows sea levels have risen at between 1.5mm to 3.5mm per year for about 7000 years.
Who checks the media ? certainly nobody in the science community seems to pull them up for these outrageous claims, but should someone suggest that there hasn't been as much warming as the IPCC says, or the danger is less than claimed, the science community as it is, only puts it's gloves on then, but never when claims are reidiculously overstated and that is a very disappointing judgement to have to make of people who claim to be deeply interested in truth and facts
Sea level rise, we were told would cause The Maldives to be evacuated within 30 years, is another outrageous claim I need to mention as I'm on the subject. I can say that now , because that claim was made 30 years ago and since then the population of the Maldives has doubled and banks lend easily to build sea front resorts and CO2 levels have increased accordingly. I guess we need to throw bank managers in with other people who are acting irresponsibly together with scientists who permit lies to be published
Back to the Forth Bridge, anyone can see where the high tide mark was in 1892 photographs and hold it up today to see where the hgih tide mark is today, and discover that the sea level rise over the past 130 or so years is nothing unusual.
I'm dining tonight with a couple of mid 20's people, who fear, literally fear, sea level rise in this area thanks to media lies and exaggerations, which were made with absolutely no consideration for either what has gone before or what is most likely to happen next (According to NASA). All I'm saying is their distorted view of reality spoils what could otherwise be a good night out. And I bet they would not believe me if I said the hottest month of May in the UK happened hundreds of years ago, despite the record showing otherwise. They're virtually convinced this isle is about to be washed away
Science, sort yourself out, and please, please, shoot down the messengers of lies who predict 1500mm of sea level rise per year, that's nearly 5mm PER DAY are you absolutely out of your mind ? If you allow those lies to persist the net result is it becomes difficult to believe scientists
I am sure at this point in time that a reader of this message is actuvely taking out his TI calculator to try to prove how 1500mm per year is actually possible.
No it isn't, put the calculator away, write a letter to the people who are lying in the news and demand they tell the truth instead if you're a decent sort of human being
I think there has been some warming over the past 100 years
I believe there can never be climate stability, and climate change is the only possible scenario given the large numbers of inputs and feedbacks which are never stable
Therefore I feel it is irresponsible of science to allow any sort of publishing of an argument which claims we can 'get control' of the climate as if the temperature will stabilise and never change once again. It's unicorn thinking. Dire. Idiotic. It needs to be stamped out or else science is guilty of permitting lies to be propogated
- Clouds provide negative feedback
Bob Loblaw at 06:00 AM on 13 July, 2022Likeitwarm:
The paper by Mulmenstadt et al that you mention was covered in this blog post at Skeptical Science, around the time it first appeared. (SkS reposted the Carbon Brief article.)
In that post, a key summary is:
However, the lead author of the study tells Carbon Brief that fixing the “problem” in rainfall simulations “reduces the amount of warming predicted by the model, by about the same amount as the warming increase between CMIP5 and CMIP6”.
So, the results are not as earth-shattering as you seem to want to imply. Uncertainties in cloud feedback are a well-known part of climate modelling and understanding, and this paper represents one more small step in helping understand the consequences.
As for your description of the water cycle:
- A wet surface evaporates more than a dry one. This transfers energy as latent heat into the atmosphere, and reduces the energy transfer as sensible heat (thermal energy). Thus, it priimarily changes the balance in how the energy reaches the atmosphere, not the total.
- What evaporates evenutally condenses and falls out as precipitation, but it rarely condenses or precipitates over the location it evaporates. Most extra water vapour is transported to other regions, where it falls as precipitation.
- Oceans receive far less water via precipitation than they lose as evaporation.
- Land areas (mostly) are the opposite - much more precipitation than evaporation.
- Increased evapoation does not necessarily lead to increased cloud cover at the evaporation location. Any changes in cloud type, amount, etc., are strongly depndent on when and where and how that cloud eventually forms.
- This complexiity is why cloud feedbacks are still an area of active study.
- The current understanding remains that clouds provide neither strong negative or positive feedback.
As for your discussion of "runaway warming" - nobody is predicting such a result due to CO2, so you are arguing a strawman.
And as to "self regulation of the temperature of the atmosphere" - the simple fact that climate has changed in many ways, for many reasons, over centuries and millenia is strong evidence that this is not true. Perhaps try reading the "Climate's changed before" post that reponds to our number 1 myth listed in our "Most Used Climate Myths" in the top left sidebar of all our pages.
I have worked through some darn cold sunny days in winter - much colder than overcast days in summer - to illustrate how incomplete your cloudy/sunny day closing statement is.
- Antarctica is gaining ice
Philippe Chantreau at 06:12 AM on 18 June, 2022Shalom,
You are launching accusations of nefarious intent. However, you are not producing anything even close to evidence that would support such accusations. In fact, the accusations thenselves are about actions that have not taken place and facts that are imaginary.
The treatment of polar regions in the 6th assessment is summarized here. It says: "For Antarctic sea ice, there is no significant trend in satellite-observed sea ice area from 1979 to 2020 in both
winter and summer, due to regionally opposing trends
and large internal variability." The trend is not significant because it is less than the uncertainty. Antarctic sea ice is not ignored or swept under the rug. As usual with IPCC reports, the full treatment of the polar regions is accessible online.
Not only does it not ignore Antarctic sea ice, it provides numerous references for it:
Turner et al., 2017
Kusahara et al., 2018
Meehl et al., 2019
Wang et al., 2019
Before asserting that a trend is being ignored, it would also make sense to ensure that there is really a trend to speak of. Turns out that there isn't: "Total Antarctic sea ice cover exhibits no significant trend over the period of satellite observations (Figure 3.3; 1979–2018) (high confidence) (Ludescher et al., 2018)."
Interestingly, this was compiled before the lowest extend on record, which was in 2022.
Last point, about models. Another quote from same AR6: "Coupled climate models indicate that anthropogenic warming at the surface is delayed by the Southern Ocean circulation, which transports heat downwards into the deep ocean (Armour et al., 2016). This overturning circulation (Cross-Chapter Box 7 in Chapter 3), along with differing cloud and lapse rate feedbacks (Goosse et al., 2018), may explain the weak response of Antarctic sea ice cover to increased atmospheric greenhouse gas concentrations compared to the Arctic (medium confidence). Because Antarctic sea ice extent has remained below climatological values since 2016, there is still potential for longer-term changes to emerge in the Antarctic (Meehl et al., 2019), similar to the Arctic."
- Climate's changed before
MA Rodger at 02:52 AM on 11 March, 2022paulbegin @885,
Increased concentrations of CO2 in the atmosphere will increase global temperatures directly through the greenhouse effect. An increase in temperature can influence CO2 concentrations but less directly. Thus colder oceans are more able to absorb CO2 so CO2 will be drawn from the atmosphere into the oceans during an ice age, this increasing the ice age cooling. But there are other temperature-CO2 correlations, for instance during the ENSO cycle with temperature and CO2 increasing in the aftermath of an El Niño. Yet in the ENSO cycle the fluctuating CO2 levels are not due to temperature but due to changing patterns of rainfall causing changes in vegitation growth in the Amazon basin.
So it is CO2 that drives temperture while temperature has a small influence on CO2.
I'm not emtirely sure what you are asking for with your last question. The various drivers of climate change, be they forcings or the resulting feedbacks, are reasonably well understood for the past few million years but there is more difficulty going back into the more distant past as the drivers and the climate are less well understood.
The big difference between the last few-million-years and the last century-or-so is that the major climate forcing has resulted from human activity and that said, I'm not sure what you expect from comparing the last century-or-so with the last few-million-years. - It's albedo
MA Rodger at 22:27 PM on 5 March, 2022Bob Loblaw @131,
I also have struggled to identify any sign of a significant driver of climate in the arguments presented by blaisct. If we wind back to the initial proposal (in the 'Does Urban Heat Island effect exaggerate global warming trends?' thread @59), I feel the scoping of a direct potential forcing can be scoped quite simply** but refining such an analysis does not appear possible with commenter blaisct who now introduces further speculative feedbacks into the discussion, thus piling unhelpfulness on top of unhelpfulness.
(**According to Wild et at [2015] fig2a, the average land albedo equates to 48Wm^-2(land) = 14Wm^-2(global). If urbaniseation reduced that to zero over 1M sq km, that would equate to a 0.1Wm^-2(global) forcing, thus a maximum value for a quantity which may not even be positive. Note Guo et al [2022] suggest the effect is negative over urbanisation in China.) - 2022 SkS Weekly Climate Change & Global Warming News Roundup #7
Philippe Chantreau at 09:37 AM on 27 February, 2022The "article in point" claims this: "In fact, the
climate sensitivity to a doubling of CO2 from 400ppm to
800ppm is calculated to be 0.45 Kelvin."
However, there has already been over 1 degree of temperature increase compared to pre-industrial, with the concentration going from 290 ppm to 400 ppm and we are nowhere near equilibrium for 400, which would take some time.
I did not see in the paper a competing explanation for the measured increase. I also did not see why exactly they believe that all the rest of the litterature that concludes the equilibrium sensitivity for a doubling of pre-industrial concentration is around 3 degrees is wrong.
The argument against feedbacks is not very detailed and amounts to little more than hand-waving. It flies in the face of an extensive body of research into the glacial/interglacial transitions associated with Milankovitch cycles.
At first glance, I am not very impressed. Hopefully, more qualified commenters will look into it. I am also not sure about the publication where this piece appeared.
- Global CO2 emissions have been flat for a decade, new data reveals
pattimer at 22:07 PM on 24 November, 2021Interesting article. And hello everyone at Skeptical Science. It's been a long time since I have been in touch.
However
I have a question.
If CO2 emissions have been less than previously thought in the past from fossil fuels and land emissions but the atmospheric CO2 is increasing just precisely as we measure it then does this not mean that very worryingly the air borne fraction must be increasing. If so positive carbon feedbacks are coming earlier than we feared? OR Have I missed something?
- It's the sun
cph at 21:57 PM on 11 November, 2021
Diagram showing the monthly fluctuations in total global cloud cover since July 1983. During the observation period, the total amount of clouds fluctuated from about 69 percent in 1987 to about 64 percent in 2000. The annual variation in cloud cover follows the annual variation in atmospheric water vapor content, which presumably reflects the asymmetrical distribution of land and ocean on planet Earth.
Within the still short period of satellite cloud cover observations, global cloud cover reached a maximum of about 69 percent in 1987 and a minimum of about 64 percent in 2000 (see diagram above), a decrease of about 5 percent. This decrease corresponds roughly to a net change in radiation of around 0.9 W / m2 within a period of only 13 years, which can be compared with the total net change estimated by the IPCC 2007 report from 1750 to 2006 of 1.6 W / m2 for all climate drivers including greenhouse gas emissions from fossil fuel burning(cooresponds to your mentioned 2,5-3W/m² in 2021). These observations leave little doubt that cloud cover variations can have a profound impact on global climate and meteorology on almost every time scale considered.
The total reflectance (albedo) of the planet earth is about 30 percent, which means that about 30 percent of the incident short-wave solar radiation is reflected back into space. If all the clouds were removed, the global albedo would drop to around 15 percent and the short-wave energy available to warm the planet's surface would increase from 239 W / m2 to 288 W / m2 (Hartmann 1994). However, long-wave radiation would also be affected, which emits 266 W / m2 into space compared to the current 234 W / m2 (Hartmann 1994). The net effect of removing all clouds would therefore still be an increase in net radiation of around 17 W / m2. So the global cloud cover has a significant overall cooling effect on the planet, although the net effect of high and low clouds is opposite.
HK: - "but also through its warming effect through its strong greenhouse effect, which is the most important of all positive (reinforcing) feedbacks on a global level."

According to the current status, the net radiation effect of clouds is -19W / m² (Wild 2019) and corresponds very well with + 0.9W / m² per 5% less cloud cover.
High levels of global cloud cover are associated with low global temperatures, demonstrating the cooling effect of clouds. A simple linear fit model suggests that a 1 percent increase in global cloud cover corresponds to a global temperature decrease of about 0.07 ° C.
- It's the sun
HK at 06:44 AM on 10 November, 2021My point in #1292 was that the 0.5 W/m2 of forcing from clouds and snow/ice is small compared to the overall net forcing over the last 150 years or so and that the albedo change brought up by you is at least partly a direct consequence of the warming, i.e., one of the positive feedbacks.
However, I will admit that clouds and humidity are complex and can be influenced by other factors in addition to the direct result of man-made greenhouse gases. Desertification and deforestation in general and especially cutting down tropical rainforests can have a profound impact on the local hydrological cycle, changing humidity, cloud cover, rainfall and run-off and thus have an impact on the local temperature as well. So yes, man-made climate change isn't only about the greenhouse effect and the warming caused by it, but it's definitely the most important part of it on a global scale.
It's also worth noting that even if the relative humidity seems to have decreased somewhat for the reasons explained here, the absolute or specific humidity has in fact increased, just as expected in a warming world.

Water has an impact on the temperature not only via its removal of latent heat through evaporation – which has a local cooling impact – but also through its warming impact via its strong greenhouse effect, which is the most important of all the positive (amplifying) feedbacks on a global scale. - It's the sun
HK at 01:05 AM on 7 November, 2021"Explained by the cloud and snow / ice albedo that has decreased in the last few decades (0,5W/m² which is a lot)."
The net forcing from the preindustrial period when counting both the positive forcing from the greenhouse gases and the negative forcing from man-made aerosols is now roughly 2.5–3 W/m².
Changes in clouds and the snow/ice albedo are positive feedbacks amplifying that warming. The most important and fastest of those is the water vapour feedback which roughly doubles the initial warming.
BTW, if clouds and snow/ice changed by themselves and not as a feedback to warming caused by GHGs, we wouldn't get a cooling stratosphere or more warming in winter than summer at high northern latitudes.
- CO2 effect is saturated
MA Rodger at 00:49 AM on 28 October, 2021andrewhoward @628,
Concerning the 'nit-picking', back in September there was no sign of the Coe et al paper [full paper here] but instead another paper occupying those pages. It thus appeared at that time to be somewhat more than 'nit-picking'. There since has been some page re-numbering by the journal which isn't very professional and the side-bar buttons for 'Submit a Manuscript' and 'Become a Reviewer' and even 'Launch a New Journal' suggest a title that is more vanity publishing than serious science.
This would not be the first time denialists have accessed HITRAN to produce a pack of nonsense. Their description shows them calculating how much surface radiation is absorbed by the various GHGs and ignoring the emissions from the atmosphere. It is the density/temperature of the GHGs where they emit into space that determines the GH-effect so the paper's calculations are simple nonsense.
In terms of their basic findings, they find H2O alone would provide 91.8% of the GH-effect, CO2 alone would provide 24.7% but when added to H2O, CO2 would provide an additional 7.7%. The CH4 & N2O alone value isn't expressly given while their additional contribution is 0.5%.
This is all very silly. This RealClimate post provides a more conventional set of findings but includes further contributions to the GH-effect. Thus the CO2 percentages do not look greatly different. But H2O alone is given as just 66% and while the 'Other GHG' (which would be more than just CH4 & N2O but they would be the lion's share) provide an additonal 2%.
When Coe et al address ECS, they are entirely off with the fairies. It is well known that the forcing from 2xCO2 increases global temperatures by +1ºC. These jokers manage to find just +0.4ºC, a certain maker of 'idiots-at-work'. Coe et al say ECS estimates range from +1.5ºC to +4.5ºC. The usual best estimate is seen as +3ºC, thus a trebling of the CO2 warming through feedbacks. The statement by Coe et al that "More recent work, however, suggests ECS values of less than 1degC" is plain wrong - a cherrypick of fellow denialist work. Coe et al prattle through a pack of nonsense to turn the climate feedback from a best estimate +200% into just +12.4%. Of course, if such a crazy finding were in the slightest bit serious, it would need nailing down and strongly justifying. But Coe et al jump straight to what is the purpose of their task and so predictably conclude "There is no impending climate emergency and CO2 is not the control parameter of global temperatures."
- An exponential increase in CO2 will result in a linear increase in temperature
MA Rodger at 19:47 PM on 9 October, 2021plincoln24 @18,
I think you appreciate that this SkS OP is attempting to address the perception of "exponential growth" and thus the idea that the log relationship between atmospheric CO2 cncentrations and forcing makes such "exponential growth" linear and thus arguably entirely acceptable. I would suggest it is not the easiest of messages.
There are also some real-world considerations with the Log(Exp)=Linear relationship. ♣ There is the impact of any change in the exponential factor driving the CO2 increase (with the OP pointing to that exponent increasing & NOAA AGGI showing CO2 forcing which post-2000 exhibit a doubling-time of 43 years & a decade longer for all-GHG forcing). ♣ There is the transcient effect of the sudden tripling of the GHG forcing back in the 1960s (which all else being equal should provide an accelerating temperature for some decades following). ♣ There is (thus) the impact of non-CO2 forcings as well as natural forcings. ♣ There are the natural feedbacks and their impact on very-long-term warming resulting from an initial forcing, these timescales which are generally considered the factors that will define whether ECS is high or low.
- Reviewing the horrid global 2020 wildfire season
Bob Loblaw at 04:40 AM on 23 September, 2021Mike: the latest IPCC report, in the SPM, states:
"The magnitude of feedbacks between climate change and the carbon cycle becomes larger but also more uncertain in high CO2 emissions scenarios (very high confidence). However, climate model projections show that the uncertainties in atmospheric CO2 concentrations by 2100 are dominated by the differences between emissions scenarios (high confidence). Additional ecosystem responses to warming not yet fully included in climate models, such as CO2 and CH4 fluxes from wetlands, permafrost thaw and wildfires, would further increase concentrations of these gases in the atmosphere (high confidence).
So, it is on the radar of climate scientists. In the IPCC report, section 5.4.3.2 mentions it specifically, but only some models include these emissions as a dynamic feedback. Here is how that section closes (emphasis added):
Overall, climate change will force widespread increases in fire weather throughout the world (Section 12.3.2.8). Because of incomplete inclusion of fire in ESMs, a separate compilation of fire- driven carbon-climate feedback estimates (Eliseev et al., 2014a; Harrison et al., 2018) (section 5.4.8). There is low agreement in magnitude and medium agreement in sign, which alongside other literature (Jones et al., 2020), leads to an assessment of medium confidence that fire represents a positive carbon- climate feedback, but very low confidence in the magnitude of that feedback. Other disturbances such as tree mortality will increase across several ecosystems (medium agreement) with decreased vegetation carbon (medium confidence). However, the lack of model agreement and lack of key process representation in ESMs lead to a low confidence assessment in the projected magnitude of this feedback.
- CO2 effect is saturated
michael sweet at 01:05 AM on 13 September, 2021Hari-Seldon:
Welcome to Skeptical Science. I suggest that it is better to try to phrase your comments as questions when you are asserting something that is different from accepted science.
At the surface of the Earth the greenhouse effect is in what you would describe as near saturation. That doesn't matter. The key point is that at the average escape altitude for IR radiatiom, at approximately 10,000 meters, the concentration of CO2 is about 1/3 the concentration at sea level due to lower atmospheric pressure. In addition, since it is so cold at the escape altitude, there is little water vapor present so CO2 is the ultimate control of most of the radiation escaping. I think your calculations are in error because you used the incorrect concentration of CO2.
Increasing the concentration of CO2 increases the escape altitude. The lapse rate of the troposphere is about 6K/km. If the escape altitude increases 100 meters than the temperature at the surface increases 0.6K. Positive feedbacks cause the amount of heating from CO2 to approximately triple.
Keep in mind that the greenhouse effect increases the temperature of the Earth's surface about 33K. Adding 10% to the existing greenhouse effect would increase temperature over 3K, a disastrous amount. Try calculating how much of an increase in CO2 would result in a 100 meter increase in the escape altitude for a more accurate estimate of the change required.
You are trying to do a difficult calculation without understanding the basics of the atmosphere. I recommend reading a lot more background information before you assert you are correct. It is generally accepted that doubling CO2 concentration results in approximately a 3K increase in surface temperature. About 1K is from the CO2 increase. The response to increased concentration is logarithmic.
- It's albedo
MA Rodger at 00:11 AM on 11 September, 2021Bob Loblaw @80,
While it will likely not assist commenter coolmaster, there is an apparent contradiction presented within the literature, a contradiction which coolmaster seems to ignore while taking a cavilier interpretation from just one side of it. So that contradiction should perhaps be explained.
♣ We have reasonably unambiguously statements from AR6 Section 7.2.4.3 'Synthesis for the net cloud feedback' (a section mentioned by coolmaster @79) which tells us Cloud Feedback is net positive unless there is "extremely large" negative contributions over certain ocean areas although there is yet "no current evidence" for such contributions.
The work supporting this conclusion includes Dressler (2013) whose Fig 5 shows (units Wm^-2):-

This finding thus contradicts the assertions of commenter coolmaster that Cloud Feedback would be net positive over land. (I will ignore the water vapour feedback which will certainly provide additional positive feedback if substantial additional evaporation occurs over land.)
♣ There is also AR6 Section 7.2.1 'Present-day Energy Budget' mentioned @79. This presents in Fig 7.2 an old friend from up thread, namely Fig 14 from Wild et al (2019).
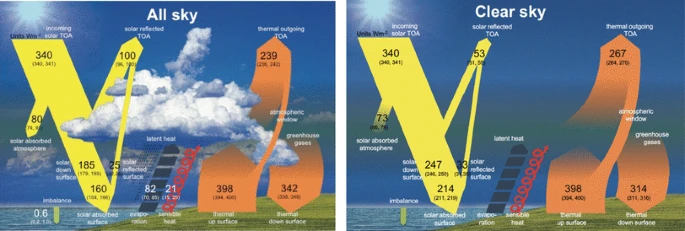
It is from this graphic that Wild et al derive the finding "The net (shortwave and longwave combined) cloud radiative effect at the TOA then results in an overall energy loss of − 19 Wm^−2," a finding echoed in AR6 section 7.2.1 'Present-day energy budget' - "As a result, there is a 20 Wm^-2 radiative imbalance at the TOA in the clear-sky energy budget (Figure 7.2 lower panel), suggesting that the Earth would warm substantially if there were no clouds."
This -19Wm^-2 is the value used by commenter coolmaster to suggest there would be a pro rata cooling due to an increase of cloud by 1% over land (although water vapour is not similarly accounted as increasing and also for some unexplained reason the cloud result is treated as being an accumulative annual cooling).
♣ These two references within AR6 appear contradictory. However, the 7.2.1 account does no more than "illustrate the overall effects that clouds exert on the energy fluxes." It simply shows that cloud effects are large while the actual Cloud Feedbacks are far more complex. Such feedbacks cannot be determined by simply comparing the average net radiation budget within areas of clear sky relative to an average for the entire planet.
So if more cloud were created, the type and location of that cloud will determine whether there is net global warming or cooling. And the sort of change in cloud resulting from additional AGW is seen to be warming. Uncertainty remains high for the size of AGW's cloud fedback, and that includes the rather jaw-dropping findings of Schneider et al (2019) and also in the CPIM6 models.
♣ I should perhaps end by making plain that for coolmaster's scheme of global cooling, this discussed 'contradiction issue' is a minor issue relative to some of its other problematic issues it generates.
- It's albedo
coolmaster at 09:19 AM on 10 September, 2021BL@78
BL: you double-down on your claim of a strong cooling effect for clouds. Let's examine some actual science.
I have already sent you the current science in this regard. The graphics for the global radiation balances all_sky, clear_sky, land & ocean were created and published by Prof. Dr. Martin Wild / ETH Zurich. He is a very nice person and lead author of the IPCC AR6 WGI Chapter 7: The Earth’s energy budget, climate feedbacks, and climate sensitivity. (Chapters 7.2.1 and 7.4.2.4.3 are relevant for our topic.)
You will not find our topic much more actual and precise anywhere, and if you continue to have doubts about the strong cooling influence of clouds - you should contact with Prof. Dr. M. Wild directly.
BL: summary diagrams are summary diagrams - not detailed models."
You will surely see that a slr volume of 1335km³ / year has to be distributed globally and that I therefore use global, summarizing radiation balances.
Using the posted information in the explanatory file on land use and irrigation,
https://www.frontiersin.org/articles/10.3389/feart.2020.00245/full
you also have the opportunity to observe my claims about irrigation, cloud formation, precipitation, temperature, radiative forcing etc. on a more regional level.
BL: ...it condenses to form cloud, but this is not always the case. ...So will this "extra" moisture cause more clouds? Maybe. Maybe not.
You have provided no scientific justification for this claim, or references to suitable scientific publications to support it. You are completely wrong here. You claim that there is some kind of rest room for water vapor in the atmosphere. Could you please prove that.
99,999% of atmospheric water vapor will form a cloud before it return as precipitation. Dew e.g. is also considered to be a form of precipitation.
BL: As a consequence of increasing evporation, the location where the evaporation occurs will also see less thermal energy transfer to the atmosphere, so temperatures are also affected.
Yes Sir - that´s what I mean. More latent heat flux = less sensible(thermal as you say) heat flux. H²O in the air will form clouds - dry and hot air in the atmosphere will kill them. Soil and air temperatures will decrease - and that's exactly what I intend to do with my strategy. You should also know that the extra amount of 1% precipitation/irrigation/evaporation is planed to released predominantly in spring / summer allways into a relatively unsaturated, dry and hot clear_sky atmosphere, which most closely corresponds to a drought period or desert.
Intensification of the global hydrological cycle is a robust feature of global warming, BUT at the same time, many land areas in the subtropics will experience drying at the surface AND in the atmosphere. This occurs due to a ! limited water availability ! in these regions, where the cloudiness is consequently expected to decrease.
Your speculations about different clouds, with their different effects on the albedo and SW / LW radiation effects, are not conducive to the discussion and are unimportant for my assessments. In a dry, hot, sunny high pressure atmosphere, I guess at least that mostly convective fair-weather clouds or thunderclouds (cumulus or c.-nimbus) will arise.
1% more precipitation / evaporation will not have a major impact on the general cloud pattern. The natural regional variability of the amount of precipitation is often 200mm or more between dry and humid years. Since 9mm more or less per year will regionally cause no noticeable changes in the cloud regime. Maybe there will be 3-4 rainy days/year instead of increasing hours of sunshine.
BL: Coolmaster's diagrams are nice pictures that help illustrate a few aspects...
Again - these diagrams are not mine. They are calculated by professionals of IPCC experts. You have no clue about the difference between water- & air cooling, heat capacity & efficiency. That's your problem - not mine. - Key takeaways from the new IPCC report
gws at 11:02 AM on 24 August, 2021ilfark2, some of the answers you seek are in sections B4 and B5 of the SPM.
First of all, note that this is a complete hypothetical because we won't stop emitting tomorrow; even a reduction to "net zero" by 2050 (aka within 30 years) is a stretch.
That said, note that the assumption of a linear drop you made @10 is unrealistic. Due to feedbacks in the earth-atmosphere carbon cycle system the drop is exponential as illustrated by the graph under @9, quite slow, and not returning to pre-spike conditions in equilibrium (after some 10s of thousands of years). OTOH, the graph @9 illustrates a spike of 5000 Pg; the actual spike at this point is closer to 1000 Pg. The graph is meant to illustrate a general system behavior, not a real-world scenario.
As atmospheric CO2 concentrations fall slowly after the emissions cease, the climate effect would linger, and as the SPM highlights in section B5, that means several climate parameters (e.g. sea level, ice cover) would remain altered for "centruries to millenia".
- The new IPCC Report includes – get this, good news
MA Rodger at 19:26 PM on 15 August, 2021anticorncob6 @1,
The CO2 budgets quickly become very complicated and comparing them takes a little spade-work. Here is my simplistic take on it.
That 2013 Carbon Budget you link to is quite a generous one, even though it is for +2ºC AGW. Its 1,000Gt(C) emissions budget or 3,664Gt(CO2) with an Airborne Fraction of 45% would yield [1,000 x 0.45 / 2.13 + 275ppm=] 486ppm atmospheric CO2 by 2090 (followed by negative emissions). Other Carbon Budgets, for instance the IPCC SR1.5 budget from 2018 set a budget at 432ppm for a 66% chance of avoiding +1.5ºC AGW, this with large negative emissions to follow the reaching of zero. (My assessment here using the simplistic Af=45%.) The AR6 SSP1-2.6 with its 2% annual reductions for a +2ºC AGW, again followed by negative emissions post 2075, I'd assess at something like 285Gt(C) post-2020 so 474ppm, not greatly less than that 2013 Budget you linked to @1. Mind the real wake-up numbers come from AR5 which put the 66% +1.5ºC AGW at 417ppm.
You mention the "positive feedbacks" and perhaps nigelj @2 should have added that land ice will continue melting away unless global temperatures are reduced, the worry being that Greenland will melt down (taking millennia) with warming somewhere between +1.0ºC & +2.0ºC AGW and with nothing to stop it once its summit drops down to warmer altitudes. And the stability of the West Antarctic ice is potentially even more sensitive to warming.
Specific to being "positive feedbacks" (which melted ice fields are not unless they entirely disappear & so reduce albedo), the melting tundra is also a process which will continue for centuries without a return to a chillier climate. The size of such the feedback from melting tundra will depend on how hot we make it.
Keeping the ice sheets intact and the tundra frozen is one of the more obvious reasons why limiting AGW to +1.5ºC is a sensible policy.
- Clouds provide negative feedback
MA Rodger at 01:46 AM on 23 June, 2021sunnyx @258,
The level of CO2 in the atmosphere during the early Earth is usually assumed to be very high because the sun was a lot weaker (it has been brightening by something like 5% every billion years) and we know from rocks that there was liquid water so the Earth could not have been very cold. For the period back to 500My the CO2 level can be assessed from proxy data and also modelled. This shows CO2 was a lot higher than today for most of the last 500My. The impact on the climate is a matter of how many doublings of CO2. So three or four doublings would suggest a climate something like 10ºC-13ºC warmer. But the loss of 2½% of solar heating with the weaker sun back 500My would equal perhaps two of those CO2 doublings. So much of the climate forcing of the additional CO2 was negated by there being a cooler sun.
Changes in climate result from the feedbacks as well as the CO2/solar forcing and will not have chaned greatly. But the net feedback would have to be large to have caused a runaway warming. Imagine ECS=3ºC. That is the net feedback (the sum of positive and negative) result in trebling the temperature increase initially caused by the CO2. But that is all you get - a trebling. It would take a stonger net feedback to become runaway (actually 50% stronger).
(The ECS=3ºC is a compound result in that the warming of the feedback itself induces feedbacks. The trebling of ECS=3ºC is equivalent to a simple feedback of 0.67. As Philippe Chantreau @259 says, the magic number to achieve runaway is 1.0, an increase on 0.67 of 50%.)
I hope that makes sense for you.
- Clouds provide negative feedback
Philippe Chantreau at 01:33 AM on 23 June, 2021Some feedbacks are negative, some are positive. So long as the total sum of all feedbacks is less than 1 in either direction, there can be no runaway warming or freezing. There is plenty of info on that from a variety of sources: https://en.wikipedia.org/wiki/Climate_change_feedback
- Clouds provide negative feedback
sunnyx at 00:08 AM on 23 June, 2021Quick question on cloud feedbacks in particular and other feedbacks in particular. If every feedback we have is positive, and we know that way back in time CO2 was 30* current levels, wouldn't the earth have had runaway warming? Doesn't the fact that it didn't mean that some of the feedbacks must be negative, and indeed dominate in higher temperature regimes? What are the explanations for why 600-400 mya, there wasn't runaway warming? Was it the tilt of the earth, the sun, or some other astronomical feature that was very different, or was it a not yet understood feedback? Thanks
- The New Climate War by Michael E. Mann - our reviews
Philippe Chantreau at 04:17 AM on 10 June, 2021Nick,
You just reiterated the points you made earlier.
Uncertainties have not been represented inadequately in the IPCC reports. Cloud feedbacks have always been at the top of the uncertainty ladder.
You are sliding toward the very behavior you condemn by saying the CMIP5 models run "too hot." In reality they run slightly warmer than observations, and slightly is even generous. There is plenty of good posts on that RealClimate and even here showing how well within models' expectations the observations have been. The cloud feedback underestimation has not prevented actual temps of increasing beyond .15 degC/decade. Everything considered, the models have performed remarkably well, even the old ones. Describing it as "too hot" does exactly the same as what all the sides you accuse of taking liberties with the facts do.
I'll add that over-emphasizing uncertainty is Judith Curry's preferred method of manipulation and it is every bit as bad than anything done by so-called alarmists. It is a free pass for do nothing or slowly do a little, neither of which are adequate.
I can understand the pressures and imperatives that a business like Exxon has to reconcile. The state of their knowledge, and the remarkably reasonable tone in most of the old documents (see the wayback machine link) are so far removed from the propaganda they pushed that your excuse falls short. Why such an immense disconnect? Sure there was significant uncertainty in 1979. Less so in 1989. Much less in 1999. All the uncertainty that could justify not seriously starting a transition was gone in 2009. Exxon kept on pushing the same narrative, and still does, through the same actors.
I do not disagree that, if one wants to understand the science, the message coming from activist organizations is often not helpful. I do not disagree that some have a wholefully unrealistic perception of the difficulty of a full energy transition. The energy transition we are faced with is a major undertaking. Both the magnitude and urgency of it have been made far worse by the decades of inaction caused by the fossil fuel backed opinion campaigns.
As for myself, I strive to be reality-based and firmly believe that no option should be off the table, except those whose range of consequences can not be well assessed )atmsopheric geo-engineering comes to mind). I am not opposed, in principle, to nuclear. I believe that existing dams that can produce electricity and allow to store water should be kept. I think that enhanced geothermal deserves more attention. I also know for sure that a world in which the pursuit of more profit at any cost all the time is the main driver is a world doomed to fail.
- Dr. Ben Santer: Climate Denialism Has No Place at Lawrence Livermore National Laboratory
MA Rodger at 22:33 PM on 31 May, 2021We are now a few days after Koovin's seminar at the LLNL but I don't see a word of the grand message presented by Koonin. Presumably it is as embarassing as his silly book.
Trying to find some coverage of the seminar, I did spot Koonin's pathetic attempt at de-debunking, that is debunking the WSJ Mills' article [LINK-paywalled] that debunked his silly book. Koonin's efforts at de-debunking simply demonstrates the level of utter nonsense you can expect from an obfuscatiing denialist troll like Koonin.
Just holding up the first of the nine items Koonin attempts to de-debunk shows the purile standard. This first item involves the following untruthful quote from Koonin's book which needs little comment to debunk.
"Greenland’s ice sheet isn’t shrinking any more rapidly today than it was eighty years ago."
Cutting through the nonsense presented by Koonin's de-debunk, the troll defends his grand assertion using Fig 1d of Frederickse et al (2020) 'The causes of sea-level rise since 1900' which shows the 30-year average rate of SLR attributed to Greenland by the study 1910-2010. Koonin tells us:-
"The “fact check” [by Mills] does not refute the statement quoted, which is about the rate of sea level rise 80 years ago."
...
"The 2019 paper by Frederikse et al. clearly shows that Greenland’s contribution to sea level rise around 1940 was about three times higher than it was in the last decades of the 20th century."
Yet, if it is about SLR and not Greenland, then the relevant evidence from Frederickse et al is shown in Fig 1c not Fig 1d. And Fig 1c shows average rate of SLR in 2010 was 33% greater than at any time "eighty years ago" and that "today" it is likely higher again. Greenland is not the sole contributor to the acceleration in SLR (thus a cherry-pick) while Koonin's use of "the last decades of the 20th century" to represnt "today" is no more than disigenuous trolling.
...
And in the intrests of correctness (the troll Koonin may have been saving his best until last), the ninth and last of his de-debunking atttempts to defend the Koonin quote:-
"...while global atmospheric CO2 levels are obviously higher now than two centuries ago, they’re not at any record planetary high — they’re at a low that has only been seen once before in the past 500 million years."
The context of this quote which compares today with "the past 500 million years" is not given. It appears Koonin bases his "only seen once before" comment on CO2 relative to today's 400ppm being lower 300 million years ago. And presmably his grand book does not provide a justification for this comparison. So, as was discussed in the debunking by an actual geoscientist, 300 million years ago the sun was much weaker, this perhaps 1.5% weaker 300 million years ago, so [0.025 x 250Wm^-2 =] 3.75Wm^-2 or the equivalent to a doubling of CO2. Koonin ignores such argument agaist him and instead concentrates on refuting the potential for future CO2 levels reaching 1000ppm.
- Welcome to Skeptical Science
MA Rodger at 23:36 PM on 6 May, 2021garyjenkins @89,
Your 'kettle' question would be quite straightforward but for two complications which to overcome require assumptions to be made.
(1) The means of boiling this kettle can be more-or-less carbon intense. Thus that jolly swagman of song may be boiling his billie over a fire made of driftwood from the billabong and thus be seen as carbon-neutral. Or perhaps there is coal lying about nearby which the swagman could use which would lead to a particularly carbon-intense outcome.
In the past I considered a similar question to the one you pose and, assuming the kettle was powered by UK electricity, I found the accumulating AGW energy would equal the FF energy in roughly a year. The energy-mix of the electricity generation wold impact this result, gas requiring 18 months for the AGW to equal the kettle's electric, coal requiring just 9 months.
(2) Also, and more difficult, there is the need to account for the level of atmospheric CO2 and how long it "hangs around," or indeed when in time this kettle is being boiled as CO2 forcing is logarithmic not linear so the result will alter with differeing atmospheric ppm CO2. And a final consideration - are AGW forcings accounted with-or-without feedbacks? Perhaps that is a consideratio too far.
The SKS graphic below (from this SKS post) is useful in setting the scene for your kettle question. (The 2005 AGW forcing given appears to be actually the CO2 forcing which for 2005 is 1.6Wm^-2 according to the Global Carbon Project.) The values in the graphic give a ratio AGW Forcing-to-Energy Production of roughly 50:1, pretty-much identical to the ratio of 2005 CO2 emissions to accumulative total emissions provided by the GCP data.
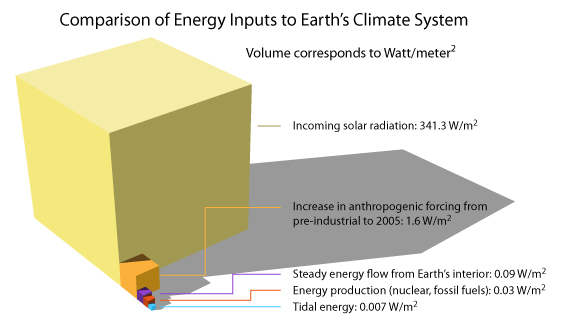
This then sort-of supports the one-kettle-per-year result.
However, with CO2 being slowly drawn down out of the atmosphere following its emission, perhaps the ratio of 2005 CO2 emissions to accumulated-by-2005 atmospheric burden should be used, this roughly halving the ratio. Thus immediately following emission of the CO2, the rate woud be perhaps two-kettle-per-year.
I note you say "CO2 hangs around in the atmosphere for 30-50 years" but it hangs round longer than that. Rougly, 30-50 years is how long it takes half of it to be drawn down. After 100 years perhaps 33% remains, 1,000 years perhaps 20% and it is tens-of-thousands of years before it is benothinged. And integrated over that full period, the accumulative count of AGW in kettles would be rather large (perhaps 100 kettles in 100 years, 300 in 1,000, maybe above 5,000 kettles before it is all gone) but the rate of kettles-per-year becomes smaller and smaller and the resulting global warming will thus diminish. - It's planetary movements
Rob Honeycutt at 05:02 AM on 1 April, 2021Likeitwarm... No, because there is a definable mechanism for CO2 being the cause of warming. We know CO2 is a long-lived, non-condensing greenhouse gas. We know that other greenhouse gases, like water vapor, are feedbacks (short-lived, condensing GHG's) that respond to changes in temperature.
You kind of have to look at the whole puzzle, not just the isolated bits.
- Skeptical Science New Research for Week #9, 2021
SunBurst at 13:52 PM on 15 March, 2021MA Rodger @24
Given a fair chance, I believe I can clear up most of your concerns about my claims, and maybe even a few things you never quite understood. It would, however, take an open mind on your part and recognize the possibility that not all of the cardinal laws of modern "climate science" are consistent with fundament laws of phyics. Probably the most far-reaching inconsistency between fundamental physics and climate science is the assumption of an earth in perfect thermal equilibrium. Now you and I both know that can't possibly be true or all of your temperature data would show a uniform temperature over the entire surface. Also, relative humidity would be 100 percent everywhere. This is the basis, however, for arguing the CO2 "control knob" theory. As you may recall, this theory relies primarily on the Clausius-Claperyon equation which assumes a uniform temperature over the entire condensed state/vapor state sample. Since the entire earth is our "sample" in this case, CO2 cannot in general be the controlling GHG unless we have a uniform temperature earth.
Despite what seems to be total absurdity in this "control knob" theory, however, it is the reason why climate science does not allow dismissal of the CO2 greenhouse effect as small compared with that of H2O. It is also the basis for lingo such as forcings, feedbacks, fast and slow feedbacks, and the somewhat comical iceball earth scenarios. It seems to me that modern climate science has gotten into a mode of thinking that needs correction!
At this point, I have probably discussed these issues as much as I dare. In fact, I expect these comments will be taken down within 12 hours of when I post them. Your AGW comrades and moderators don't like to hear this kind of news about their pet theories. I've been through this many times before!
- CO2 lags temperature
MA Rodger at 08:39 AM on 13 February, 2021brneilsen @629,
I'm curious as to the origin of your 'greenhouse gas response' equation T=3.2563ln(C)-3.0323. And if there were any merit in such an equation, I'd be interested to learn how it 'yields' a "0.95 degC" boost to global ice age temperatures resulting from a 190ppm to 280ppm rise in CO2. My abacus (which I would be the first to admit is not always reliable) 'yields' +1.26ºC using this bizarre equation.
The usual calculation of CO2 forcing is ΔF = 5.35 x ln(CO2[1]/CO2[0]) which gives a forcing of +2.07Wm^-2 and a thus 'direct' impact on global temperature of+0.56ºC which would cause climate feedbacks that would perhaps triple this value to +1.7ºC.
The global average temperature rise out of an ice age is usually reckoned at +5ºC to +6ºC so this calculated CO2 forcing would perhaps be responsible for a third of this temperature rise. And this result fits with assessments which find the contributions to deglaciation warming to be roughly 50% surface albedo, 37% GHGs (of which CO2 is the major player) and 13% atmospheric albedo. - 2021 SkS Weekly Climate Change & Global Warming Digest #1
MA Rodger at 01:37 AM on 13 January, 2021Dr. S. Jeevananda Reddy @16,
♥ Indeed, your book Reddy, S.J., (2008) 'Climate Change: Myths & Realities' is mostly available to read on a Google Books preview up to page 87 but pages 88-193 "are not shown in this preview".
♥ And nobody would mistake the critique within the 'blog' by William Connolley as your work.
♥ As for your assertion that my use of the adjective "erroneous" is not backed up by science, that is yet more "erroneous" input from you.
I haven't read past your comment @6 but that yields conclusive findings for me.
Your suggestions that solar or wind power are contributing to global warming is plain silly. A wind farm mixes air, and actually extracts energy locally to be transported for use elewhere. Temperature increases are simply the result of mixing of air, not the generating of warming.
A solar farm will decrease albedo but the additional solar energy absorbed is comparable to the waste heat from a fossil-fuelled or nuclear powerplant. And this is without the CO2 from a fossil-fuelled powerpalnt which will add to AGW.
Any positive climate forcing raises global temperature and this in turn will be amplified by feedbacks, particularly through the resulting higher specific humidity.
Thus you write condescendingly @6: "increased CO2 raises temperature slightly and that produces an increase in water vapour, which does have the capability of raising atmospheric temperature" but with the added comment "However, it is not the case." So how is it that a climate forcing from increased CO2 (at 3.7wm^-2 per doubling) does not increase global temperature and thus initiate further warming from feedbacks? What scientific principle could you invoke to argue such a thing? - The top 10 weather and climate events of a record-setting year
Riduna at 11:57 AM on 30 December, 2020Does the 6-7% contraction of CO2 emissions indicated at Figure 2 take into account Earth-system feedbacks such as increased release of CO2 from the burning of over 18 million hectares of forest and scrubland during the last Australian bushfire season or rising CO2/CH4 emissions from accelerating permafrost loss due to rising temperature in 2020?
Net reduction of CO2 release in 2020 due to Covid-19 constraints on the global economy are to be expected, but there appears to be no compelling reasons for believing that rapid recovery will not occur – and in some countries already has – eg. China.
As noted @ 9 above, even a temporary rise in surface temperature of 1.5°C above preindustrial produces a dangerous climate and its onset globally, possibly in less than a decade, could be particularly destructive and disruptive of human activity.
- CO2 effect is saturated
MA Rodger at 03:16 AM on 28 October, 2020aoeu @587,
The paper you link-to is apparently co-authored by the physicist and climate change denier William Happer so if it did conclude with the message presented on the article you link-to on the rogue planetoid Wattsupia, there would be no real surprise. Happer has been the author of quite a bit of arrant ninsense on te subject of climatology.
The Wattsupian take on the paper runs:-
"In plain language this means that from now on our emissions from burning fossil fuels could have little or no further impact on global warming. There would be no climate emergency. No threat at all. We could emit as much CO2 as we like; with no effect."
However, this account of the paper is total nonsense (so par for the course for Wattsupia). The paper actually concludes by saying it finds 2xCO2 without feedbacks would increase global temperature by +1.4ºC and with feedback (constant relative humidity) under clear-sky conditions by +2.2ºC, this finding close to other studies.
- 2020 SkS Weekly Climate Change & Global Warming News Roundup #37
Postkey at 18:20 PM on 16 September, 2020Steve @5
“The IPCC report that the Paris agreement based its projections on considered over 1,000 possible scenarios. Of those, only 116 (about 10%) limited warming below 2C. Of those, only 6 kept global warming below 2C without using negative emissions. So roughly 1% of the IPCC’s projected scenarios kept warming below 2C without using negative emissions technology like BECCS. And Kevin Anderson, former head of the Tyndall Centre for Climate Change Research, has pointed out that those 6 lone scenarios showed global carbon emissions peaking in 2010. Which obviously hasn’t happened. So from the IPCC’s own report in 2014, we basically have a 1% chance of staying below 2C global warming if we now invent time travel and go back to 2010 to peak our global emissions. And again, you have to stop all growth and go into decline to do that. And long term feedbacks the IPCC largely blows off were ongoing back then too.”
www.facebook.com/wxclimonews/posts/455366638536345
'Limiting global warming to two degrees Celsius will not prevent destructive and deadly climate impacts, as once hoped, dozens of experts concluded in a score of scientific studies released Monday. A world that heats up by 2C (3.6 degrees Fahrenheit)—long regarded as the temperature ceiling for a climate-safe planet—could see mass displacement due to rising seas, a drop in per capita income, regional shortages of food and fresh water, and the loss of animal and plant species at an accelerated speed. Poor and emerging countries of Asia, Africa and Latin America will get hit hardest, according to the studies in the British Royal Society's Philosophical Transactions A. "We are detecting large changes in climate impacts for a 2C world, and so should take steps to avoid this," said lead editor Dann Mitchell, an assistant professor at the University of Bristol. The 197-nation Paris climate treaty, inked in 2015, vows to halt warming at "well under" 2C compared to mid-19th century levels, and "pursue efforts" to cap the rise at 1.5C.'
phys.org/news/2018-04-degrees-longer-global-guardrail.html#jCp
If 'change' can be implemented?
“LONDON, 19 February, 2020 − Virtually all the world’s demand for electricity to run transport and to heat and cool homes and offices, as well as to provide the power demanded by industry, could be met by renewable energy by mid-century. This is the consensus of 47 peer-reviewed research papers from 13 independent groups with a total of 91 authors that have been brought together by Stanford University in California.”
Will there be change?
“Today’s global consumption of fossil fuels now stands at roughly five times what it was in the 1950s, and one-and-half times that of the 1980s when the science of global warming had already been confirmed and accepted by governments with the implication that there was an urgent need to act. Tomes of scientific studies have been logged in the last several decades documenting the deteriorating biospheric health, yet nothing substantive has been done to curtail it. More CO2 has been emitted since the inception of the UN Climate Change Convention in 1992 than in all of human history. CO2 emissions are 55% higher today than in 1990. Despite 20 international conferences on fossil fuel use reduction and an international treaty that entered into force in 1994, wo/man made greenhouse gases have risen inexorably.”
- Climate sensitivity is low
Cedders at 01:29 AM on 24 July, 2020The big news announced yesterday is the narrowing of equilibrium climate sensitivity (ECS) from a combination of paleoclimate and historical measurements and feedback modelling, a study which will feed into IPCC AR6. As I understand it, ECS is now very likely (90% likely) to be within 2.0‐5.7 °C, and likely (66% probability) to be 2.6‐3.9 °C, with a longer tail above 4.5 °C than below 2 °C. Anyone 'gambling' on low sensitivity would lose. Sherwood et al, "An assessment of Earth's climate sensitivity using multiple lines of evidence", Reviews of Geophysics, 2020. http://dx.doi.org/10.1029/2019RG000678
The following long review tells me more than I need to know about feedbacks of all kinds: Heinze et al, "Climate feedbacks in the Earth system and prospects for their evaluation", Earth System Dynamics, 2019. https://doi.org/10.3929/ethz-b-000354206
Although there may be 'black swan' events and earth-system feedbacks, the idea that climate scientists aren't including albedo or cloud changes in models is incorrect.
More recent info on feedbacks in the latest CMIP6 models is in Meehl et al, "Context for interpreting equilibrium climate sensitivity and transient climate response from the CMIP6 Earth system models", Science Advances, 2020. https://doi.org/10.1126/sciadv.aba1981 and Zelinka et al, "Causes of Higher Climate Sensitivity in CMIP6 Models", Geophysical Research Letters, 2020. https://doi.org/10.1029/2019GL085782, the latter including a nice figure S7 showing the contribution of different feedbacks in different models.
- Models are unreliable
MA Rodger at 21:03 PM on 10 July, 2020ClimateDemon @1265,
Bar moderator intervention, you are of course at liberty to parade your ignorance here.
What do you not understand about "GISS 2° × 2.5° AR5 version of ModelE"? Presumably all of it. (You might find this CarbonBrief article on GCMs useful in raising your understanding of GCMs to a less embarassing level.) And why would the values presented in the paper's Fig 2 throw any light on the complexity of the model used to generate them when, as the Fig 2 clearly states, they present "Global Annual Mean" data? Without there being more than one "globe", such a graph will only have "a single-value global temperature for each time point".
As for your little speech about "inital conditions", perhaps you can give an example of which of these "inital conditions" could be "tweeked" to alter the fundamental finding of Lacis et (2010). (Remember this simple experiment is removing some 30Wm^-2 of greenhouse effect. Such a climate forcing, even without feedbacks, is enough to drop global average temperatures by far more that the last ice age achieved.)
ClimateDemon @1266,
I assume your cunningly crafted question is intended to show that a model of an Earth-like planet's climate in which "the temperature is everywhere uniform" would not capture the topological complexity of such a planet. As Lacis et al did not use such a model, your question is entirely misplaced. - Models are unreliable
Tom Dayton at 08:36 AM on 5 July, 2020Deplore_This: Also, you seem to be overweighting the practical importance of the exact value of sensitivity. If you're in a car 200 feet from a rock wall, heading directly toward that wall, it doesn't really matter much if your speed is 50 or 60 miles per hour; the consequences are bad enough in either case that you should be applying the brakes right now. For climate change there is the additional urgency that the problem gets worse as time goes on, so even if sensitivity is on the low end, that merely delays the same bad consequences by an inconsequentially few years. Yet another time urgency comes from the fact that the primary causes (in particular greenhouse gas emissions) and feedbacks (e.g., lower albedo from loss of ice) are impossible to reverse on time scales that will be useful. Ice loss, for example, effectively is permanent on human timescales. Another problem with delaying action is that warming accelerates due to feedbacks, sort of like interest accruing on a loan. The longer you wait to pay, the more money you need to pay.
- Hansen's 1988 prediction was wrong
Nylo at 21:17 PM on 3 July, 2020MA Rodger @61 I think that what you say is good. The description by Hansen of what the evolution of methane is in his scenario A must contain an errata. Lacis claimed a 150ppbv increase in 1970-1980 instead of 1.5ppbv per year which would hardly achieve 15ppbv.
Admitting that you are probably correct and reworking my calculations accordingly, Hansen would have expected a rise of 282ppbv for the period of 2010-2020, and we have experienced only 80ppbv. So we are indeed below Scenario A emissions in terms of methane, by 200ppbv in the last decade, which would lead to around 1/8 of 0.16ºC less (by figure B1, as 200ppbv=0.2ppmv is 1/8 of 1.6ppmv), or 0.02ºC less in this latest 10 years period for which Scenario A forecast half of a degree increase (by latest Real Climate diagram shown above in @55). So based on methane and CO2 alone, we should change that 0.45ºC increase in 2010-2020 to 0.43ºC. The observed increase has been 0.26ºC so the remaining extra 0.17ºC that we have not experienced in the last 10 years must all be due to differences in CFC emissions compared to Scenario A expectations.
For CFCs (F11, F12) the forcing in the 1980s was, according to figure B2, roughly 0.02ºC. As Scenario A expected a 3% increase in emissions per year, doing the calculations the forcing in 2010-2020 for CFCs would be 2.57 times bigger than the forcing in the 80's, or about 0.055ºC. Assuming that, instead, we have experienced none, that would reduce the expected temperature increase in that scenario for this decade if we use actual instead of modelled emissions by 0.055ºC. The +0.43ºC warming that the model would have predicted by replacing methane projections with actual values, goes down to +0.375ºC if we do the same with CFCs. And again, we have witnessed +0.26ºC. Hansen projections seem to be off by approximately 44% (44% more warming in his models than in real world).
Am I ignoring something else perhaps? Feedbacks to radiative forcings? Would those change the 0.075ºC of combined radiative forcings of the differences in methane and CFCs between model and reality, to the needed +0.28ºC difference between Scenario A predictions and observations? That would require a feedback level of more than 3.5 to the forcings.
- Models are unreliable
scaddenp at 07:44 AM on 3 July, 2020Climate models are around 0.5 million line of code created by discipline experts for each of the climate processes. Starting from scratch to write your own is somewhat ambitious. Note that they are not statistically based so I am skeptical that a background in stats or operations research would help you much. The background requirement is numerical solution to systems of partial differential equations. No shortage of courses of these.
I cannot comment on US university or course, but going into serious atmospheric sciences here would be based on undergraduate degree in physics and maths. The numerical solution of systems of partial differential equation is specialist area of mathematics - numerial analysis. Our institute (geology/geophysics) typically has mathematicians, programmers and subject specialists working together on problems of this kind of class.
I still think predicting the base level of future isnt that hard. If surface irradiation increases, then surface gets warmer. The complicated bit is by how much will feedbacks magnify that effect. (Equilibrium Climate Sensitivity) And yes, predictions of future are based are done by AOGCMs. However, there are also paleoclimate constraints on climate sensitivity. Too crude compared to models but good enough to cause serious concern. Again, the WG1 report is good place to find the papers on emperical constraints on climate sensitivitiy. - Models are unreliable
ClimateDemon at 21:53 PM on 2 July, 2020I agree that over the past century, the state-of-the-art of modeling and simulation has grown by leaps and bounds, especially since the development of supercomputers in the 1980s. They have been valuable tools for research and development in general, not just climate science. It should be noted, however, that such models are meant to aid scientists in their understanding of certain phenomenon, possibly identifying causes and even making short-term general predictions. They are NOT meant for government use to generate long-term predictions (which no model can do reliably), and use them as a basis for carbon taxes and regulations.
In order for a model to accurately predict climate change, it must take into account the dynamics of atmospheric fluid motion, realizing that the atmosphere is not in thermal equilibrium. [If it were in thermal equilibrium, there would be a uniform temperature and humidity over the entire surface with no winds nor storms.] This involves solving the time-dependent equations of mass balance (equation of continuity), momentum balance (Navier-Stokes equation), and energy balance which is what is done in the climate General Circulation Models. This is a set of partial differential equations that are first order in time which are generally solved in time by some type of finite difference method given the initial conditions. Note that the terms "forcings" and "feedbacks" aren't even in the vocabulary. Therefore, if there is H2O vapor in the air, its greenhouse effect is accounted for in the energy balance equation. If there is CO2 in the air, its greenhouse effect is also accounted for in the same energy balance equation. The contributions from the H2O greenhouse warming will, of course, be much greater than those of the CO2 warming, but there is nothing to indicate that CO2 has any "control knob" effect.
The only model that predicts AGW and the CO2 control knob is the one used by Lacis et. al. 2010, the staff here at SkS, or wherever AGW is preached. This is a highly oversimplified, zero dimensional model in which the earth's temperature is represented by a single scalar value T, and the H2O vapor concentration is determined by the Clausius-Clapeyron equation at temperature T. This means that the entire globe is rigidly held to this one fixed value of temperature and corresponding value of humidity, which we know is false. Furthermore, it assumes (through the Clausius-Clapeyron equation) that H2O in its vapor state and condensed states are in constant thermal equilibrium with each other, which is also false. At this point, AGW advocates generally understand the (invalid) argument as to how CO2 becomes the controlling GHG even though it is much weaker than H2O vapor, so I won't repeat it here. In general, those who preach the doctrine that a non-condensable GHG can only be a “forcing” and a condensable GHG can only be a “feedback” have been duped by the fallacies and self-inconsistencies of this “carbon-in-control” model. Another false manifestation of this model is the frozen earth scenario where all CO2 is eliminated, and as a result, there is no non-condensable GHG in the atmosphere to provide the temperature forcing needed to put H2O vapor, the stronger GHG, in the air. As a result, the entire terrestrial greenhouse effect collapses since there isn’t any of either GHG in the atmosphere, thereby leaving an iceball of an earth behind. Aside from the highly anti-intuitive nature of this prediction, it would be totally impossible to test it.
So what should we do about this CO2 control-knob theory? Do we say "It's what the science says, so we must accept it since we are scientists.", or do we do some critical thinking and say "It took several false assumptions to make the control knob argument, so there are very likely problems with it."?
- PETM climate warming 56 million years ago strongly tied to igneous activity
ubrew12 at 08:55 AM on 23 May, 2020Part 3: "both the Gutjahr et al and Jones et al research suggests that any amplifying feedback from an extra carbon reservoir (like clathrates or permafrost) was small if it existed at all in the PETM world" The reason for this seems to have been answered in Part 1: "[to have caused the PETM]...a large reservoir of clathrates...[needed] to be there... We know they exist in today’s seabed but the Paleocene ocean was much warmer than today’s, so the reservoir was probably as good as empty [... and the lack of permafrost as a PETM trigger is similarly explained]."
So we may not be out of the woods, on feedbacks, just yet.
- PETM climate warming 56 million years ago strongly tied to igneous activity
howardlee at 23:49 PM on 20 May, 2020William - the focus is now very much on what feedbacks added to, or reduced, the PETM warming. As you can see from the quotes here, some scientists see a larger role for feedbacks than others, but the Jones et al and Gutjahr et al papers point to a modest role for them in relation to the igneous-liberated methane and the volcanic CO2. This hinges on very high emissions - but is in line with a new paper for the end-Triassic mass extinction: https://www.pnas.org/content/early/2020/05/12/2000095117
- Milankovitch Cycles
scaddenp at 07:46 AM on 4 May, 2020There is a useful little summary of the Milankovic cycles in Physics Today, including the critical feedbacks
- We're heading into an ice age
MA Rodger at 23:47 PM on 26 April, 2020Lawrence Tenkman @407,
To clear up the "parting comment", it appears in a 2015 blog-post linked at the last paragraph of #405 above. The denialist flavour of this "parting comment" does explain some of the very odd comment in Ellis & Palmer (2016).
The 'CO2 mechanism' I say is not explained is specific to the glacial maxima. Ellis & Palmer (2016) demonstrate temperature, dust and CO2 are correlated (in their figs 1, 4, 8 & 9). We could also include sea level/ice volume and methane into such correlations. So the question arises - What is driving what?
During the drop into an ice age we can be reasonably confident that reduced northern insolation allows a build-up of northern ice sheets reducing regional albedo which has a global impact on temperature and kicks-off positive feedbacks in albedo, CO2 & methane.
But the glacial maxima appear to have a particular pattern to them, perhaps clearest when sea level is considered. The Ice Ages step up a gear as they dive into the maxima.
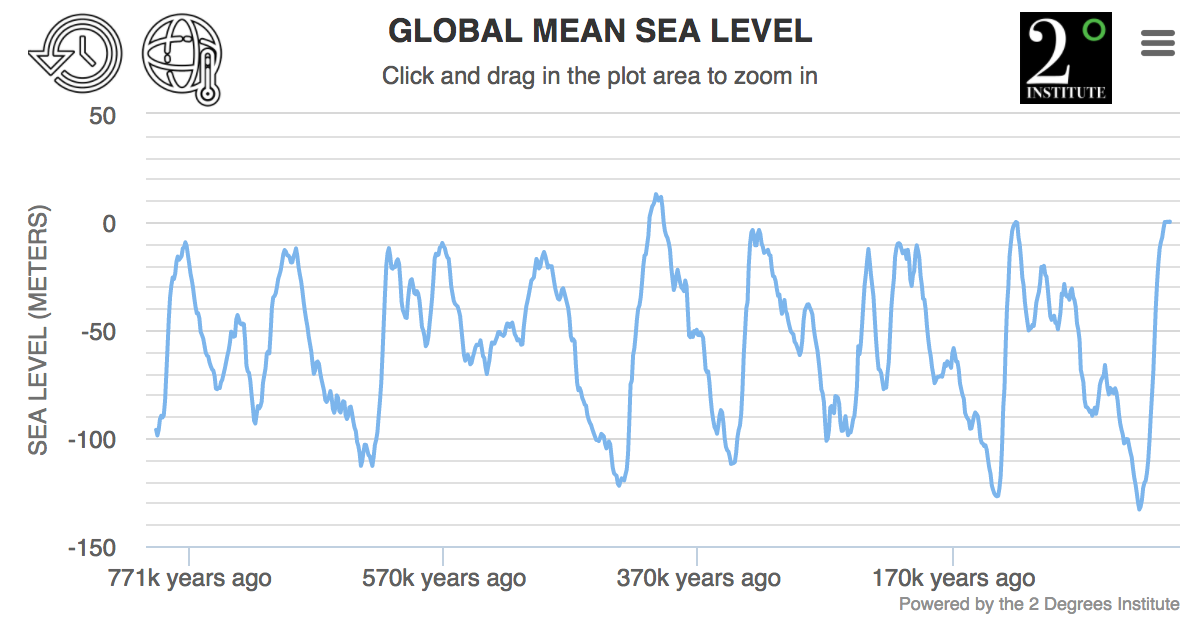
Ellis & Palmer point the finger at the CO2 feedbacks. They would have difficulty using albedo as the dust-levels are building at these points in the Ice Age cycle and Ellis & Palmer dismiss the idea of atmospheric dust-levels being a significant cooling factor.
Given the constraints placed on the workings of Ice Age maxima by Ellis & Palmer, their hypothesis seems to rely on some strong CO2 feedback that comes into play at this point in the Ice Age cycle. So my question - Are the measurements of CO2 showing a big enough reduction? What is causing these large reductions in CO2? And what causes these reductions to quickly reverse when the maxima is over?
And not greatly removed from any discussion of 'CO2 mechanism'....
Regarding the lack of 'threshold' for dust levels to bring Ice Ages out of their maxima, Ellis & Palmer Fig 4 (below) shows great variation in the peak level of dust as well as variation in the duration of high-dust prior to the glacial maxima. This I term a lack of 'threshold'. The general impression is that a generally high level of dust reducing albedo of global ice sheets awaits the increase in nothern insolation caused by the Milankovitch cycle.
But surely this variability means the power of the dust-reduced albedo forcing is not strong enough of itself to be the trigger. It is possible that analysis would show the Milankovitch cycle and the dust-albedo in combination provides a consistent threshold level, or perhaps CO2 levels are also a factor in the mix. But such necessary analysis would require an approach somewhat less simplistic than Ellis & Palmer. (For instance, compare the Ellis & Palmer approach with that of, say, Willeit & Ganopolski (2018).)

I think that covers the issues from #407, hopefully in an understandable form.
- We're heading into an ice age
MA Rodger at 23:24 PM on 25 April, 2020Lawrence Tenkman @402,
I did manage a read-through of Ellis & Palmer (2016). I note it isn't published properly which is likely why it fails to get mentioned within the literature. (It is published here but only as an “unedited manuscript” which was to “undergo copyediting, typesetting, and review of the resulting proof before it is published in its final form.” I see no “final form.”)
There is within Ellis & Palmer mention of “another story for another day” with the suggestion that this would add to the grand theorising with explanations of Dansgaard-Oeschger events and the mid-Pleistocene transition. A paper co-authored by Ellis has appeared on the web explaining the pre-MPT 41ky Ice Age cycle as resulting from there being an extra southern-driven version of the Ice Age cycle which post-MPT ran out of land in the post-MPT permanently-iced-over Antarctica and leaving only the northern-driven post-MPT 100ky Ice Age cycle.
I'm not sure how the pre-MPT cycles would fit in with the Ellis & Palmer theory of dusty interglacial-triggering. (The appearance of interglacials in beat with the orbital eccentricity wobble is described in this follow-on thesis as purely coincidental. The frequency is defined by the 70ky it takes to prime the system with ice.)
The absence of proper follow-on work, of publication or of citations is a kiss of death to theories such as set out by Ellis & Palmer. But that does not explain what it says or why it is wrong to say it.
Ellis & Palmer (2016) is a poor piece of work. It occasionally says some very silly things but I shall ignore those. It also gallops past the science rather than addressing it, indeed describing it as “scientific lacuna.” But I shall here ignore such hubris.
The grand theory presented explains that the precession/obliquity within the Milankivitch cycles does not always lead to an interglacial and that this is not immediately explained by CO2/albedo alone. To cause an interglacial Ellis & Palmer invoke a dusty atmosphere which reduced ice albedo and, as warming takes hold, adds to this albedo reduction when warming brings greater levels of dust to the melting ice surface.
They say the dust results from reduced CO2 which causes lower tree-lines globally and this increasing dust as plant-less dusty mountain tops grow into dusty mountains and then dusty hills with the lowered tree-line. A correlation of dust and CO2 is presented. This dust-correlation could be made with many other different factors so is effectively an exercise in curve fitting with the low-CO2>>high-dust relationship remaining speculative.
What is also not explained in all this is the mechanism driving the CO2 reduction and why this cooling doesn't keep on going. The peak-dust levels do not appear to have a threshold level and if there is a CO2/ice-volume/Milancovitch/dust mechanism at work it has yet to be convincingly demonstrated.
So without further work beyond those referenced here, work to fill in the gaps and thus enable this allegedly important theory to be properly published, it is fair to say that not a great deal has been done since the initial appearance of this work in 2015 which was then, with its parting comment “So the only evil in this world is not in the atmosphere, it lies in the hearts of those who wish to starve plants and animals of their most essential food supply — CO2. “, certainly more work concrened with denialsim than with scientific analysis.
- YouTube's Climate Denial Problem
Philippe Chantreau at 03:14 AM on 6 April, 2020Dudo39,
"As far as I know"...
How far is that? How much exploring have you done?
Judging by the content of your post, nowhere near enough. Climate models are not statistical models, they are physical model. Plenty of info on that on the appropriate thread, and from NASA. Water vapor and cloud feedbacks have been extensively studied and figure in models. There are nunerous papers published by NASA and NOAA on their methods to adjust data, the reasons to do so and the benefits that it yields. Hint: it does not make temperatures look warmer. Appropriate threads for that also, not difficult to find, use the search function.
- It's CFCs
EGS at 02:40 AM on 7 March, 2020This is clearly outdated. Polvani et al. showed that ozone depleting chemicals alone account for 1/3 of all anthropogenic global warming between 1955-2005. The papers I cited above all show that anthropogenic, CH4, N20 O3, and black carbon contribute more than previously thought. I don't understand why these far more potent anthropogenic greenhouse gasses/particles get relegated to relative insignificance, not least since CFC, HFC, SF6, tropospheric O3, N02, and black carbon have unambiguous anthropogenic sources. Increased ppm of C02 is also anthropogenic, but you can't impute the kind of radiative forcing and amplification feedbacks to it and not apply those to these even more potent greenhouse gasses, otherwise there would have been far more warming than we have been able to measure. Something has to give up some radiative forcing in oder to get anything like the warming we have been able to measure. The underappreciation of CFCs and other GHGs is likely why climate models have been running hot. Michael Mann is himself aware that there are problems with the climate forcing theories. He coauthored a paper in Nature Geophysics in 2017 (https://www.nature.com/articles/ngeo2973) that argued that the failure of climate models to align with the measured level of tropospheric warming since 2000 is unlikely to have been caused by natural variability and model error in climate sensitivity but rather in “systematic deficiencies in some of the post-2000 external forcings used in the model simulations.“
- It's CFCs
EGS at 01:42 AM on 7 March, 2020Could ozone depleting chemicals and the other GHGs (with a large revision downward of CO2 radiative forcing and amplification feedbacks?) explain a modestly warming upper troposphere, higher tropopause, and a cooling stratosphere that are among the markers of anthropogenic climate change? Wouldn’t that also align with the strong empirical evidence of very little global warming since the preindustrial era until 1950 that then really accelerated after the 1950s and 1960s as CFCs, HFCs, halons, and SF6 emissions skyrocketed from their industrial use as refrigerants, solvents, propellants, and electrical insulating gasses? The spike in anthropogenic warming from N20 and CH4 could likewise be timed with the massive intensification of agriculture enabled by large-scale application of nitrate fertilizer and changes in land use patterns (deforestation) accompanying the green revolution since the 1970s. This was a time that was also accompanied by dramatically increased diesel tractor and diesel vehicle use, skyrocketing bunker fuel emissions from the expansion of container shipping, and rising heating oil emissions from a switch from coal to oil, which could account for much of the rest of the increase in N20, much of the tropospheric O3, and a large part of the fine particulate emissions increases. The timing of the acceleration of warming would also strongly imply a weaker climate sensitivity to C02 forcing and a greater cumulative forcing of these other greenhouse gasses. It was, after all, in the 1980s and 1990s that global warming really accelerated, not earlier. Would that not also align well with the much stronger warming over the poles (mostly accounted for by CFCs, HFCs, N20, tropospheric O3), strong stratospheric cooling from the depletion of/hole in the polar stratospheric 03 layer, and the much weaker than expected tropical upper tropospheric temperature anomoly and the weaker than expected deep ocean warming?
- Skeptical Science New Research for Week #9, 2020
MA Rodger at 20:31 PM on 6 March, 2020swampfoxh @1,
Your question doesn't 'ring any bells' with me and the authors you mention don't seem to lead anywhere that I can see.
The 1,500 year timescale is occasionally mentioned as the time it takes the ocean waters to re-appear at the surface and so reach CO2-quilibrium with the atmosphere. That is part of what Goreau (1990) 'Balancing Atmospheric Carbon Dioxide' addresses but it is not the same as timescales for temperature equilibrium under otherwise-fixed CO2 levels.
Rohling is the lead author of Rohling et al (2009) 'Antarctic temperature and global sea level closelycoupled over the past five glacial cycles' and this does consider multi-millennial equilibrium timescales but this concerns sea level. There is a connection in that the melt-out of, say, Greenland would both impact sea level and temperature as the albedo change constitutes a slow climate feedback (see this SkS post). But over such multi-millennial timescales with Milankovitch cycles in operation, it would require more than "modest" climate forcings to be significant.
More directly addressing your question, the ice cores do show a small increase in CO2 levels over the last 8,000 years. This would provide roughly a 0.3Wm^-2 climate forcing which (slow and fast feedbacks so perhaps a sensitivity of 6ºC) could have given a total temperature rise of +0.5ºC. Yet spread over eight milennia, any residual effect today would be now miniscule.
- It's CFCs
EGS at 12:25 PM on 6 March, 2020Would that not be evidence that climate sensitivity to CO2 must be much lower than previously modeled? These other GHGs would presumably have the same water vapor amplification feedbacks as CO2 (as non-condensing atmospheric gasses) and produce the expected lower adiabatic lapse rates of warmer water vapor, would they not? Or does water vapor resonate more readily with the discrete wavelengths of infrared radiation emitted by vibrating CO2 molecules? Are those wavebands already saturated so that any additional CO2 emissions can’t add much more radiative heat? In other words, if CO2 is as radiatively powerful as modeled, there should have been dramatically more global warming since the onset of industrialization, especially since the 1950s when these other GHGs really began to be emitted on a very large scale.
- It's CFCs
EGS at 06:46 AM on 6 March, 2020Very recent work led by Lorenzo Polvani and an international team of scientists just published in January 2020 by Nature Climate Change (https://www.nature.com/articles/s41558-019-0677-4)
argues that large amounts of global and arctic warming are actually due to ozone depleting chemicals (CFCs, HFCs, other halons, and nitrous oxide [N20]), no less than 1/2 of all warming in the arctic and no less than 1/3 of all global warming between 1955 and 2005. These ozone depleting chemicals are trace gasses measured in parts per billion but have global warming potentials 100s to many 1000s of times greater than CO2. CFC-11 and CFC-12 are 19,000 and 23,000 times more radiatively efficient than CO2 per molecule. The global warming impact of methane has apparently also been underestimated, with one new study by Hmiel et al. in Nature arguing that anthropogenic CH4 releases have been 25-40% greater then previously thought (https://www.nature.com/articles/s41586-020-1991-8). Another study by Thompson et al. in Nature Climate Change from November 2019 showed that N20 emissions have been rising far more than the IPCC had assumed since 2009 (by an estimated factor of 2.3!) (https://www.nature.com/articles/s41558-019-0613-7). According to the US EPA, the global warming potential of N20 is 265-298 times greater than CO2 over a 100 year timescale (https://www.epa.gov/ghgemissions/understanding-global-warming-potentials). Tropospheric ozone (O3) is both a potent direct greenhouse gas and plays a role in the lifetime and effectiveness of other greenhouse gasses. According to research by Jim Hansen and others published in the Journal of Geophysical Research (2006), tropospheric O3 is estimated to have caused no less than 1/3 to 1/2 of the observed recent trends in arctic warming in the winter and spring, when O3 is easily transported to polar regions from lower latitude urban centers https://agupubs.onlinelibrary.wiley.com/doi/10.1029/2005JD006348. Tropospheric O3’s direct cumulative radiative forcing when combined with fine particulates like black carbon is believed to possibly outweigh that of all the CO2 released since the beginning of the industrial era https://www.pnas.org/content/pnas/early/2010/02/02/0906548107.full.pdf. Sulphur hexaflouride (SF6) is perhaps the most potent anthropogenic greenhouse gas, and its emissions have been rising rapidly from use as an electrical insulator. Its 100 year global warming potential per molecule is estimated at 23,000 times that of C02. Its atmospheric abundance is low at 8.60 parts per trillion volume, but it is rising at a linear rate by 0.33 pptv per year and can persist in the environment for more than 1000 years. https://www.atmos-chem-phys.net/17/883/2017/acp-17-883-2017.pdf
Would that not be evidence that climate sensitivity to CO2 must be much lower than previously modeled? These other GHGs would presumably have the same water vapor amplification feedbacks as CO2 (as non-condensing atmospheric gasses) and produce the expected lower adiabatic lapse rates of warmer water vapor, would they not? Or does water vapor resonate more readily with the discrete wavelengths of infrared radiation emitted by vibrating CO2 molecules? Are those wavebands already saturated so that any additional CO2 emissions can’t add much more radiative heat? In other words, if CO2 is as radiatively powerful as modeled, there should have been dramatically more global warming since the onset of industrialization, especially since the 1950s when these other GHGs really began to be emitted on a very large scale.
- Climate's changed before
KR at 02:50 AM on 25 February, 2020theSkeptik - " I would assume that both greenhous gases and temperature are correlated to other parameters"
Well, yes, because physics. Long lived non-precipitating greenhouse gases in the atmosphere (CO2, CFCs, Methane) reduce IR emissions to space from the top of the atmosphere, which causes an imbalance of energy in the climate against incoming sunlight, and the climate therefore warms until radiated energy once again equals incoming.
Along the way there are feedbacks both (mostly) positive and (some) negative which on the whole amplify the temperature response, such as changing CO2 solubility in the oceans, changing Earth albedo by melting snow over darker landscapes, methane releases from warming permafrost, and as a fast response changes in absolute humidity due to warm air holding more water vapor (itself a greenhouse gas, although as a feedback, not a driver).
Physics comes first - correlation analysis to determine the exact amplitude of the response between drivers and the climate comes later.
- Earth is heating at a rate equivalent to five atomic bombs per second
MA Rodger at 21:44 PM on 16 February, 2020rip71749,
Regarding the energy from burning fossil fuels, there is an SkS graphic illustrating the relative size of the various global energy inputs.I feel that 3.7Wm^-2 figure requires some further explaining. It is the value of Climate Forcing, the global energy imbalance, that would result from a doubling of CO2 which, without feedbacks, would result in a global temperature increase of +1ºC. These values are explained by the solar warming (less albedo) being globally 240Wm^-2 which thus gives an effective planetary temperature of (240/5.67e-8)^0.25 = 255K. Add 3.7Wm^-2 and it becomes 256K. These values, of course, apply high up in the atmosphere but the temperature increase from any forcing also applies to the surface temperatures as the lapse rate acts in a linear fashion down through the atmosphere.
Additional to the initial forcing, there are feedbacks which increase the warming. They act as the global temperature rises, this temperature rise meaning the initial climate forcing is being equalised. Thus the feedbacks do not appear as an increased energy imbalance but instead extend the temperature effect of the climate forcing as it equalises with rising temperature.
Now, at any particular time during AGW (where the Climate Forcing is applied slowly over a period and not all at once) the energy imbalance which is warming the globe (and so theoretically available to melt Greenland ice) will be far smaller than the accumulative Climate Forcing since pre-industrial times. Much of this Climate Forcing (and as negative forcings are poorly defined, the value of net Forcing since pre-industrial is imprecisely known but it is usually quoted as very roughly 2Wm^-2) will have been balanced by the global temperature increase since pre-industrial. It is solely the remaining energy imbalance that is available for melting ice caps, this running presently at something like 1Wm^-2.
From the imbalance, there is then perhaps something like 16ZJ/year entering the climate which, if it could be brought to bear on Greenland's ice, would melt Greenland in something like 50 years. Of course, getting all that energy imbalance to Greenland would be impossible but if the ice were to set off across the oceans, it does become possible. Indeed, having melting icebergs bobbing about at lower latitudes would lower the global temperature and this will increase the global energy imbalance. (This is the mechanism behind the hypothesis set out in Hansen et al 2016.)
Hope all that makes sense. - CO2 effect is saturated
Sgt_Wookie92 at 10:19 AM on 16 January, 2020Hello,
Most denier arguments i receive i can answer & understand thanks to studies in mechanical engineering and having a decent grasp on the science behind what im reading. But this one has me stumped as its not an area im well versed in, and im wondering if anyone can afford the time to help me understand if what he is saying is correct/incorrect, and why:
___________________You are linking to Skeptical Science which is under the control of cartoonist John Cook and his friends. This website has been repeatedly known to provide false information and is deceitful. But I will address the issues raised here in the claim that the effect is not saturated.
There is a limited amount of IR emitted from the Earth at each frequency.
At the center of the 15 micron band ALL of the IR is captured by CO2. There can be no more captured. This is not up for debate in any way shape or form.
The method by which IR is captured by CO2 depends upon the ability of the CO2 molecule to match the IR being emitted in both frequency and in orientation of the charge formed by the atoms. The frequency of IR has to match the frequency of the CO2 molecules. It also has to match the orientation in space of the charge of the molecule.
The CO2 molecule vibrates at a certain frequency determined by the atomic weights and charges of the Oxygen and Carbon Atoms. This frequency has a minor variation from the center frequency as one travels outward from the center of the 15 micron band.
SO as more CO2 molecules are added to the atmosphere we see absorption increase at the center of the 15 micron band so that total absorption of all the IR is accomplished closer to the ground. No additional IR becomes absorbed. The Center becomes saturated with respect to its ability to absorb IR. No more IR is absorbed in the center.
Will some CO2 molecules added capture a few additional IR photons further from the center. Yes, But the numbers will be constantly declining in a logarithmic fashion because the CO2 is not vibrating at the correct frequency. This declining logarithmic function is well known because the frequency distribution of the CO2 molecule causes it to not absorb IR at the edges of the 15 micron band. This gives rise to the requirement of a doubling of CO2 per unit increase of temperature. So if for example there is a 1 degree increase for a doubling of CO2 then for the next degree of increase you need 4 times as much CO2 added.
The function of the ability of CO2 to absorb IR follows a bell as it drops off. Only at the Center of the 15 micron band can any absorption of note take place.
The analogy of restricted flow given in the website is totally wrong. You are not adding water which is restricted by the diameter of an outflow pipe. You are adding heat to the atmosphere which has several methods for releasing it from the Earth, As CO2 populations are added there are more molecules in the stratosphere and above to release the energy to space. CO2 does not just stratify near the ground. Further CO2 does not act as a reservoir for IR energy. The energy is spread over all the atmospheric particles s kinetic energy. Oxygen, Nitrogen, H2O are all absorbing the kinetic energy and being transported vertically and toward the poles throughout the atmosphere.
CO2 molecules become re-excited at every level of the atmosphere via collision. 1.4 % in the 15 micron band frequencies. Throughout the atmosphere below the Stratosphere, The re-excitation of these molecules is a net reduction in atmospheric temperature. Eventually there are feedbacks that serve to increase emission to space such as convection, transfer via circulation of Hadley Cells to the poles and the fact that at the poles emission to space takes place at a lower height. If these feedback mechanisms were not present the Earth would have burned to a cinder long ago. But in the lower atmosphere the excited molecules are quenched again and again by collision they cannot add to the temperature because they subtracted from it to become excited once more.
So why is there this idea that CO2 can absorb outside its natural frequency range floating about on Skeptical Science? Because there are experiments performed with CO2 laser systems where the populations within the laser are manipulated artificially and you CAN cause an expansion of the absorption range by applying charges. It does not occur naturally. But you are considered a know nothing by SS and they have no objection to misleading you. within the laser. this does not occur in the natural world.
The explanation of IR escaping from higher colder regions therefore less IR can escape because it is not energetic enough? Well Electromagnetic radiation energy levels are not determined by temperature. They are determined by frequency. Every electronic technician will tell you that a received signal strength depends on frequency. For example to transmit a VHF TV signal requires substantially less current draw than to transmit a UHF TV signal. That is why Channel 6 in Philadelphia refuses to switch to a UHF channel. The range of the signal is lower but it costs OH so much less. If a 15 micron band photon escapes then a 15 micron band photon escapes and the energy levels are the same.
The idea of IR re-radiation is a false one. Because the collisions in the lower atmosphere constantly are quenching an excited CO2 molecule before it can re-emit. The timing constants are on the order of a billion collisions to one re-emission governed by the Einstein A co-efficient. Only in the upper atmosphere where the molecules are far enough apart to allow for there to be no quenching by collision is there any significant re-emission. This is how the Earth loses energy.
The AERI instruments at the Great Plains and North Slope of Alaska detect IR directly. They are designed to detect a range of frequencies and CO2 is one of them.They are unable to detect incoming CO2 IR without manipulating the received signal against a model frequency. The signal is so small that it can be dismissed as an artifact of generating the simulated signal.
The concept of IR scattering is a false one. The photon either passes through the atmosphere or it is absorbed. At the edges of the absorption curve some IR photons radiate directly to space at 186000 miles per second and some is absorbed and converted directly to heat. It depends on whether or not the CO2 molecule is resonant with the photon frequency.
___________________
any assistance is greatly appreciated, just looking to further understand the issues and evidence/counterevidence i may come across
- CO2 lags temperature
MA Rodger at 00:28 AM on 15 January, 2020TomJanson @612,
I'm not sure what you mean by things being "statistically correlated" so cannot say more than that the usual statistical correlation is a two-way street and that possibly you are considering the idea of 'causality' rather than 'correlation'.
The CO2 feedback has more than a single source, the 'feedback' being the net result of a series of primary feedback, both positive and negative. Consider the rise in temperature out of an ice age which sees a net increase in CO2 - the ice melts adding 3% to ocean volumes which, now melted, will absorb CO2 to gain equilibrium with the existing ocean and atmosphere. The melt-water thus acts as a negative feedback, reducing the atmospheric CO2 levels.
For feedbacks to be strong enough to cause a 'runaway' temperature, they need to be at least as strong as the temperature rise/fall that they result from. If they are, for instance, just half as strong, the feedback temperature rise/fall would be 0.5+0.25+0.125+0.0625...=+1 x the temperature rise/fall that they result from, a long way from 'runaway'.
- The never-ending RCP8.5 debate
Nick Palmer at 10:00 AM on 8 January, 2020Sorry if I went outside the forum rules. While I was writing #41 I was simultaneously taking on a very tricky, very agressive denialist/sceptic and I probably slipped into the mindset I use when taking on such types, which I have found extremely effective - not at convincing them (which is very hard) but it is one of the best techniques I have discovered for drawing out into the open, where the audience can see them, 'what lies beneath' - the underlying motivations that make such types so incorrigible. Call into question their rationality or intelligence and 9 times out of ten they will come back with stuff attacking one's own position which reveals that they are mostly hard line right wingers scared of left wing solutions, a smattering of evangelicals who believe God so loves us that he has designed Earth with hidden negative feedbacks which will prevent us doing anything much, or (rare these days) hard line left wingers who believe climate science was faked up so the West can deny energy and development to the Third World.
- The never-ending RCP8.5 debate
MattSq at 16:12 PM on 31 December, 2019Not a climate scientist, my background is in managing technology risk, but I'd observe from parallels in the issues:
1. Deciding what's the worst 'credible' risk scenario is invariably contentious because it drives policy debate and usually also has an associated high degree of uncertainty. However you do need to bound it otherwise you start dealing with risk that is effectively infinite.
2. Using a worst possible scenario that is not credible is generally counter-productive due to the so called anchoring cognitive bias. Once you've stated it becomes very hard to argue people away from this scenario (just ask the nuclear safety community) when you figure out that it's not going to be that bad.
3. Retaining RCP 8.5 because it addresses/covers as yet undetermined uncertainties in the physical models about carbon feedbacks is not (I think) a good practice. Better to explicate those uncertainties in the physical model and explore their effects there.
4. If there's uncertainty about the worst credible RCP scenario then model it as a family with associated epistemic degrees of belief and run a monte carlo simulation on them.
- There is no consensus
Estoma at 22:22 PM on 19 December, 2019I don't make many posts but as far as my knowledge of Lindzen, he's always been a luke warmer who believes the doubling of CO2 will only produce a temperature rise of 1 degree celcius, ignoring any type of feedbacks. We've already risen 1 degree and we've increased CO2 less than 50% of a doubling.
In addition, his Iris effect theory, that as temperature increases they'll be less moisture and fewer clouds that will cause more infrared radition to escape has been shown by several studies since then, to not be the case.
- COP25: Key outcomes agreed at the UN climate talks in Madrid
One Planet Only Forever at 02:44 AM on 19 December, 2019A clarification of my comment @5,
Talking about 'Human impacts on The Greenhouse Effect' is actually impossible because the Greenhouse Effect is an aspect of physical reality that humans cannot alter.
All that humans can do regarding the Greenhouse Effect is try to determine a fair comparison of the way to count the climate change impacts of a unit of one ghg vs. another.
An example is the scientific efforts to establish the proper understanding for the political arguments about how much global warming and climate change impacts a tonne of methane released due to human activity (including farming and livestock activity, and including feedbacks of human caused warming like melting permafrost) should be assigned compared to a tonne of CO2 released due to human activity.
- There is no consensus
scaddenp at 06:46 AM on 16 December, 2019Just a minor point - anyone saying "they cant get their papers published" - in any field, let alone climate science, - ask them to publish their reviewers comments. I will bet that most wont, largely because I think the "papers" are mythical and simply a rhetorical point, but others would be embarrassing. If they are prepared to do so, then sure, you can read the comments and see whether you think the reviewers have a point.
As to sensitivity, someone who thinks ECS is 1 degree is frankly a denier not a skeptic. This requires the existance of unobserved negative feedbacks and really only "exists" in the statistical evaluation of error not in the physics. Against this is the overwhelming evidence of net positive feedback.
You need speculative processes to drive the ice-age cycles with a sensitivity of 2.0 or less. On the other hand, an ECS of 2.5 or higher fits well with known physics, observations and models. That is where the evidence is pointing. Lukewarmers are generally trying frantically to magnify unquantified uncertainties to support a ideologically or identity based positions. Wishful thinking not evidence-based thinking. - Skeptical Science New Research for Week #48, 2019
John Hartz at 08:46 AM on 7 December, 2019Doug @13: Here's the "About" statement posted on the website of MIT's Center for Global Change Science (CGCS). Note the final paragraph in particular:
The Center for Global Change Science (CGCS) at MIT was founded in January 1990 to address fundamental questions about the global environment with a multidisciplinary approach. In July 2006 the CGCS became an independent Center in the School of Science. The Center’s goal is to improve the ability to accurately predict changes in the global environment.
CGCS seeks to better understand the natural mechanisms in the ocean, atmosphere and land systems that together control the Earth’s climate, and to apply improved knowledge to problems of predicting global environmental change. The Center utilizes theory, observations, and numerical models to investigate environmental phenomena, the linkages among them, and their potential feedbacks in a changing climate.
The Center builds on existing programs of research and education in the Schools of Science and Engineering at MIT. The interdisciplinary organization fosters studies on topics as varied as, for example, oceanography, meteorology, hydrology, atmospheric chemistry, ecology, biogeochemical cycling, paleoclimatology, applied math, data assimilation, computer science, and satellite remote sensing.
CGCS sustains a program of discovery science with research on the natural processes in the global environment, concentrating on the circulations, cycles and interactions of water, air, energy, and nutrients in the Earth system.
Parallel CGCS activities incorporate the insight gained into climate prediction models, and climate policy analysis, with the aim of providing it in a useful way to decision-makers confronting the coupled challenges of future food, energy, water, climate and air pollution (among others). The CGCS also interacts with complementary MIT efforts in the Environmental Solutions Initiative, the Energy Initiative, and the Earth Resources Laboratory.
Given that cutting-edge research about carbon capture is occurring at MIT, you might want to nose around the CGS website to see if your question is being addressed.
- Climate's changed before
MA Rodger at 00:22 AM on 23 November, 2019Eclectic @805,
I think the reason for the 4,500ppm is probably that such levels of atmospheric CO2 have been found in studies for the early Phanerozoic, indeed perhaps higher. And if all the fossil fuels were burnt [they reckon coal reserves are perhaps 1,000Gt(C) with oil & gas perhaps another 500Gt(C)] you'd 'only' raise CO2 by some 350ppm with perhaps natural feedbacks adding as much again. So mankind would be hard pressed to 'achieve' a 4,500ppm level of CO2 by fossil-fuel-use alone.
- It's the sun
scaddenp at 12:55 PM on 7 November, 2019socialfox - estimates of climate sensitivity seek to answer what would the change of temperature for a given effective increase in radiation at TOA. Changes in GHG concentration, albedo are back-calculated to an effective change in TOA radiation. ie. As if the incoming solar radiation was changing. The direct contribution to radiative flux from a change in GHG is a known quantity (~4W/m2 for a doubling, which falls out the Radiative Transfer Equations and has been empirically verified in various ways). It is not something deduced from the temperature response, but resultant feedbacks (water vapour, albedo, cloud cover) that contribute to actual change in temperature are not well known and hence the wide range of estimates for climate sensitivity. Climate sensitivity is estimated from a variety of methods including paleoclimate and models.
Note that models do not assume a climate sensitivity - it is an emergent property from the model so I dont see the circularity.
- Tipping Points: Could the climate collapse?
Postkey at 17:01 PM on 26 October, 2019“The IPCC report that the Paris agreement based its projections on considered over 1,000 possible scenarios. Of those, only 116 (about 10%) limited warming below 2C. Of those, only 6 kept global warming below 2C without using negative emissions. So roughly 1% of the IPCC’s projected scenarios kept warming below 2C without using negative emissions technology like BECCS. And Kevin Anderson, former head of the Tyndall Centre for Climate Change Research, has pointed out that those 6 lone scenarios showed global carbon emissions peaking in 2010. Which obviously hasn’t happened.
So from the IPCC’s own report in 2014, we basically have a 1% chance of staying below 2C global warming if we now invent time travel and go back to 2010 to peak our global emissions. And again, you have to stop all growth and go into decline to do that. And long term feedbacks the IPCC largely blows off were ongoing back then too.”www.facebook.com/wxclimonews/posts/455366638536345
Will there be 'change'?
“Today’s global consumption of fossil fuels now stands at roughly five times what it was in the 1950s, and one-and-half times that of the 1980s when the science of global warming had already been confirmed and accepted by governments with the implication that there was an urgent need to act. Tomes of scientific studies have been logged in the last several decades documenting the deteriorating biospheric health, yet nothing substantive has been done to curtail it. More CO2 has been emitted since the inception of the UN Climate Change Convention in 1992 than in all of human history. CO2 emissions are 55% higher today than in 1990. Despite 20 international conferences on fossil fuel use reduction and an international treaty that entered into force in 1994, manmade greenhouse gases have risen inexorably.”
- Tipping Points: Could the climate collapse?
ilfark2 at 00:10 AM on 22 October, 2019One should mention Richard Alley's work on abrupt climate change. Also note the above linked PNAS (from 2007 it looks like) mentions:
“the qualitative change would appear beyond this millennium (e.g.,marinemethanehydrates...”
but we're already possibly seeing more methane from the arctic as well as other parts of the ocean;
they also mention permafrost likely being gradual (though they say <100 yrs)
and of course it's easy to find many journal articles documenting how much faster various things are occurring than expected
it seems clear, they don't know and won't be scientifically certain until it's likely too late (if it's not already too late... which they don't seem sure of either)
point being, the idea of scientific methodical certainty is and has been misplaced in some senses... there were clarion calls in the nineteenth century by Darwin and other natural scientists, not about global warming per se, but that if we continued down the industrial (coal burning, forest clearing) path, we'd end the habitable world...
what was their proof that the world wasn't big enough to handle humans' collective assault? nothing that would pass a sort of vigorous lab experimental approach, rather "look at what has been left..."
critics of course said the earth would regerate after clear cutting and could handle the smoke from the coal (arrhenius pointed out the CO2 would warm the earth, but being a chemist, and not understanding ecology in any way, assumed more warmth would be good)...
so here we are again... no, we can't say when and how much methane will be released from the oceans... so far, in the warmer regions, various organisms intercept it, but a few places these have been overwhelmed... sure the yaley climate connection says don't worry about methane release since it would take the shallow arctic oceans warming by, i forget, 5 to 7 C for them to be released... yet we've seen unprecented warm pacific water incursion into the arctic this summer...
so how long do we have until the permafrost, marine methane and other feedbacks occur? it seems we don't know, and won't know for a while
so, we're driving 80 mph (sorry i'm amurican) in fog on a plain... someone radios there's a cliff ahead, though they aren't sure how far or how large the drop is
time for at least a WWII mobilization, better a reorganization of society along democratic lines (e.g., Free Catalonia of the 1930s).
- Tipping Points: Could the climate collapse?
Doug Bostrom at 07:43 AM on 18 October, 2019OK that's an arguably fair point, Mark.
Adam mentions permafrost loss and hence CH4 emissions, loss of albedo from reduced ice cover, and loss of forest productivity and the CO2 capture associated with that.
Those are three positive feedbacks which (we're told by experts) may plausibly end up being self-driving and self-cementing.
Now, it's not Adam's intention or style to inform readers by reciting facts and figures; those are available elsewhere. His intention and style is to build audience engagement, clearly with the objective of conveying a very broad-brush sense of the topics he's covering and presumably igniting some curiosity and concern about the overall problem of climate change.
But Adam might well include a list of references for the concepts he treats, as part of the content at the end of his pieces.
Why not write him and suggest that?
- CO2 effect is saturated
Bob Loblaw at 10:33 AM on 17 September, 2019PringlesX:
You ask, "Do you have some good sources that made you convinced about the large effect?"
I am reminded of a time, many years ago when we had some construction workers at a research site I worked at, who were quite intrigued by all the instrumentation and such. One asked "what did you do to get a job like this?" I answered, "I have a PhD in Physical Geography". I think that was more preparation and work than he had hoped for.
[My speciality was Climatology.]
There is no one source that "convinced" me. There is a huge body of science behind our understanding of climate, dating back to the 1800s. If you are curous about the history, I suggest reading "The Discovery of Global Warming".
I first started learning about climate as an undergrad in the 1970s, mostly via textbooks. In the 1980s, as a grad student, I was introduced to much of the primary literature (as it was at the time). As such, much of my understanding comes from the primary literature, not web pages or books. Here at SkS, I have on several occasions referenced the following paper:
Manabe and Wetherald (1967) Thermal Equilibrium of the Atmosphere With a Given Distribution of Relative Humidity
The link to the journal is here, and a free copy is also available here. The paper describes a one-dimensional climate model that includes exactly the kind of calculations I have been discussing with you. The fact that this is from 1967 should tell you that people have been working on this for a long time.
Of course, our understanding has improved since then. People often refer to the IPCC reports, which attempt to give a summary of current understanding. For a simpler version, I think the very first report in 1990 is easier to read than the later ones, because it covers the basics to a greater extent.
If you want to focus on IR radiation transfer only, then you can play with a model on-line at this web site. Note that radiation transfer is dependent on things like cloud, temperature, other gases, location, etc., so that web page gives you a lot of options to choose some typical defaults. You can choose an altitude, and direction (up or down). At the very least, playing with that model might help you realize that there is no one single source of information that will convince you (or anyone).
As the discussion continues, be careful with statements like "But still, sorry, i cant see the big difference in insulation effect with the information you are providing." That starts to look like an argument from increduility, which is a pretty weak position.
Scaddenp has already referred to CO2 doubling causing a reduction of 4W/m2 in outgoing IR radiation at the top of the atmosphere. Before you say "gee, that seems small", the climatological question is "what changes have to happen to bring the system back into equilibrium?"That answer was already provided by scaddenp, too: 1.1C temperature rise (global average) without feedbacks, or more like 3C with known feedbacks. You can see some of this in the Manabe and Wetherald paper I reference above. To put it simply, adding 4W/m2 to every part of the surface, for the length of time it takes to readjust, adds up to a lot of energy.
- CO2 effect is saturated
scaddenp at 19:55 PM on 16 September, 2019The straight radiative balance (ie doubling CO2 gives you an extra 4w/m2 of surface irradation) would only raise temperatures 1.1C. It is the feedbacks that lift this to around 3C, in part from increased water vapour as well as albedo and clouds.
- Hockey stick is broken
Daniel Bailey at 07:22 AM on 27 August, 2019TVC15, the current global mean temperature for the Earth "should be" one dictated by the sum balance of forcings and feedbacks that drive temperatures. As those are not in balance due to human activities, the global mean temperature is increasing as a result. Global mean temperatures will continue to increase as long as temperatures are not in balance with forcings, which they are not, as long as the burning of fossil fuels continues as they are currently used.
Scientists have evaluated all natural forcings and factors capable of driving the Earth's climate to change and it is only when the anthropogenic forcing is included that the observed warming can be explained.
Natural vs Anthropogenic Climate Forcings, per the NCA4, Volume 2:

Changes in the sun's output falling on the Earth from 1750-2011 are about 0.05 Watts/meter squared.
By comparison, human activities from 1750-2011 warm the Earth by about 2.83 Watts/meter squared (AR5, WG1, Chapter 8, section 8.3.2, p. 676).
What this means is that the warming driven by the GHGs coming from the human burning of fossil fuels since 1750 is over 50 times greater than the slight extra warming coming from the Sun itself over that same time interval.

- Residence Time and Prof Essenhigh
Eclectic at 00:19 AM on 26 August, 2019Daveburton ,
I appreciate your comedic comments about wires and feedbacks. Although they belong in an earlier lesson than Homeostasis 101.
Likewise, Dr Spencer's Simple Model provides farcical amusement, thanks to its disconnect with reality — why yes, its curve fits reality at least in part . . . just as the Aristotelian model of the planets is a moderately good fit to the observed motion of the planets across the night sky, at least in part!! But unlike our Spencer, our Aristotle had a decent excuse for his blunders.
Daveburton, when I mentioned sitting back and observing "another 40 years or so" , I was of course not alluding to the future experience of someone as unimportant as me (or possibly you). Or perhaps you were just pulling my leg about "that", too.
No . . . I was alluding to something far more important: namely the human race. And here we get to the crunch, Daveburton, the really important point about Spencer's far-too-simple-to-be-scientifically-useful model.
# What do you think was the actual underlying reason for Dr Spencer to publicize his strange little "Simple Model".
( Not for comedy, I suspect. Nor for the edification of genuine climate scientists.)
- Residence Time and Prof Essenhigh
daveburton at 21:52 PM on 25 August, 2019Eclectic wrote, "your heated-wire analogy is even wider of the mark..."
It is just a simple example illustrating a general principle. It's how negative feedback systems work. If the removal rate increases with system output level, that's a negative feedback mechanism. A constant forcing input will then result in a plateau at "equilibrium," where the negative feedback has caught up with the constant input.
That's true when the input forcing is energy added to your toaster via electricity, and the negative feedback mechanism is radiative & convective heat loss from a nichrome wire.
It's also true when the input forcing is CO2 added to the atmosphere, and the negative feedback is CO2 removal from the atmosphere via dissolution in the oceans and terrestrial plant uptake.
The principle is true regardless of whether the negative feedback is linear or nonlinear. For the nichrome wire example, there are actually three significant negative feedbacks, all with different transfer functions: radiative heat loss goes up in proportion to the 4th power of the temperature relative to 0K, convective heat loss goes up in approximate proportion to the temperature difference between the wire and ambient air, and the resistance of the wire also goes up with temperature. The fact that all three have different-shaped transfer functions doesn't affect the conclusion: because they are negative feedbacks, a constant input (forcing) must result in a plateuing output, gradually approaching equilibrium.
Eclectic continued, "The design of the Simple Model fits at best tangentially with physical reality."
It fits extremely well for the period for which we have accurate measurements:
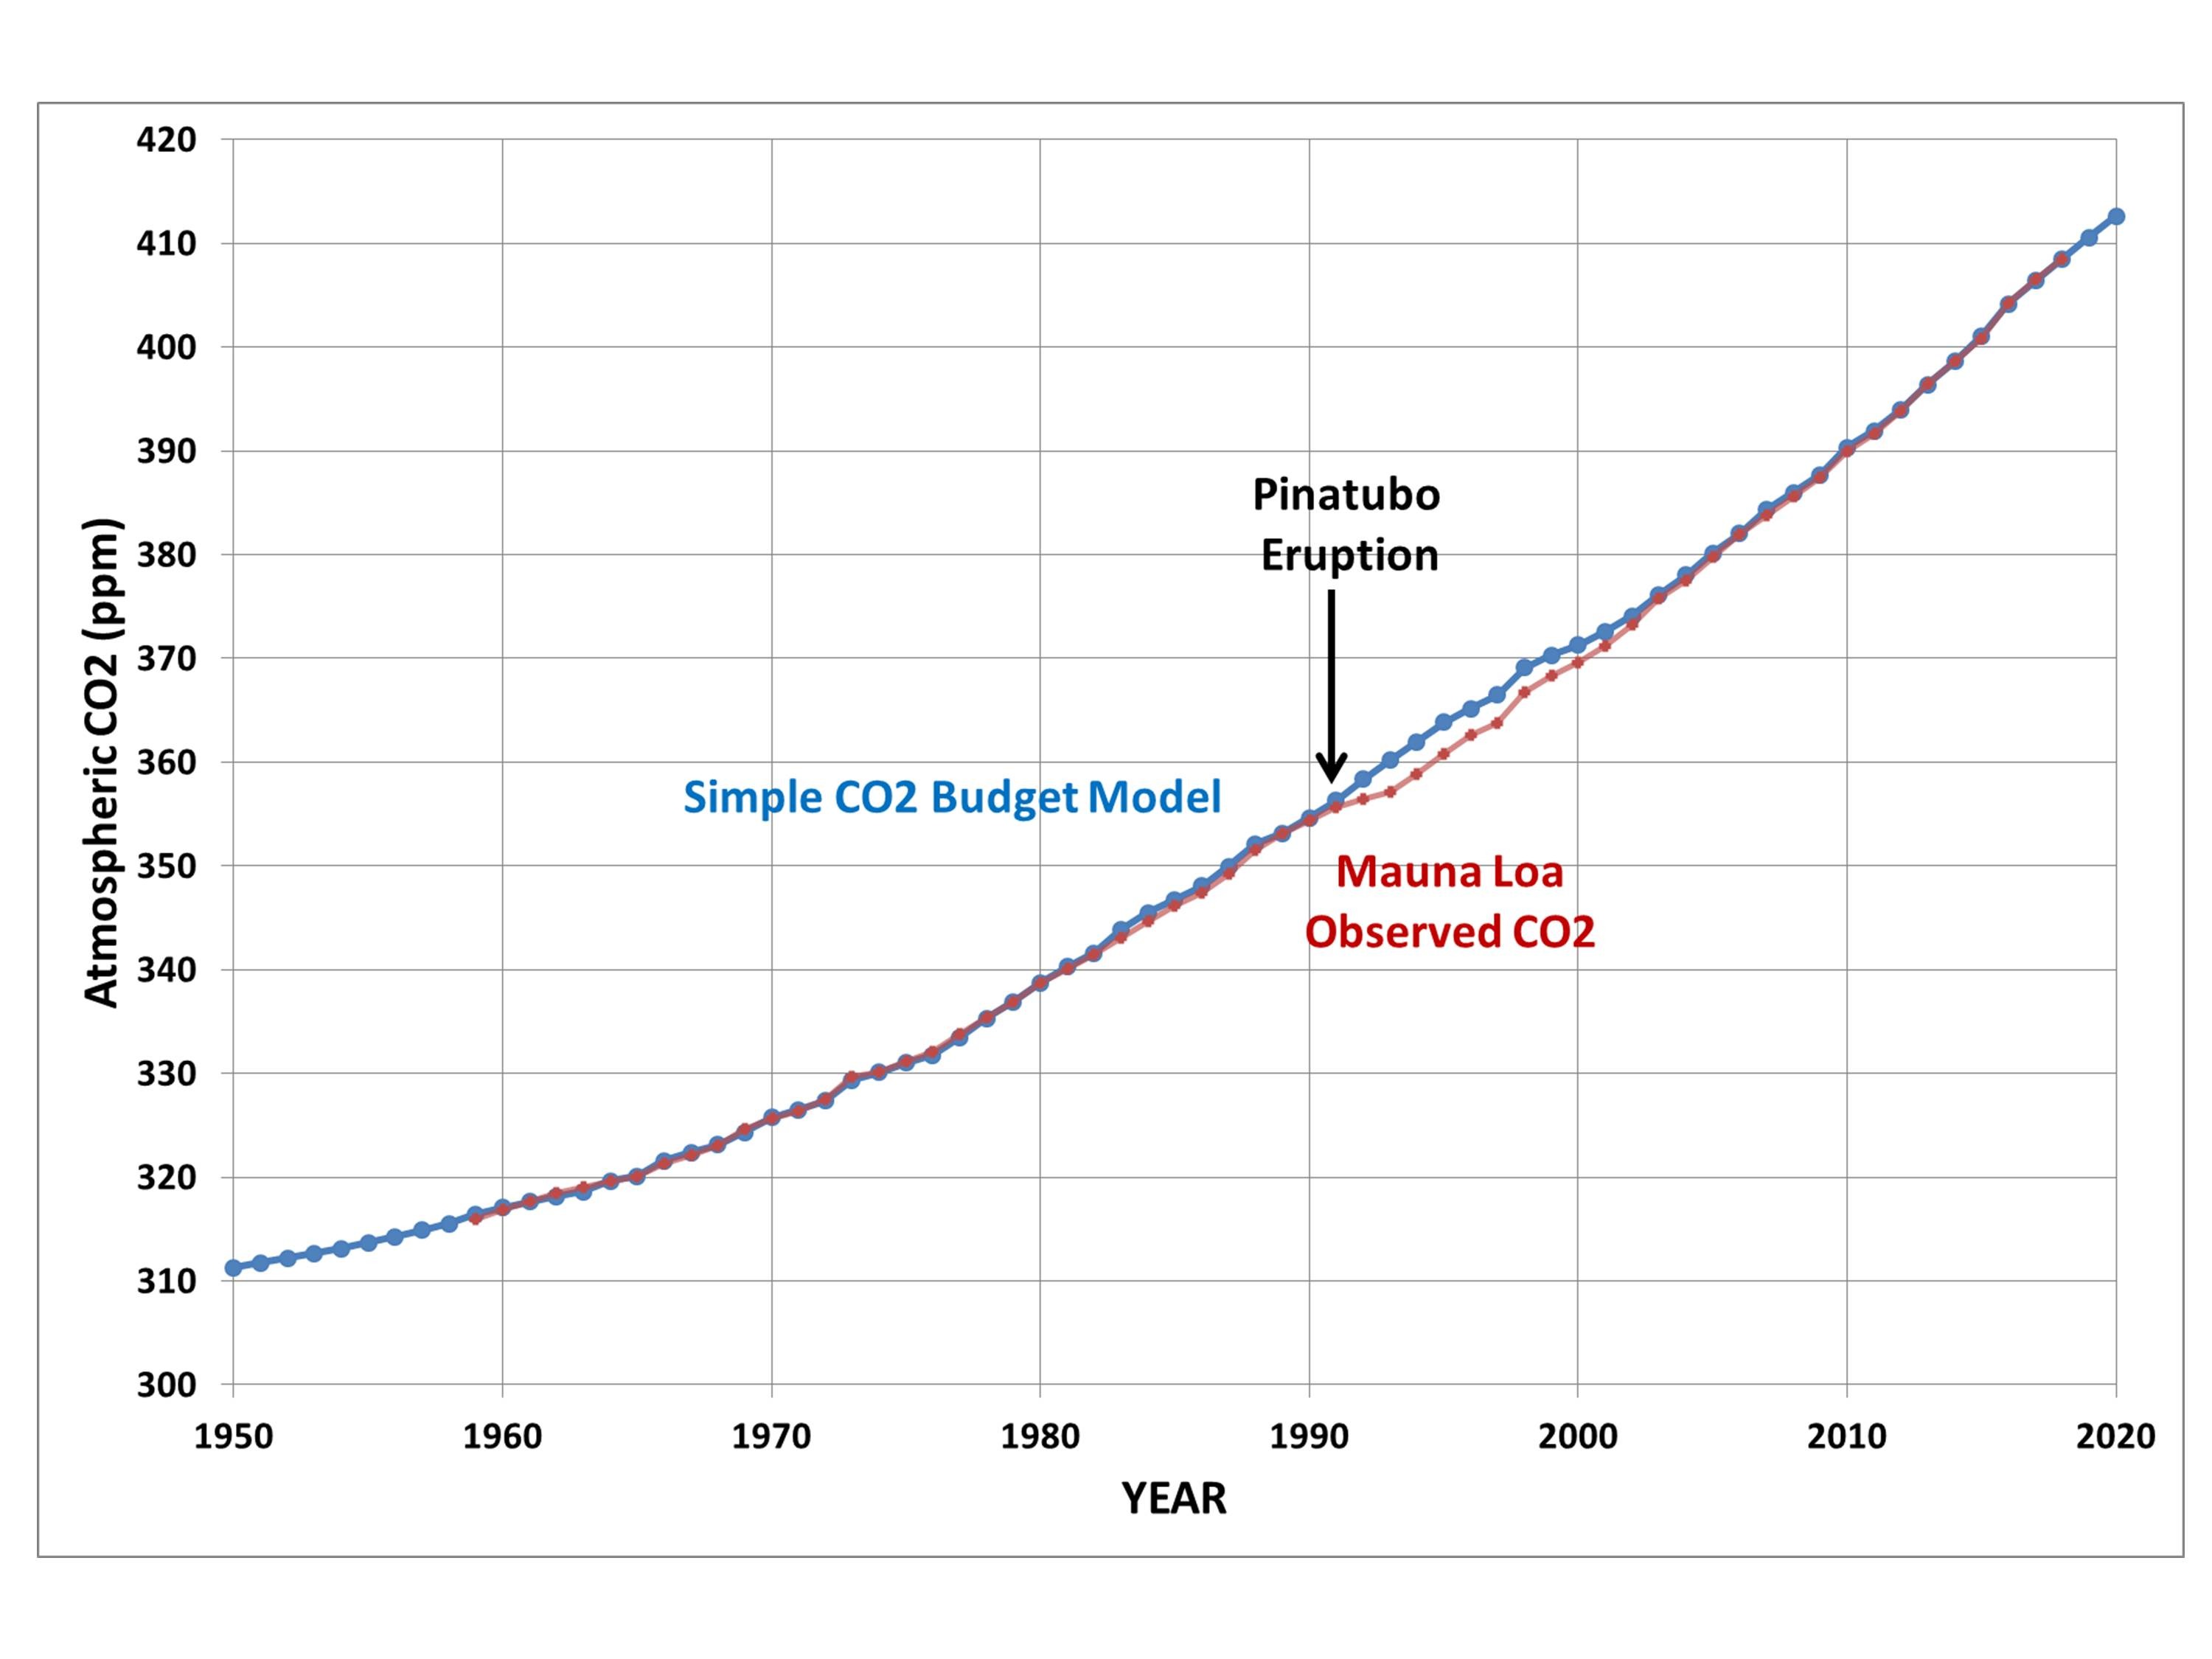
Eclectic continued, "nor do we have the luxury of time to sit back and observe another 40 years or so, as the Simple Model diverges from the (complex) real world."
Well, I obviously don't, at my age.
But mankind does have that luxury, and you should not expect Roy's Simple Model to diverge much from reality over the next 40 years. It is the "long, fat tail" (due to increased carbon levels in non-atmospheric reservoirs) which is not modeled by the Simple Model. Regardless of what happens with CO2 emission rates, CO2 removal over the next 40 years will be dominated by the removal mechanisms which the Simple Model models well.Eclectic continued, "the paleo evidence demonstrates the falsity of Spencer's too-simple Simple Model."
All models are false, but some are useful. Roy's Simple Model is very useful. It is a very good fit to measured reality, and it will continue to be a good fit as long as the CO2 removal mechanisms which are currently most important continue to be most important. When CO2 levels drop below 300 ppmv, and the accumulation of anthropogenic carbon in non-atmospheric reservoirs becomes an important factor affecting atmospheric CO2 levels, then his Simple Model will diverge from reality.
MA Roger wrote, "Yes, the oceans are big. Yes, the oceans contain contain sixty-times the carbon found in the pre-industrian atmosphere (which was in full equilibrium with the oceans). But what has that got to do with your "fact"?"
Mankind has increased CO2 level in the atmosphere by about 47%. We've increased carbon content in the oceans by only about 0.4%.
So, why does that matter? Because it is that accumulation of carbon in non-atmospheric reservoirs that is not modeled by Roy's Simple Model. In other words, his Simple Model assumes the other carbon reservoirs have infinite capacity.
That's a pretty good simplifying assumption, as long as the anthropogenic increase in atmospheric CO2 dwarfs the anthropogenic increase in carbon in other reservoirs. It will diverge from approximating reality during the "long, fat tail," when the anthropogenic increment in atmospheric carbon dioxide no longer dwarfs the anthropogenic increase in carbon in other reservoirs.
MA Roger wrote, "it is very odd that they would ever allow atmospheric levels to remain constant while the ocean absorbed a large constant flux of dissolving CO2."
Atmospheric levels will remain constant when transfer of carbon to the oceans and other carbon reservoirs removes CO2 from tha air as quickly as anthropogenic emissions are adding it. (They're currently removing it only about half as fast as we're adding it.)
MA Roger asked, "Have you actually examined the workings of Spencer's model?"
Of course.
MA Roger wrote, "If you set the future anthropogenic emissions to a fixed value... atmospheric CO2 levels tend to a constant value"
Which is, of course, correct.
MA Roger wrote, "while negative emissions, suck out 15Gt(C)/yr and by AD2191 the atmosphere is entirely denuded of CO2. daveburton, doesn't that strike you as "very odd"?"
Not at all. If you start with a physically impossible assumption, you get a physically impossible result. The only thing I can think of which could possibly remove a net 15 GtC/year from the atmosphere when CO2 levels are below 300 ppmv, is some idiot genetically engineering a fast-growing, fast-propagating C4 tree.
Please don't do that! The Earth doesn't need another K-T Extinction!
More than 100 comments found. Only the most recent 100 have been displayed.
More than 100 comments found. Only the most recent 100 have been displayed.


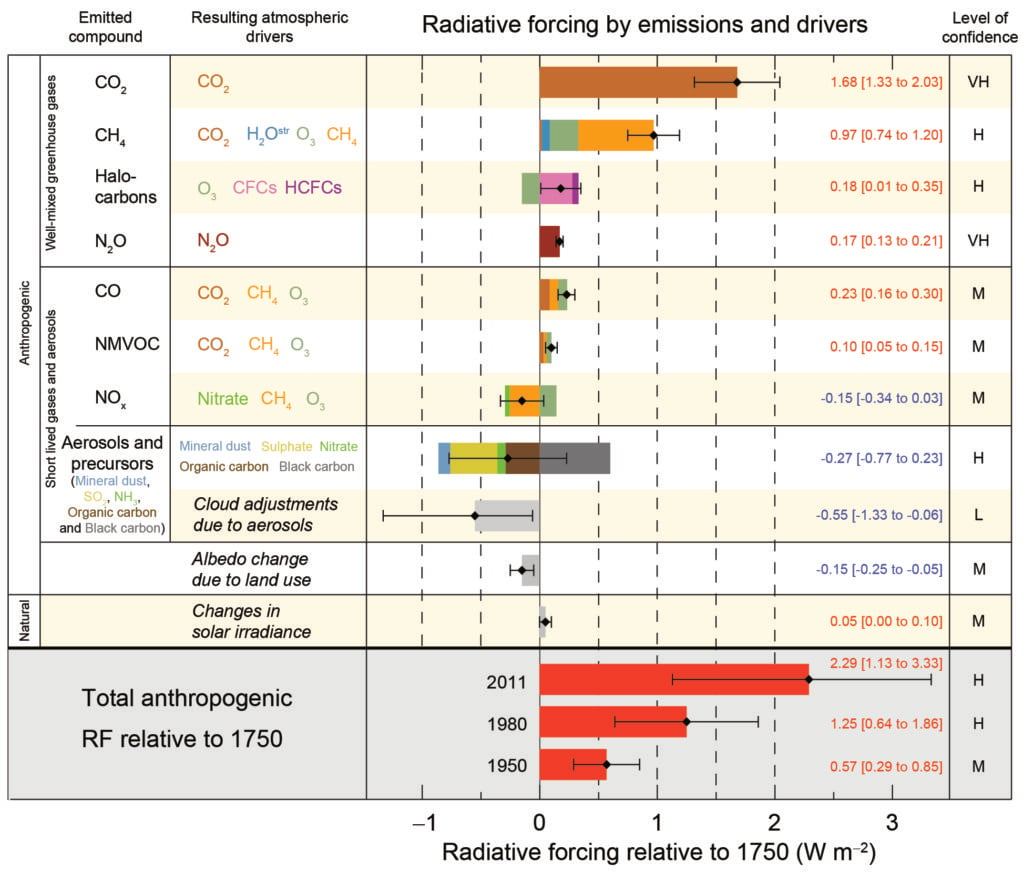
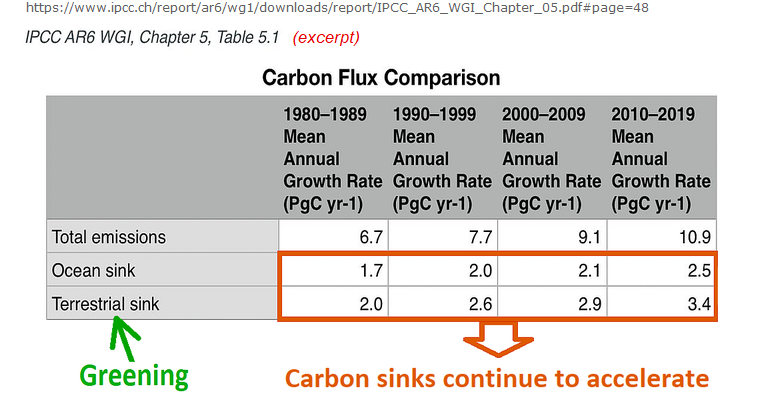
THE ESCALATOR

(free to republish)