Climate Science Glossary

Term Lookup

Enter a term in the search box to find its definition.

Settings

Use the controls in the far right panel to increase or decrease the number of terms automatically displayed (or to completely turn that feature off).

Term Lookup

Settings


All IPCC definitions taken from Climate Change 2007: The Physical Science Basis. Working Group I Contribution to the Fourth Assessment Report of the Intergovernmental Panel on Climate Change, Annex I, Glossary, pp. 941-954. Cambridge University Press.

Home Arguments Software Resources Comments The Consensus Project Translations About Support

Twitter Facebook YouTube Mastodon MeWe

RSS Posts RSS Comments Email Subscribe


Climate's changed before
It's the sun
It's not bad
There is no consensus
It's cooling
Models are unreliable
Temp record is unreliable
Animals and plants can adapt
It hasn't warmed since 1998
Antarctica is gaining ice
View All Arguments...


Username
Password
New? Register here
Forgot your password?

Latest Posts

Archives

Shakun et al. Clarify the CO2-Temperature Lag

Posted on 10 April 2012 by dana1981

A popular myth amongst climate 'skeptics' is that historically atmospheric CO2 levels have risen after temperature increases began, and therefore it's actually temperature increases that cause CO2 increases, and not vice-versa as basic climate science and physics would have us believe.  To this point, the standard response to this myth has been that initial temperature increases have historically been caused by the Earth's orbital (Milankovitch) cycles, which in turn warm the oceans, causing them to release CO2, which in turn amplify the global warming.  Thus while the initial warming hasn't historically been caused by CO2, CO2 has amplified the warming for thousands of subsequent years, and thus is still the principal control knob governing Earth's temperature.

An intriguing new paper by Shakun et al. (2012) takes a more in-depth look at this particular myth.  Many headlines have declared that Shakun et al. have demonstrated that CO2 has historically led (rather than lagged) global warming - the reality is a little more nuanced than that, but that is the basic take-home message.  In Figure 1, the red line (Antarctic temperature) and yellow dots (atmospheric CO2) illustrate our previous unerstanding, while the blue line (global temperature) is the nuance added by Shakun et al.

Shakun Fig 2a 

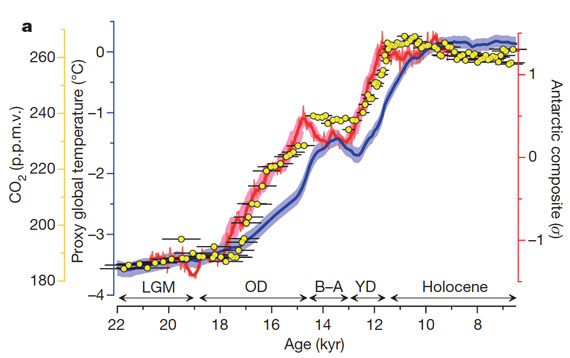
Figure 1: The global proxy temperature stack (blue) as deviations from the early Holocene (11.5–6.5 kyr ago) mean, an Antarctic ice-core composite temperature record (red), and atmospheric CO2 concentration (yellow dots). The Holocene, Younger Dryas (YD), Bølling–Allerød (B–A), Oldest Dryas (OD) and Last Glacial Maximum (LGM) intervals are indicated. Error bars, 1-sigma; p.p.m.v. = parts per million by volume.  Shakun et al. Figure 2a.

What did Shakun et al. Do?

The key to this myth is that it's based on Antarctic ice core records, which are not necessarily an accurate representation of global temperatures.  In recent years there have been many studies collecting data from ice cores in Greenland, sediments drilled from the ocean floor and from continental lakes, and so forth.  Most of these proxies don't extend as far back in time as the Antarctic ice cores, but many do extend back to the last glacial-interglacial transition which began approximately 18,000 years ago, as Figure 1 shows.

Shakun et al. examined 80 such proxy records from around the globe (Figure 2), recording sea surface temperatures for the marine records and surface air temperatures.

Shakun Fig 1


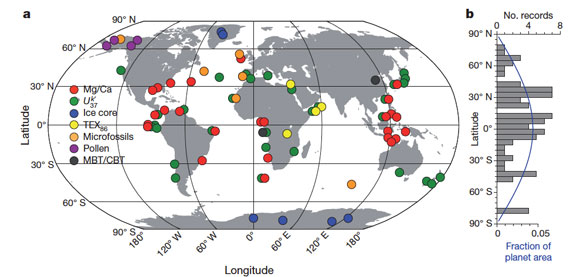
Figure 2: Proxy temperature records. a) Location map. CBT = cyclization ratio of branched tetraethers; MBT = methylation index of branched tetraethers; TEX86 = tetraether index of tetraethers consisting of 86 carbon atoms; Uk37 = 37, alkenone unsaturation index. b) Distribution of the records by latitude (grey histogram) and areal fraction of the planet in 5° steps (blue line).  Shakun et al. Figure 1.

By comparing the atmospheric CO2 increase (note that since CO2 is well-mixed in the atmosphere, a single ice core record can be used as an accurate representation for CO2 - Shakun et al. used the Antarctic EPICA Dome C ice core for CO2 data) to these many different temperature records, Shakun et al. are able to discern whether the CO2 increase led or lagged temperature changes in various different geographic locations, and for the planet as a whole.

Does CO2 Lag or Lead?

This is where it really gets interesting, because the answer is yes - CO2 lags and leads.  In the Southern Hemisphere, Shakun et al. found that the temperature rise happened first, whereas in the Northern Hemisphere, the CO2 increase was first (Figures 3 and 4).

Shakun Fig 2b 

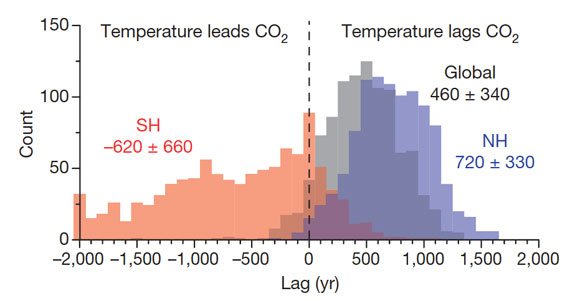
Figure 3:  The phasing of CO2 concentration and temperature for the global (grey), Northern Hemisphere (NH; blue) and Southern Hemisphere (SH; red) proxy stacks based on lag correlations from 20–10 kyr ago in 1,000 Monte Carlo simulations. The mean and 1-sigma of the histograms are given. CO2 concentration leads the global temperature stack in 90% of the simulations and lags it in 6%.  Shakun et al. Figure 2b.

Shakun Fig 5b

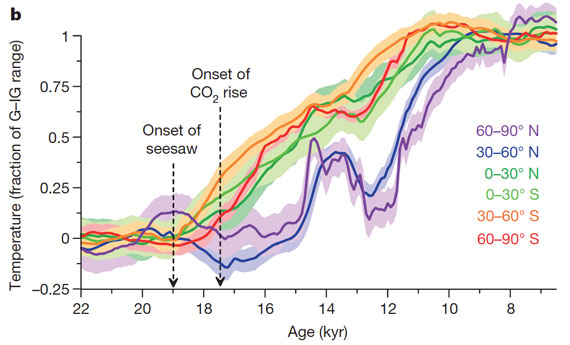
Figure 4:  Proxy temperature stacks for 30° latitude bands with 1-sigma uncertainties. The stacks have been normalized by the glacial–interglacial (G–IG) range in each time series to facilitate comparison.  Shakun et al. Figure 5b.

What's Going On?

What appears to have happened, based on global climate model simulations run by Shakun et al., is not all that different from our previous explanation of the supposed CO2 lag - just a bit more nuanced. 

  • As we already knew, the Earth's orbital cycles trigger the initial warming (starting approximately 19,000 years ago), which is first reflected at the highest latitudes (i.e. Greenland and the Arctic - see "Onset of seesaw" in Figure 4). 
  • This Arctic warming melted large quantities of ice, causing fresh water to flood into the oceans.
  • This influx of fresh water then disrupted the Atlantic meridional overturning circulation (AMOC), in turn causing a seesawing of heat between the hemispheres.  The Southern Hemisphere and its oceans warmed first, starting about 18,000 years ago.
  • The warming Southern Ocean then released CO2 into the atmosphere starting around 17,500 years ago, which in turn caused the entire planet to warm via the increased greenhouse effect.

In short, the initial warming was indeed triggered by the Milankovitch cycles, and that small amount of orbital cycle-caused warming eventually triggered the CO2 release, which caused most of the glacial-interglacial warming.  So while CO2 did lag behind a small initial temperature change (which mostly occurred in the Southern Hemisphere), it led and was the primary driver behind most of the glacial-interglacial warming.

According to the Shakun et al. data, approximately 7% of the overall glacial-interglacial global temperature increase occurred before the CO2 rise, whereas 93% of the global warming followed the CO2 increase.

What Does Shakun Say About Climate Sensitivity?

Shakun et al. did not address the question of climate sensitivity in their paper.  Readers may recall a paper by Schmittner et al. which used the glacial-interglacial transition to estimate climate sensitivity, and came up with an estimate (1.7–2.6°C with a best estimate of 2.3°C global surface warming in response to doubled CO2) towards the lower end of the IPCC range (2.0–4.5°C with a best estimate of 3°C).  However, this lower estimate could mostly be attributed to Schmittner et al.'s low estimate of the glacial-interglacial temperature change, of just 2.6°C globally (most previous estimates put the value at around 5°C).

Shakun et al. estimate the global surface temperature change at approximately 4°C during the transition.  A similar paper by many of the same authors recently published in the Proceedings of the National Academy of Science (Clark et al. 2012) estimates the greenhouse gas radiative forcing during the transition at approximately 2.5 Watts per square meter (W/m2), but neither Shakun nor Clark et al. estimated the total radiative forcing (including surface reflectivity changes, for example).  Overall, the estimated temperature changes and radiative forcings are both slightly lower than in Hansen and Sato (2011) (Figure 5).

Fig 2

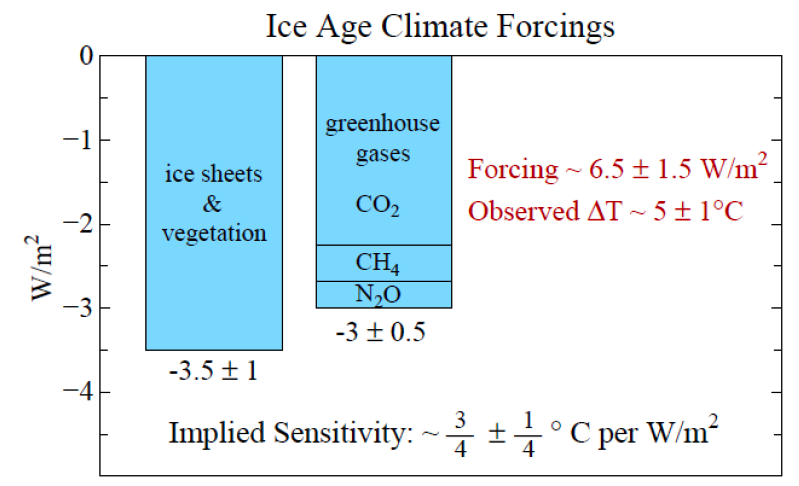
Figure 5: Climate forcings during the ice age 20,000 years ago relative to the pre-industrial Holocene from Hansen and Sato (2011)

Similar to the implied sensitivity in Hansen and Sato, a ~4°C global temperature change caused by a ~6 W/m2 forcing corresponds to a ~2.5°C sensitivity to doubled CO2.  Note that this is a very rough estimate based on the Shakun and Clark results, but is within the IPCC climate sensitivity range.

Predictable Denial Reactions

Not surprisingly, since the 'CO2 lags temperature' myth is a climate denialist favorite (coming in at #12 on the most-used climate myths list), the reaction has predictably been one of, well, denial.  WattsUpWithThat in particular has devoted several posts denying the results in the Shakun et al. paper.  One such post quoting Don Easterbrook (of failed global cooling prediction fame) began with the following objection:

"1. They assume that CO2 is capable of causing climate changes..."

Need we continue?  We could devote an entire post to the glaring errors from Easterbrook in this WUWT post, but let's not. 

In the same post, Willis Eschenbach criticized the paper saying "My rule of thumb about these kinds of things is, no error bars … no science."  However, Shakun et al. were quite explicit about the associated uncertainties throughout the paper (for example, see the uncertainty ranges depicted in Figures 1 and 4 above).  Upon actually reading the paper, Eschenbach's criticism rings quite hollow.

Speaking of apparently not reading the paper before attacking it, a second WUWT post on Shakun et al. (also from Eschenbach) argued that their results are not valid because the glacial-interglacial warming occurred at different times in the different temperature proxies.  But that is of course the point - the Southern Hemisphere warmed before the CO2 increase, while the Northern Hemisphere warmed after (as Figures 3 and 4 show).  In looking for an excuse to reject this research, the denialists manage to miss the entire point of the paper.

In yet a third post, this one by Watts himself, Watts objects that Shakun et al. refuse to call orbital cycles the warming "trigger."  This is a little bit silly, since the authors titled an entire section of their paper The trigger for deglacial warming, discussing that the first warming (of the Arctic 19,000 years ago) was indeed triggered by orbital cycles.

An Intriguing Result

The knee-jerk denial rejections of the Shakun et al. results reflect the inconvenience of their results for the climate "skeptics."  The authors summarize their intriguing results, which expand upon our understanding of glacial-interglacial transitions.

"Lag correlations from 20–10 kyr ago suggest that the modelled global temperature lags CO2 concentration by 120 yr, which is within the uncertainty range of the proxy-based lag."

{...}

"Our global temperature stack and transient modelling point to CO2 as a key mechanism of global warming during the last deglaciation. Furthermore, our results support an interhemispheric seesawing of heat related to AMOC variability and suggest that these internal heat redistributions explain the lead of Antarctic temperature over CO2 while global temperature was in phase with or slightly lagged CO2."

Also see good coverage of this study by Climate Crocks, The Washington Post, and BBC.

Note: the Shakun et al. results have been incorporated into the CO2 lags temperature myth rebuttals.

0 0

Printable Version  |  Link to this page

Comments

1  2  3  4  Next

Comments 1 to 50 out of 157:

  1. good summary...can anyone add detail to how the see-saw works? All I've been able to find is somewhat vague descriptions that heat accumulates in the tropics when the AMOC shuts off, this heat then somehow gets transferred to the southern ocean....how? what turns on the S. Atlantic circulation system that re-distributes the heat southward out of the tropics?
    0 0
  2. Excellent summary of the Shakun et. al. paper and the predictable skeptic response by Easterbrook et. al. In terms of sensitivity, I personally think the 3C estimate is pretty solid, as the rate of CO2 growth, not just the actual raw number must be considered. The response of the climate to a doubling of CO2 that takes 10,000 years versus 350 years is a different dynamic. Specifically, natural negative feedback pathways become overwhelmed when the doubling occurs in the shorter time frame. Not only can short-term feedbacks be overwhelmed, long-term biosphere feebacks might as well. Additionally, in the case of the current Anthropocene, it is not just CO2 that is increasing from human activity, but N2O and methane as well. Thus, even if the sensitivity of the climate to a doubling of CO2 from 280 ppm to 560 ppm that took 10,000 years is around 2.5C, it may not be the case that this is the same sensitivity for a doubling that takes 350 years. What might happen, for example, is a classic overshoot situation where, even if we manage to keep CO2 at 560 ppm, because of the rapid rise of CO2, and the overwhelming of the feedback processes. the system overshoots what would have been an equilibrium temperature of 2.5C, and spikes higher. In spiking higher, some new biosphere, hydrosphere, or cryosphere threshold is crossed, that mananges to send the system to a higher equilibirum temperature because the character of the system has been changed by the rapidity of the CO2 spike.
    0 0
  3. Good article, but some typos: "feebacks", "mananges", "equilibirum", "unerstanding" and "depocted" (Delete after fixing if you want)
    0 0
  4. Can anyone clarify the reasons for the levelling off of both CO2 and temperature at the end of the transition? Thanks.
    0 0
  5. @question #4 Here's the simple explanation. The ultimate driver of temperatures on our planet is energy from the sun, which is affected by the variations in the shape and offset of the Earth's orbit and wobbles of our axis. Changes in these, immediately preceding the end of the ice ages, triggered the rise in temperature which led to a release in CO2 and the warming that took place (as described in the post). So to answer the question: Earth's energy balance always seeks equilibrium which, once the variations in orbit and wobble had then stabilised (or more correctly 'neutralised' each other), our planet eventually achieved. Further warming then stopped and we settled down to a new, warmer, state which -- this time round -- happened to coincide with a level of human development conducive to the beginnings of civilisation. As I started by saying this is a very simplistic explanation. I'm sure the scientists here will be happy to provide more detail (or, for that matter, correct me if I've oversimplified anything).
    0 0
  6. "According to the Shakun et al. data, approximately 7% of the overall glacial-interglacial global temperature increase occurred before the CO2 rise, whereas 93% of the global warming followed the CO2 increase." How exactly is this derived, given that neither the temperature increase nor the CO2 increase was a singular event? In previous examinations of this question an important point has been that the (then supposed) initial increase in temperatures caused an increase in CO2 levels... which caused a further increase in temperatures... more CO2... et cetera. The changes were going on concurrently, with only the initial triggers being offset. That argument made sense and still does... but then how do you compute '93% after' from two concurrent processes? My best guess is that they are looking at the time period between the start of the orbital forcing and the start of the CO2 increases and finding that it accounted for 7% of the total temperature rise. However, that might then create a perception that the 93% 'after the CO2 increase' was entirely due to the CO2, when in reality the continued orbital forcing was also likely involved. That said, a lot of the reporting on this has described it as a change from 'CO2 lagged temperature' to 'temperature lagged CO2'. However, the actual study still finds that the warming from the orbital forcing came first... so the increase in atmospheric CO2 levels still started after the increase in temperatures. That temperature increase was just concentrated first in the Northern hemisphere (as expected due to the forcing) and then in the Southern (the real 'new' finding of the study) apparently due to AMOC. Using the 'accelerated' Southern hemisphere temperature as a global value made the CO2 lag look longer than it was, but even with the 'global' values used by this paper they found 7% of the warming prior to the CO2 increase. The 'skeptics' who aren't thus appear to be freaking out over how the paper has been reported without stopping (or possibly being able) to understand what it actually says.
    0 0
  7. @CBD #6 In my head (which I hasten to clarify is not that of a scientist) I imagine that the shift in orbital variation between the point where the trajectories are all acting together to push us to the greatest extremity from the sun and the point when the variations tend to cancel one another out, is a gradual process taking many thousands of years. Consequently the increase in energy arriving from the sun which triggers the warming then kicks off the CO2 rise. After that it's a process of the main drivers -- increasing amounts of energy arriving from sun and increasing atmospheric CO2 levels -- each contributing to the rise in the planet's temperature. And at the same time, of course, the rising retained energy inputs also push along rising atmospheric CO2 concentrations. Then only when the energy input from the sun stops rising can the carbon cycle achieve a new, globally warmer, equilibrium. So it's a complex interaction (and I'm sure there are several other contributors) which cannot really be separated out, I would think (or can they?). I don't know whether this perception is right but it's always the way I've imagined it in my, very visual, rather unscientific, imagination. Am I correct? One other question. With regards to the apparent difference between lag in the Antarctic and globally; could this be due to the Earth's axis wobble?
    0 0
  8. R Gates #2 Could you provide some references for these points. I think what you write needs clarification.
    0 0
  9. John Russell @7 To be precise (that is you make the point but using rather woolly terminology at times), it is the Earth's wobbly orbit (Milankovitch cycles) that is the "trigger." The sun shines normally but the orbit provides increasing sunshine in Northern latitudes (& less in the South). The sun is thus not a "main driver." Indeed, the concept "driver" may be unhelpful here. The orbit "triggers" a shift of heating from South to North. This destablises the global climate with the relative influence of the agents causing that destabilising change (be they "feedbacks" or "drivers?") presented above in fig 5 of this post. This graph shows in order of importance - CO2 behind (presumably reduced albedo from) ice fields & vegitation. To consider them as "actual drivers" only makes sense if you want to calculate Climate Sensitivity resulting from other "actual drivers" (eg anthopogenic ones) & (I assume) within the constraint that the process addressed (eg AGW) will not result in significant "feedbacks" from the "drivers?" that are used in the calculation. (This last point likely does not hold if Climate Sensitivity is high or if Anthopogenic Forcing is high.)
    0 0
  10. @ #4: Silicate weathering. Increased CO2 and temperature cause (among many other things) 1) a decrease of ice cover, exposing fresh rock that was once covered, and 2) enhanced production of carbonic acid (acid rain) in the atmosphere (higher partial pressure of CO2 and warmer temperatures to help drive the reaction H2O + CO2 --> H2CO3 (l). The net result of acid rain falling on fresh rock with small grain sizes is enhanced silicate weathering and net reduction of CO2(atm). This cycle is one of the stronger negative feedbacks that drives the system back toward equilibrium, but it works on a much slower time scale than the initial dumping of CO2, so it takes a while to kick in...
    0 0
  11. CBD @6 - what I mean is that ~7% of the net warming occurs between the orbital 'trigger' and the CO2 rise. The remaining ~93% of the warming lags behind the CO2 rise (as illustrated in Figure 1).
    0 0
  12. http://www.pnas.org/content/105/44/16855.full.pdf+html?with-ds=yes is a good reference for talking about the weathering aspect... Basically, weathering of glacially derived sediments (in moraines) takes ~12 to 25 kyears to run to completion... so weathering and CO2 stripping lags well behind CO2 and T increases... but it does catch up in the end ... as long as no extra CO2 is released. Ooops.
    0 0
  13. @MA Rodger #9 Apologies for my 'woolliness' -- the result of trying to use simple language! Yes, I was meaning that the sun's output remains constant but, as a result of the orbital cycles, the distance between the sun and Earth (and thus the energy arriving) varies. However there seems to be more to these orbital cycles than you mention. As I understand it our position relative to the sun varies in at least three ways. 1) The shape of the ellipse varies -- sometimes being closer to circular and sometimes being flattened. 2) The position of the sun within the ellipse varies (or more accurately it's the position of the Earth's orbit that's varying), sometimes being nearer the centre and sometimes slightly off to one side. And 3) the Earth wobbles on its axis as you describe, favouring one pole or the other in terms of arriving warmth. I'll stand corrected but I don't think this last variation, 3), is going to be a trigger for a global heat rise, as it's just redistributing the sun's energy from one one half of the globe to the other. So the main cause of an ice age is both 1) and 2) conspiring against us. Is this correct? Sorry if this is a bit simple for some, and perhaps veering a little off-topic. But certainly for me, and probably many other non-scientists, it's useful for basic understanding.
    0 0
  14. @John Russell: The tilt and the change of tilt with time actually has a huge impact in several ways. 1) with the rotation axis tilted strongly toward the sun (High Tilt Angle = HTA) the polar regions receive a lot more sunlight in summer, and that sunlight in summer is more direct (more watts/m2). The result of HTA is extreme temp. differences between short hot polar summer and long cold polar winter. The result is ... no ice age - the hotter summer makes more of a difference than a winter that is just a bit cooler. 2) With the rotation axis weakly tilted toward the sun (Low Tilt Angle = LTA) the summers are cooler and the winters relatively warmer, however the short, cool polar summer encourages retention of winter ice and snow, and season upon season, the snowpack grows, compresses and forms glacier ice... LTA appears to correspond well with glacier/ice cap growth. 3) Couple Tilt changes from HTA to LTA with longer and shorter term periodicities in the orbital shape (eccentricity) and precession of the seasons (where in the eccentric orbit the tilted earth faces the sun) and you can map out high-latitude insolation reasonably well. 4) Couple that with the position of continents (Low heat capacity rock at high latitude vs high heat capacity water... as well as a stable platform needed to grow ice caps in the first place) and you start to see strong correspondences between orbital forcing and ice growth or shrinkage. So it is NOT that there is a global heat increase triggered by orbital mechanics!! Given the minor and short term cycling of solar output, the fact is that over long time scales, the total global heat budget is approximately constant. It is that the distribution of heat - the timing of when certain areas get hot, and how hot they get - changes. High tilt = Cooler polar summers coupled with warmer polar winters = ice growth (assuming there are continents around to support glaciers). Low tilt = Warmer polar summers and cooler polar winters = ice shrinkage. Juice that system a bit with eccentricity and precession to magnify or dampen the tilt signal... Now, here's the funny thing: currently the earth is head from a high-ish tilt scenario into a lower-tilt scenario... and the polar summers are getting warmer. Either the theory is wrong... or something else is happening! What else could be happening? Well, perhaps the total heat budget being relative stable is no longer operative!!! Adding more heat-retentive materials to the atmosphere, losing heat reflective materials from the polar regions = keep more heat. The heat budget is now in a state of IMBALANCE. Homeostasis (invoked by Lindzen and Monckton) has been disrupted. The current trend of observed year on year and decade on decade temperature and heat changes in particular regions runs counter to what the geological record and orbital mechanics tell us should be happening.
    0 0
  15. @danielc #14 Thanks very much for the very clear explanation. I got it. Apologies if I took it back to basic levels! I really don't understand why so many 'sceptics' claim they've been 'abused' when asking questions on SkS. Ask a straightforward question and you get a straightforward answer. Thanks.
    0 0
  16. @9 and @13 I wrote the following before seeing the post @14 by danielc, but I will post it anyway. Three features of Earth’s orbit change in regular patterns: 1) The shape of the ellipse (more elliptical vs. more circular) varies on a 100,000 year cycle, 2) The tilt of Earth’s axis varies on a 41,000 year time scale (the greater the tilt the more sunshine reaches polar regions to melt ice sheets), and 3) Earth’s axis wobbles on time scales of 19,000 and 23,000 years. All three cycles combine to regulate the amount of sunshine reaching high latitude regions in summer, the primary variable regulating the growth and melting of ice sheets according to the Milankovitch hypothesis. Of particular importance is the combination of (1) and (3), whereby maximum melting of northern hemisphere ice sheets occurs when the phase of the wobble causes the northern hemisphere summer to coincide with Earth’s closest approach to the sun during a particularly elliptical orbit. As far as I know, each of the last several ice age termination occurred under these conditions.
    0 0
  17. @John, being skeptical is not a problem... it's a requirement to do good science. It's when one hides one's complete unwillingness to admit the reality of solid facts, data, and basic math and physics behind a rhetorical mask of supposed skepticism that problems begin to arise and civility begins to decay. Honest questions deserve honest answers. False skepticism that masks accusations of fraud, dishonesty, lies, and alarmism for political advantage (e.g. Lindzen, Monckton, and the rest) deserves nothing but contempt.
    0 0
  18. ... In the same post, Willis Eschenbach criticized the paper saying "My rule of thumb about these kinds of things is, no error bars … no science." ... Not only do such comments ring hollow on reading the paper but a look at the supplementary material shows page after page after page (37 pages) of reasoned discussion, analysis and quantification of the uncertainties in the paper. For those who want a look the supplementary pdf is not behind a paywall. It's hard work reading through it and you may not come away much the wiser but I think you certainly come away with a clear idea of the care climate scientists put into their work.
    0 0
  19. #18 Nature link supplementary pdf
    0 0
  20. danielc, I'm a bit confused. Near the top of your post you said "(High Tilt Angle = HTA) the polar regions receive a lot more sunlight in summer" and "(Low Tilt Angle = LTA) the summers are cooler" but further down you seem to have it the other way round:
    "High tilt = Cooler polar summers coupled with warmer polar winters = ice growth (assuming there are continents around to support glaciers). Low tilt = Warmer polar summers and cooler polar winters = ice shrinkage."
    Lack of understanding on my part, or mistake in your post?
    0 0
  21. @danielc As someone who spends a considerable amount of time fighting fake scepticism/denial -- call it what you will -- I very much agree with what you say. At my age (semi-retired) I accept I'll never get my head round everything to do with climate but I can clearly see how the jigsaw pieces fit together and the more I understand, the more I can do my bit to correct misinformation wherever it occurs. Like Hansen, I'm driven by concern for my grandchildren's future.
    0 0
  22. @ Sapient Fridge... wow... sorry about that. Just a typo/brainfart of epic proportions. High Tilt = Warmer polar summer Low Tilt = Cooler polar summer My apologies for the confusion, and thanks for picking that up.
    0 0
  23. @1 geologic “can anyone add detail to how the see-saw works?” Cooling of surface water in the high-latitude North Atlantic Ocean causes the density of water to increase so that it sinks toward the bottom (deepwater formation). The cold water that sinks flows southward, and it is replaced by northward flowing warm surface water. This large-scale process transports heat from the southern hemisphere to the northern hemisphere, making the southern hemisphere cooler than it would be in the absence of North Atlantic deepwater formation. When melting ice sheets add freshwater to the North Atlantic Ocean, the surface water is no longer dense enough to sink (freshwater is less dense than salty water), which stops the northward heat transport, leaving more heat in the southern hemisphere. Thus, according to the Shakun et al. paper, it is the initial melting of northern ice sheets that stopped the formation of deepwater in the North Atlantic, leaving more heat in the southern hemisphere, and causing the early signs of warming to appear in Antarctica. Related to this, one problem with the Shakun scenario is that they invoke an initial reduction in North Atlantic deepwater formation (AMOC - in the penultimate paragraph of their paper) about 19,000 years ago. They cite Pa/Th ratios in North Atlantic sediments as evidence to support this view (their reference 24). However, the actual data in reference 24, as well as sediment Pa/Th records presented in subsequent papers (e.g., J.-M. Gherardi et al., Earth and Planetary Science Letters 240 (2005) 710–723; Gherardi et al., PALEOCEANOGRAPHY, VOL. 24, PA2204, doi:10.1029/2008PA001696, 2009) all show the Pa/Th changing after 18,000 years, or nearly synchronous with the onset of rising CO2. This raises questions about the lags and ocean thermal inertia invoked by Shakun, and it suggests that other mechanisms with faster response times may have been involved.
    0 0
  24. John Russell @14 & boba10960 @16 Deary me! There's me calling for precision in terminology & then I call all aspects of the Milankovitch cycles "wobbles." However I think we're pretty much on the same hymn sheet. One thing mentioned but not explicitly is that the 100,000 year wobble (the variation in eccentricity) is by far the weakest yet is the one apparently triggering the recent ice age cycles. The same effect also has a 400,000 beat that is far stronger but I hear say that its effects aren't evident over the last 1 million years. And prior to that time, the more obvious 41,000 year wobble (angle of tilt) appears to have been triggering the ice age cycles back to when the 'modern' ice ages started 30 (?) million years ago. I will be a smart git & say that radial speed of orbit changes more with more elliptical orbit (in the extreme, think of comets) thus winter/summer for a particular hemisphere can vary in length. And there are two components to the precession 'wobble' (orientation of tilt & of eliptical direction) which combine to give a 21,000 year effect. My point here is that it all gets rather complex. That the 'trigger' occurs at the termination of an ice age is something I assume given the saw-tooth temperature profile of recent ice ages but I've yet to encounter authoritative discussion of it. (Perhaps I should emphasis use of the word "authoritative.")
    0 0
  25. There are some interesting questions raised near the end of an article by climate central regarding some of the uncertainties regarding details presented in this paper. They also report that Shakun and his collaborators are confident the main picture will not change significantly.The climate central article has been reposted at climate progress.
    0 0
  26. Readers may also find the recently published paper Carbon Isotope Constraints on the Deglacial CO2 Rise from Ice Cores J Schmitt et al interesting. I was particularly intrigued by the timing they place on CO2 up-welling from the southern ocean. "Our new, high-resolution δ13Catm data constrain the period of this release of isotopically depleted carbon from the deep ocean to the atmosphere to between 17.4 kyr BP and 15 kyr BP" which appears to tie in very neatly with the Shakun et al period of low AMOC strength.
    0 0
  27. Data seems to indicate more of a variation between roughly 80,000 and 120,000 year cycle length rather than the nominal "100,000" years, but it's rather irregular. Unfortunately there is no "cut and dry" level of insolation that is the exact trigger, no single simple trigger. On thing that seems to be a prerequisite for a full-blown interglacial/ termination is a very large accumulation of ice (probably both in terms of extent and thickness). Only a massive runaway ice melt seems to be able to dump enough fresh water fast enough into the arctic ocean to alter thermohaline circulation sufficiently to prod the deep southern ocean into disgorging its accumulated hoard of CO2, thus locking in the warming and the new interglacial. Melting the Greenland ice cap wouldn't be enough. It has to be HUGE! At one point in the last termination, the melting rate was fast enough to raise sea level 5 meters in a single century!!! Ice amok stops AMOC! A termination starts when NH summer insolation becomes intense enough to start net melting of the NH ice sheet. There are two runaway feedback effects involved. One occurs at the ice edges where the ice albedo begins decreasing as bare, newly exposed land absorbs more and more solar energy, shifting the energy balance even more than just the insolation change alone, leading to runaway melting at the edges. However there is also a less well known ice elevation feedback. As the ice sheet begins to melt at its elevated surface, it slowly decreases in elevation, but the more it does, the warmer the temperature at the ice surface and the faster it melts, leading to an almost irreversible runaway that rips through the ice not just at the edges but ultimately over much its surface. The thicker the NH ice sheet is and the greater its southern extent, the more dramatic its melting will be when the insolation balance shifts, and the more commandeering its effect on the thermohaline circulation which, if great enough, triggers the CO2 release from the deep southern ocean. Without this CO2 release, there isn't a full-blown termination, but just a pause in the ice age.
    0 0
  28. mdenison @ #8: The nonlinear response of the climate system would indicate that the rate of change of a variable, such as CO2 (and methane and N20) is just as important, if not more so in determining some final equilibrium state. The natural feedback mechanisms (biological & rock weathering) to maintain CO2 in a range can be overwhelmed, leading to an increasingly unstable system that will rapidly pass through a series of potential "tipping points" that are unpredictable by any model. The dramatic loss of sea ice in 2007 might be one such point, when at the time, it was seen as a "black swan" event, we see, only after the fact, that 2007 was no one-off black swan, but rather a new sharpening downward trend in Arctic Sea ice. Even in analyzing 2007's amazing summer low (which of course came close to being beaten in 2011) fingers were pointed an proximal causes, such as anomalous winds, currents, etc. When, from a wider perspective we now can see as part of a new normal in this rapidly evolving Anthropocene. The sharpening downward trend not predicted by any climate model as such tipping points can only be seen after the fact. An excellent article on this can be found at: http://www.pnas.org/content/105/6/1786.full.pdf+html Other such tipping points, only seen after the fact might well be events such as the Russian heat wave of 2010 and this March heat wave of 2012. Though the proximal causes might be found in unusual blocking events, we might find that the new norm of the Anthropocene is toward more frequent and intense blocking events. There is nothing in the last several million years remotely like what the Anthropocene is now evolving into, and no model will be able to forecast the nonlinear responses to the rapidly changing atmospheric composition of the planet(rapidly by all geological standards). Going to 560 ppm of CO2 in a few hundred years will have a different set of tipping points than going there in 10,000 years as the feedback response in each case is vastly different.
    0 0
  29. So with the reduction of CO2 by Silicate weathering, this stopped the warming in the Southern Hemisphere, which in turn stopped the release of CO2 from the ocean. This would have allowed the planets global temperature to become in balance. So the Atlantic Meridional Overturning Circulation (AMOC) played no part in cooling the Southern Hemisphere, Right?
    0 0
  30. Michael Whittemore @29, actually there is a much simpler explanation. Once the initial warming had commenced, it started a feedback cycle. The effect is that the first degree of warming causes feed backs which result in an additional g degrees warming. These in turn result in an further feed backs resulting in g^2 degrees warming, which in turn result in further feed backs, which cause an additional g^3 warming, and so on. So long as -1 < g < 1 degree C the consequence is a self damping cycle. That is because |g^x| < |g^y| where y > x whenever -1 < g < 1. As it happens, even the sum of an infinite series of such diminishing values will be finite. Consequently, the temperature increase from a given impetus will close in on some finite increase above the original and stabilize at that value, absent new forcings. For the glacial/interglacial transition, we are talking about slow feedbacks, for which the relevant value of g is about 0.8, leading to approximately a 5 degree increase in temperature after feedbacks from an initial one degree increase. So it is not necessary to find some mechanism which weakens the feedback cycle to bring the warming to an end. It will do so naturally so long as g < 1. This is all explained here. As a side note, some fake "skeptics" insist that any positive feedback must end in a runaway effect. They are making exactly the same logical fallacy as was made by Zeno in his famous paradoxes.
    0 0
  31. I read the link, very informative, thanks. Just so I am clear, stopping of the (AMOC) forced the Southern Ocean to release CO2 which caused this feedback system. It was not the temperature rise in the southern ocean that caused it but the extra CO2. This CO2 had a g value of 0.8 leading to a 5 degree temperature increase?
    0 0
  32. @Michael: 1) Orbital change causes insolation increase in Northern and Southern Hemisphere summer. 2) Northern Hemisphere glacial ice caps melt rapidly enough to overwhelm thermohaline circulation. 3) Loss of consistent, global Thermohaline heat redistribution leads to loss of the ability to redistribute heat efficiently. 4) loss of heat redistribution is magnified in the Southern Hemisphere because of the relatively large percentage of earth's surface covered by ocean. The Southern Ocean warms up enough to release large volumes of CO2. 5) The rapid and large-volume increase in atmospheric CO2 feeds back to increase overall global temperature. Simply put: Orbital forcing leads to larger heat inputs at the poles relative to equator. The ensuing melting releases CO2 and fresh water. The fresh water disrupts thermohaline circulation, trapping heat in the oceans that would otherwise be redistributed. The CO2 released feeds back into the increasing temperature/heat greenhouse effect. If this happens fast enough, the CO2 and temperature/heat increases can rapidly overwhelm the negative feedbacks from weathering and organic sequestration....
    0 0
  33. Great article. This is a paper, like the one by De Conto et al. about the permafrost/PETM linkage, that deserves considerable attention. Taking them together, I think it's fair to say that we continue to collect evidence that the Earth System is itself "wobbly" or "twitchy", thanks to the cascade of effects that can be unleashed by even a "minor" perturbation. We may be in the process of learning that the relative equilibrium that's held throughout human history was a much more precarious balance than we generally assumed, especially those of us who are not climate experts. The implications of this inherent nature of our environment, assuming our dawning realization is correct, are very grim. They tell us that not only does it take less of a shove to knock the Earth System out of its state of equilibrium, but that once that move to a new equilibrium state (or excursion through state-space in search of a new eq.) begins, it's extremely hard to reverse the process. You can go home again, but it's much harder than we thought. For those who like physical analogies, I always think of a ball resting in the bottom of a bowl. Poke it, and it rolls around a bit but returns to (virtually) the same position. This is how we prefer to think of the Earth System. But it's looking more and more like the ball is instead resting in a shallow depression on top of an inverted and very irregularly shaped bowl; nudge it very gently and it rolls around and comes to rest in its perch. But even a moderate poke sends it over the edge and going who knows where. And not to go all Jared Diamond about it, but I think there's a strong case to be made that the basic geography of the Northern Hemisphere loads the dice in favor of rapid warming events -- all that land at just the right distance to accumulate and then release carbon, surrounding open ocean that can quickly lose ice cover and kick off the albedo flip positive feedback.
    0 0
  34. danielc @32, with regard to your (1),the orbital change causes increased NH summer insolation and SH winter insolation. It also caused decreased NH winter insolation and SH summer insolation, as can be seen here: Caption reads:
    "Fig. 1. Comparison of insolation anomalies (16) over the past 150,000 years for 70'N (top), 50'N (middle), and 80°S (bottom). Insolation sufficient to begin major melting leading to the last interglaciation occurred only after ca. 135,000 years ago (line labeled ‘A’); an inference based on the observation that major melting over the more wel-constrained and re-cent deglaciation did not begin until the same level of insolation was reached at ca. 15,000 years ago (30) (line labeled ‘‘C’’). A much higher rate of Northern Hemisphere summertime insolation increase existed over the penultimate deglaciation (line labeled ‘‘B,’’ ca. 130,000 years ago) than over the most recent deglaciation (line labeled ‘D,’ ca. 12,000 years ago)."
    0 0
  35. @Tom Curtis: I stated "Increased Northern and Southern Hemisphere summer insolation" - meaning more heat in Northern summer (June/July) and more heat in Southern summer (Dec/Jan). Your statement is more properly worded than mine, but they mean the same thing. Also, yes there was a decrease in insolation in the same places in their respective winter seasons... but the important thing is the summer, because a change from very cold to extremely cold is not as important or as impactful as a change from cool to hot....
    0 0
  36. Re Daniel @ 35, while the corresponding decrease in high latitude winter insolation and consequent more extreme winter cold is less important, even this acts to inhibit ice sheet growth as reduced moisture leads to decreased snowfall accumulation and thus reduced ice formation. It's a two-prong attack on the ice sheet: less new ice formed during the colder, dryer winter, more old ice melted in the warmer, wetter summer.
    0 0
  37. @Jim: absolutely correct... hence, the dry valleys in antarctica... colder = dryer, and dryer = less snow. I agree that it is a less important effect, but the cumulative impact of both hotter summers (increased melting) and colder/dryer winters (decreased accumulation) act effectively together to remove snow/ice rather rapidly. The current situation is "special" due to the fact that we are getting BOTH hotter summers and warmer winters - more melting AND more snow in winter... strange combination due to the overall net increase of CO2 (heat trapping)...
    0 0
  38. I have to be honest here. I am a skeptic. And heres why. I live on the slopes of Mauna Loa, not too far away, is the Mauna Loa Observatory (MLO) where the famous Keeling Curve was made. Its located at the 9000ft elevation(I've been there several times) and just below it, at the 4000 ft level is the most active volcano, Kilauea and its sister, Pu'u O'o vent which has been continuously erupting since 1983. Atmospheric inversions can bring up the C02 to the MLO and causes astronomical spikes in C02. Oceanic acidification data has come from the University of Hawaii Aloha research station located 100km N of Oahu...just at the edge of the great plastic debris field, which is being enhanced by 25 million tons of debris from the Japan earthquake. The biological activity in this area is logarithmically increased due to available surface area of this debris. And with the increased metabolism, there is significant release C02 and organic acids which decreases the pH. Also, the amount of sulfuric/sulfurous and hydrochloric acid from the volcano emissions blows over this area(estimated between 2000-10,000tons/day). With Kona winds, the vog plume blows over the Aloha Station, and currents regularly carry this acidified water to this area. Man also produces 27 billion tons of C02/yr but this is released into an atmosphere that already has 3,600 billion tons. Do the math and man puts out three fourths of 1% of all C02. Seems quite small.... These and other questions have always made me "skeptical".
    0 0
    Moderator Response:

    [DB] The topic of this thread is "Shakun et al. Clarify the CO2-Temperature Lag". In the spirit of true skepticism, we do expect for you to follow up with any further questions on the more relevant threads already supplied to you by the helpful participants here. And when one "does the math" 30 gigatons of annual emissions heretofore sequestered from the carbon cycle that man is now injecting as a bolus slug back into that cycle quite scarcely "seems small".

    [Sph] wsugaimd, Please continue to be skeptical! Pursue your questions to the end. Please engage all of your questions on the appropriate threads, because they truly are very simple questions to answer, and they can be answered unequivocally, beyond all doubt. The points you raise have solid, indisputable answers.

    As such, if you pursue your skepticism, and then go beyond that to ask further questions and to properly understand the answers, you will begin to understand the problem we all face.

  39. wsugaimd, if you are truly skeptical, then you will respond to the response you're about to get. First of all, let me point you to the appropriate threads for each of your arguments. Responses to your comment should be placed on the appropriate threads: CO2 measurements are suspect OA Not OK
    0 0
  40. @wsugaimd: (snip)
    0 0
    Moderator Response: TC: Your off topic comment has been moved to a more appropriate thread as suggested by DSL @39. At SkS we try to keep discussions on topic both in order to keep them focused, and in order to make it easier for our readers to find the appropriate discussion. Your comment was, IMO, particularly informative and I hope wsugaimd lives up to his claim of skepticism by following the link and reading your comment, not to mention the relevant article. Further of topic comments will simply be deleted.
  41. To keep the thread on topic, if people would not further respond to wsugaimd, that would be appreciated. The references to pertinent threads are appreciated, but let it go from here.
    0 0
  42. Wsugaimd @38, (snip)
    0 0
    Moderator Response: TC: Of topic comment snipped and moved to the appropriate thread. Further of topic comments will simply be deleted.
  43. @Jim Eager #42: (snip)
    0 0
    Moderator Response: TC: Of topic comment snipped and moved to the appropriate thread. Further of topic comments will simply be deleted.
  44. The production of CO2 from warming oceans, or at least a reduced absorbtion of same sounds feasible as a feedback mechanism to explain the accelerated melting of continental ice sheets. I wonder, though, if there wasn't another feed back. When you consider the depth of the ice sheets and hence the pressure at the bottom, all seeps of methane, and for that matter, Carbon dioxide, from shale, coal and hydrocarbon deposits plus organic decay would have collected as clatrates at the bottom of the ice sheet. These would have been released at each Milankovitch nudge. If the output of these gasses was sufficient a run away melting could have occurred http://mtkass.blogspot.co.nz/2011/09/continental-glacier-meltdown.html
    0 0
  45. william, A suggestion... use scholar.google.com to search for papers on the subject, and look at them. They aren't as hard to read as you might think, and are far more valuable than a blog by someone who is sort of thinking about things. That said, this has been discussed at length in the literature, and a great debate is raging because nothing ever seems to adequately answer the question that balances all of the ledgers in both quantity and timing. Specifically, I've seen references to methane release from peat bogs, huge fires in peat bogs (turning the methane and other carbon directly into CO2), and numerous other ideas thrown around. BTW, while copies of papers are usually behind paywalls, I've very often found downloadable PDFs (often by including type:pdf as a search term in a regular google search, although it doesn't work on scholar.google.com).
    0 0
  46. (snip)
    0 0
    Moderator Response: TC: Of topic comment moved to the appropriate thread. wsugaimd, you are new here so I am extending you the courtesy of moving your comment rather than simply deleting it. Future of topic comments will simply be deleted. There is an extensive list of "skeptical" objections to the theory of AGW on the side bar. Using it, or the search function will allow you to find discussion of almost any "skeptical" talking point on AGW so that you can post under the correct topic. If you are interested in genuine discussion, I strongly suggest you do the readers the courtesy of posting where they can see the AGW side of the argument immediately without having to do the search themselves. You may also be interested in reading the other side of the argument yourself. If you cannot find the appropriate topic, ask where it is in the digest of the week thread. Regardless of whether you wish to do our readers that courtesy, posting at SkS is conditional on compliance with the comments policy. Anybody who has already responded to this post on this thread may wish to move the comments to the appropriate thread themselves as all responses will be deleted shortly.
  47. danielc @35, actually we are disagreeing. If you look closely at the graph, you will see that at the onset of the last glacial/interglacial transition, there was increased insolation in the NH (top two panels) from March to August. In contrast, in the SH (bottom panel) the increased insolation is from August to December, corresponding to the SH spring. There is reduced SH insolation in January through to March, corresponding to the SH summer and autumn. Clearly my post was inaccurate as well. However, it is a mistake to think that NH and SH insolation effects are equal either by month or by respective season. Changes in the eccentricity of Earth's elliptical orbit will effect both hemispheres in the same way at the same time. Changes in axial tilt (obliquity) will have opposite effects on the different hemispheres, with the synchronization with the elliptical orbit determining whether it moderates of reinforces the NH summer insolation. The combined result is the complex pattern you see in the figure at 34. The reason the NH effects dominate in transitions between glacial and interglacial is because if snowfall extends further north in the SH is simply falls in the ocean and melts, thus preventing the formation of ice sheets.
    0 0
  48. wsu @46 - please also see the rebuttal to the myth CO2 increase is natural, not human-caused'. You are incorrect on this issue.
    0 0
  49. Sphaerica - I've often found that following the Google Scholar "All N versions" link points to at least one PDF copy of the paper, possibly on the authors university site. Not in all cases, but in a great many...
    0 0
  50. @Tom, agreed for the most part... Tilt is a major part of the story, but tilt + precession for a given ellipticity will augment and potentially enhance (a lot!) the differences... NH in the last several million years is inherently more sensitive for a number of reasons: 1) land surrounding polar/arctic region, 2) More land (i.e. more material with lower heat capacity), 3) more land - again (more area for plant growth), 4) more limited and confined ocean circulation paths (both surface and deep water). We can see that sensitivity in the present day in many ways: the difference in absolute value for CO2 measurements compared between north and south, the difference in seasonal variability in CO2, temperatures, water vapor, and so forth between north (large variability) and south (small variability)... Now, as to whether spring insolation vs summer insolation makes that huge of a difference (i.e. does it matter if it comes in Sept. - Dec. or Oct. - Jan) in the SH, I honestly do not know... what does seem clear that at least on first look, the response in the NH drives the bus, and the triggering that happens, happens because of what goes on up North, rather than down South. One way that we sort of knew this already is that Antarctica has been ice-locked/ice-covered since 33 m.y.b.p. (or so), and yet recent style glaciations that involve significant coverage of the NH have been ongoing only since the last 10 million years (sort of) and really less than 3.5 mybp ... (I know there are some lines of evidence and working hypotheses that contest this, suggesting Oligocene glaciation in the NH, but that work is still in progress as far as I know). Point being that the paper that sparked this discussion is saying almost the same thing as the much larger scale geological record: the Southern Hemisphere appears to respond quite faithfully to global insolation/milankovitch/weathering carbon cycle systems, but is not a sensitive trigger like the NH appears to be.
    0 0

1  2  3  4  Next

You need to be logged in to post a comment. Login via the left margin or if you're new, register here.


The Consensus Project Website

THE ESCALATOR

(free to republish)


© Copyright 2024 John Cook
Home | Translations | About Us | Privacy | Contact Us