


 Arguments


What Does Statistically Significant Actually Mean?
Posted on 10 May 2017 by Dikran Marsupial
Used correctly, Null Hypothesis Statistical Testing (NHST) provides a valuable sanity check in science, requiring scientists to question the support their theories receive from the data, such that they only proceed with their research hypothesis if it can overcome this (often minimal) hurdle. This enforces an element of healthy self-skepticism that helps science to be self-correcting in the long term. Unfortunately, however, statistical hypothesis testing is widely misunderstood amongst the general public, working scientists and even professors of statistics [1]. It isn't unduly surprising then, that misunderstandings of statistical significance have cropped up rather frequently in the climate debate. The aim of this post is to give an idea of what statistical significance actually means, and more importantly, what it doesn't mean and why this should matter.
The Basic Null Hypothesis Statistical Testing Recipe
Flipping a coin is the traditional way of deciding between two arbitrary options, for instance which side should have the option of batting or fielding first in a game of cricket. A classic example of statistical hypothesis testing is deciding whether a coin is fair (the probability of a head is the same as that of a tail) or whether it is biased. Say we observe the coin being flipped four times and it comes down heads each time. The usual recipe for statistical hypothesis testing is to first state your null hypothesis (known as H0), which is generally taken to be the thing you don't want to be true. Say we think the captain of the opposition is a cheat and he is using a biased coin to gain an unfair advantage. In that case, our null hypothesis ought to be that we are wrong and that his coin is fair (i.e. q = p(head) = p(tail) = 0.5).
H0: The coin is fair, q = 0.5
We then state our experimental hypothesis, for which we want to provide support
H1: The coin is biased, q ≠ 0.5
We then need a test statistic, z, that we use to measure the outcome of the experiment. In this case, we record the number of heads in n = 4 trials, so z = 4.
The next step is where the self-skepticism is introduced. We begin by assuming that H0 is true and work out the probability of observing an outcome at least as extreme as that actually observed, and only proceed with H1 if we can show that the observations would be sufficiently unlikely if H0 were true. In other words, we assume that we are wrong, at least until we can show that the observations are inconsistent with the null hypothesis.
The probability of a test statistic at least as extreme as that observed is called the "p-value". In this case, there is no more extreme result than four heads in a row if you only flip the coin four times, so the p-value is just the probability of getting four heads in four flips
p = q × q × q × q = 0.54 = 0.0625
We then compare the p-value with a threshold α (commonly α = 0.05, such that the "level of significance", 1-α = 0.95), chosen before performing the experiment. If the p-value is less than α, then the observations would be considered unlikely if the null hypothesis were true, so we say "we reject the null hypothesis" and that there is "statistically significant" evidence that the coin is biased. If on the other hand, the p-value is greater than α, we say "we fail to reject the null hypothesis" and that the evidence for the coin being biased is "statistically insignificant". In this case, the p-value is a bit larger than α, so we do not have statistically significant evidence for the coin being biased (and hence should not accuse the opposition captain of being a cheat!).
So What Does This Tell Us?
Possibly very little. There are two outcomes of the test, so lets consider them in turn:
"We are Able to Reject the Null Hypothesis"
If the p-value is less than α, and we "reject the null hypothesis", we shouldn't rush to conclude that our research hypothesis is correct and that we have disproved the null hypothesis, as this XKCD cartoon neatly demonstrates:

Here the frequentist (of which more later) statistician has performed the mechanics of the NHST correctly, but common sense tells us that it is very unlikely that he is correct in concluding that the Sun has gone nova! So where has the test gone wrong? In this case, the problem is that the significance level (1 - α) has been set much too low. While the probability of a false alarm (H0) is small (1/36), the probability of it being set off under the alternate hypothesis H1 (the Sun has gone nova) is astronomically smaller. The Sun has been shining for about 4,500,000,000 years, so the chances that it chose today to go nova is vanishingly small, so whenever the alarm goes off, it is almost certainly going to be a false alarm. Statisticians traditionally use a significance level of 95% (α = 0.5) as a sensible default value, but unthinkingly using this default is a recipe for the kind of error illustrated by the XKCD cartoon. In practice we should choose a significance level in accordance with our prior knowledge of the system or experiment, in this case, we would require a much higher significance level to believe an alarm was not a false alarm! So if you see an NHST with a 95% significance level, you should question whether that threshold was reasonable, or whether it provides too low a hurdle for the conclusions drawn by the study.
"We are Unable to Reject the Null Hypothesis"
If we are unable to reject the null hypothesis, there are at least two reasons why this might be the case. The first, and most obvious, is that we fail to reject the null hypothesis simply because it happens to be true1! The other alternative is that it is false, but we haven't collected enough observations to provide sufficient evidence that the coin is biased. Say we have a double headed coin; before we have observed a single coin flip, we are in a state of complete ignorance regarding the bias of the coin, we have no evidence to go on. If we observe an infinite number of coin flips and it comes down heads each time, we can be absolutely certain that the coin is double-headed. As the number of flips observed increases and we get a head each time, we have stronger and stronger evidence for the bias of the coin. The question is, how many flips do we need to observe to be confident that we would have rejected the null hypothesis when it actually is false. To do this, we need to look at the statistical power of the test.
The "statistical power" of the test is the probability that the test will reject the null hypothesis when it is false, which statisticians express as 1 - β, where β is the probability of a false negative error (failing to reject H0 when it is false). We can use statistical power to decide how much data we need to collect for us to be reasonably confident that if we fail to reject the null hypothesis it probably is because the null hypothesis is false. So that we are not biased towards H0 or H1, we can set the desired statistical power such that the probability of a false negative error is the same as the probability of a false positive, i.e. β = α = 0.05.
[The calculation of statistical power is rather involved, so feel free to skip this bit]
The statistical power depends on the probability of a head if the coin is biased (i.e. if H1 is true and H0 is false). If the coin is double headed (q = 1) then we won't need a huge number of flips coming up heads each time to be confident that the coin is indeed biased. However, if the coin is only slightly biased (say q = 0.6) then 40% of the flips will fall tails and it will be much less obvious that the coin is biased and more flips will be required. Lets revise the example, such that
H1: The coin is biased, q = 0.6.
We can then compute the statistical power as a function of the number of flips, n, using the binomial distribution,
which gives the probability of observing k heads in n flips, if the probability of observing a head on any given flip is p. The cumulative probability distribution is then
where is the largest integer greater than or equal to k. For a given number of flips, say n = 10, we can determine the range of values of k (the number of heads observed) for which we would be unable to reject H0 by finding the largest k such that F(k; 10, 0.5) < α/2 (as it is a two-sided test), in this case we find that we can reject H0 if k < 2, and by the symmetry of the binomial distribution for k >8.
Next we need to work out the probability that k lies in this region if H1 is true, i.e. p=0.6. The probability of observing between 2 and 8 heads under H1 is then β = F(2 ; 10, 0.6) - F(8 ; 10, 0.6) ≈ 0.9413, i.e. even if the coin is biased, we would be unable to reject H0 in about 94% of experiments, so we say the power of the test is (1 - β) = 0.0587, which is very low. This means that while we were unable to reject H0, this isn't very surprising, because the same size is too small, so we shouldn't draw any strong conclusions.
Figure 1 shows a power curve for this example, i.e. a plot of the statistical power as a function of the actual probability of a head using a biased coin, clearly the more biased the coin, the fewer the number of observations we need to achieve satisfactory power.
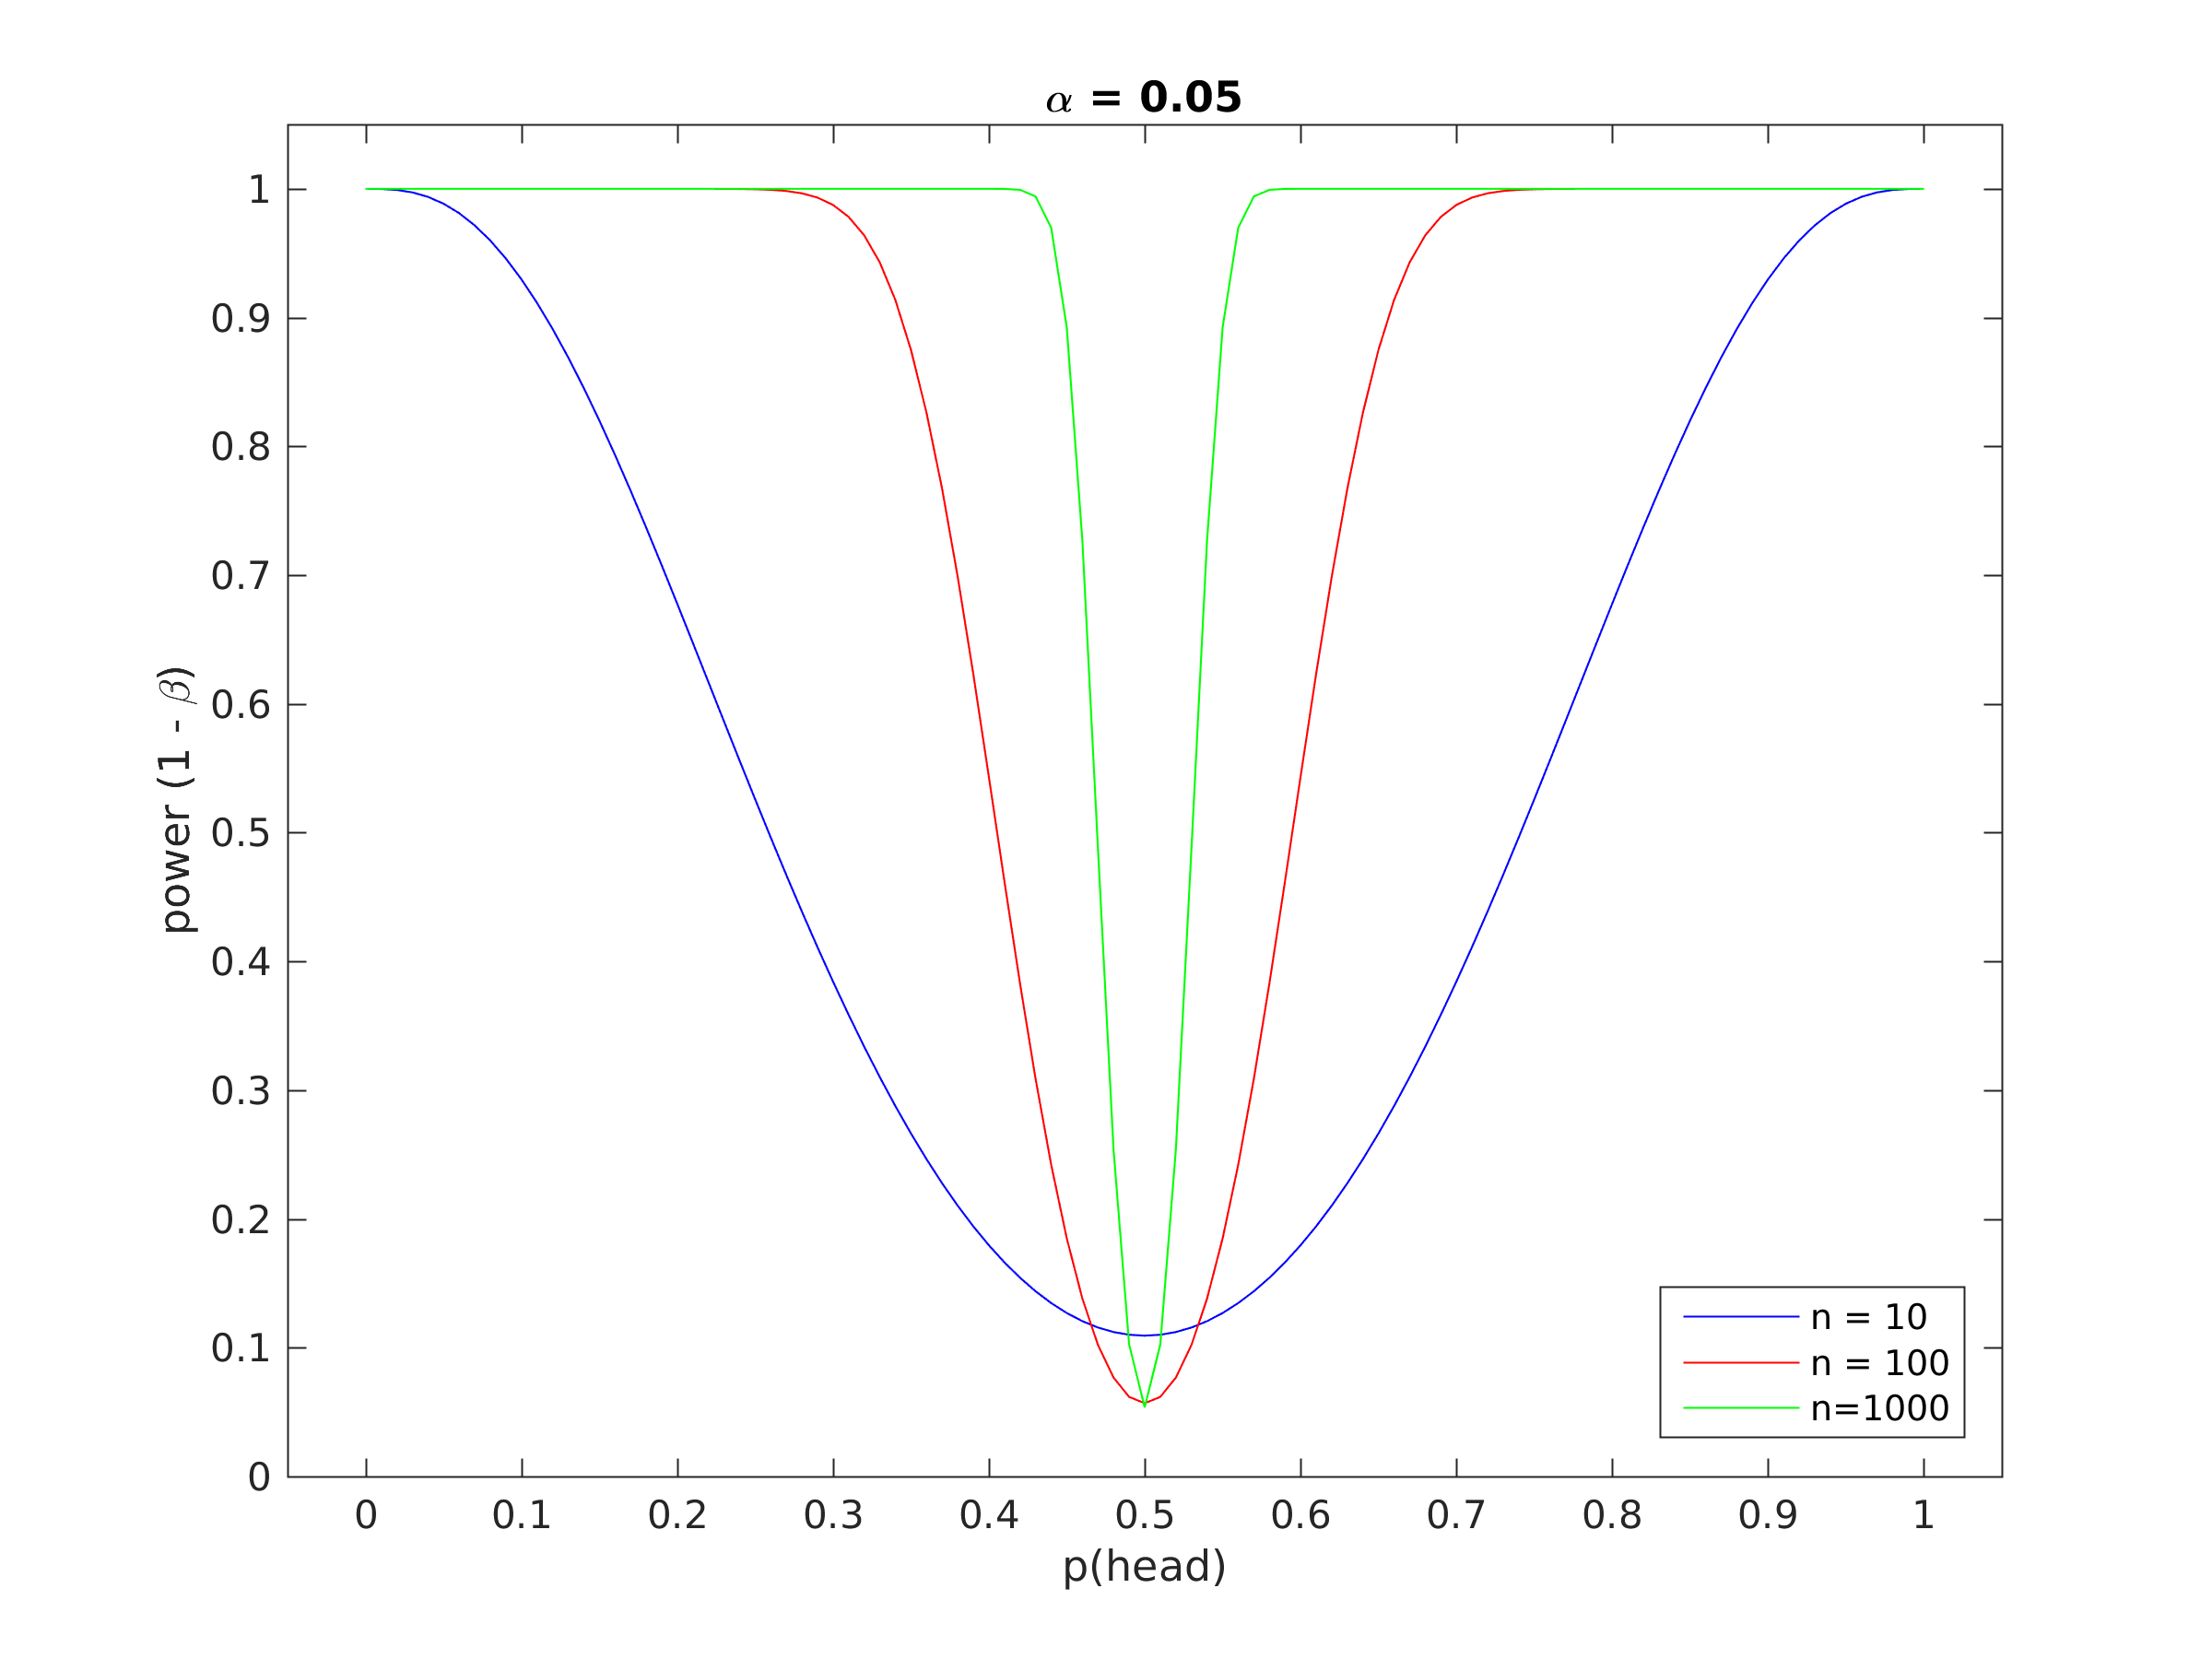 Figure 1. Power curve for the coin tossing example.
The best thing to do would be to plot (1 - β) as a function of n, to find out how many flips we would require to achieve a reasonable level of statistical power, say (1 - β) = 0.8. Then we could be confident that if we were unable to reject the null hypothesis, it probably isn't because the sample size is too small. Figure 2 shows a plot of the statistical power as a function of the sample size, n, which suggests about 200 samples would be sufficient.
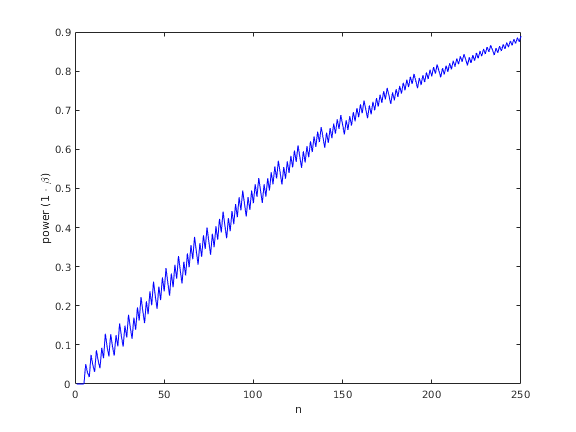
Figure 2. Statistical power as a function of sample size for the coin tossing example.
[rejoin the discussion here]
In the case of the test where we observed four heads in four flips, the power of the test is exactly zero, so we were always going to be unable to reject H0, no matter how biased the coin was, as we only observed four coin-flips. So in this case, a lack of statistical significance doesn't mean that the coin is unbiased, just that there is insufficient evidence to rule out the possibility that it is unbiased!
You will notice that working out the statistical power, and hence the amount of data that needs to be collected, is a lot more complicated than performing the test itself. Things are even more complicated if we look at a less straightforward problem, for instance whether there has been a warming trend in global mean surface temperatures (GMSTs) where such a calculation would be much less straightforward. However, we only really need to worry about statistical power if we are arguing for rather than against the null hypothesis. This is because in that case, we need to show that a failure to reject the null hypothesis is surprising, and that will only be true if the test has high statistical power.
Why do we only say we are "Able/Unable to Reject H0"?
You might wonder why statisticians are so careful in describing the outcome of the test by saying only "we are able to reject the null hypothesis" or "we are unable to reject the null hypothesis" at a particular level of "significance", rather than "the probability that the null hypothesis is false is p". Actually this happens quite a lot, it is known as the p-value fallacy. The problem stems from the definition of a probability. There are two schools of statistics, the "Bayesians" who define a probability as a numeric measure of the plausibility of a proposition, and "frequentists", who define a probability as the long run frequency with which something occurs. This causes a problem for frequentist NHSTs (Bayesian NHSTs have their problems as well) because whether a particular hypothesis (say H0) is true has no long run frequency, it is either true or it isn't which means that frequentists cannot meaningfully talk of the probability that H0 is true. Unfortunately, this is exactly the form of answer we most want from a statistical test, which I think is probably why they are misinterpreted so frequently [sic].
Hiatus, what Hiatus?
So how is this relevant to the climate debate? You may have noticed that climate skeptics like to discuss the fact that global mean surface temperatures have not shown statistically significant warming since [insert cherry picked start date here] and conclude that this means that global warming has somehow stopped happening. Regardless of the physics that suggests that this argument is at best questionable, does this argument have a solid statistical foundation? No, not really, as in the coin-flipping test, if we fail to reject the null hypothesis (in this case that the underlying trend is flat) that can mean one of two things, either the null hypothesis is true and global warming has stopped, or that H0 is false, but we don't have enough data to confidently demonstrate that H0 is false. The step that the skeptics have missed is to consider the statistical power of the hypothesis test. As the expected rate of warming (about 0.2 degrees C per decade) is relatively small compared to the magnitude of the noise created by sources of internal variability, such as ENSO, we need quite a lot of data for the test to have sufficient power to reliably reject the null hypothesis when it is actually false. This is why climatologists tend to use a long period of about 30 years to assess trends.
So next time a climate-skeptic tells you that there has been no statistically significant warming since [insert cherry picked start date here] and that there has been a hiatus in global warming, ask them if they have computed the statistical power of the test, and if they haven't ask them how they know that the lack of significance is not caused by having too little data, rather than because there actually has been a hiatus2. They are also largely negating the value of NHSTs by adopting a null hypothesis that is the thing they are arguing for, rather than against, so it is (somewhat ironically) of little use in enforcing self-skepticism.
Of course, what they should do is to devise an NHST where the null hypothesis, H0, states that warming has continued at the same rate, and see if they can reject that...
References
[1] Haller, H., & Krauss, S. (2002). Misinterpretations of significance: A problem students share with their teachers? Methods of Psychological Research Online, 7 (1), 1–20 (www).
Footnotes
1As a coin is not completely symmetrical (it has heads on one side and tails on the other) it is almost certainly infinitessimaly biased, so in this case we know from the outset that H0 is false, at least as stated, although the magnitude of the bias is very small. There are a lot of things that are rather counter-intuitive about statistics, the fact that it is sometimes reasonable to use a null hypothesis that you know from the outset is false, is just one of them!
2I am not claiming that there definitely has not been a hiatus, just that a lack of statistically significant warming does not imply that there has been no warming.


"The probability of a test statistic at least as extreme as that observed is called the "p-value". In this case, there is no more extreme result than four heads in a row if you only flip the coin four times, so the p-value is just the probability of getting four heads in four flips"
— Not quite. There is another equally extreme outcome (4 tails) which should be considered to generate a 2-tailed p-value — the probability of getting FOUR OF THE SAME RESULT (4 heads OR 4 tails) in four flips = 0.0625+0.0625 = 0.125. Now, a result of 4 tails might not rouse suspicion (because it works against the other team's interests), but that is not really relevant to the test of whether the coin is fair.
Mammal_E indeed, good point.
Yes, but the sequences HHHT, or THHT are both equally unlikely, too - in fact any single sequence of four tosses has the same probability of 0.0625 (with a fair coin).That's how we figured out 0.0625 - there are 16 different sequences of four tosses, each with equal probability (1/16), all equally "extreme".
If you had a coin that constantly repeated the sequence THHT, then even though you get 50% heads and 50% tails over a long period of time, you would still be playing in a rigged game. If you bet on the basis that each toss was independent/random, then the person that rigged the coin and knew the pattern would be able to take your money.
Four heads in a row or four tails in a row gets our attention because we see a pattern - and our brains think that pattern is significant, even though it is quite possible with a fair coin. Because we see a pattern, we think it is more significant than it really is.
...which is why we should use statistics.
The comments by Bob Loblaw @3, and Mammal_E @1 show how important it is to be clear in what you are testing. If we are testing to see if a coin shows heads (or tails) on both sides, the most reliable statistical test is to look at one side, then look at the other.
If we want to test to see if it is weighted to favour one side over the other, and absent precise measuring devices, the best test is to flip it repeatedly to see if there is a bias in the results. In this instance a two tailed test is appropriate because we do not know whether it is biased towards heads or tails, but we would not test against the probability of a particular sequence of heads or tails, but a particular frequency of heads or tails given that a weighted coin will not always turn up the lighter side.
If we want to test to see if an umpire, or group of umpires are cheating in favour of a particular team in the coin toss, we would use a single tail test against the actual sequence of calls by the captain of the team. The test will be against the probability of that sequence turning up given the number of sequence calls (ie, the number of call sequences by all captains in the competition).
Another point w.r.t. significance that is often misused (naively or deceitfully) is examining a series then cherrypicking a local min or local max as the start point for a supposedly "new" and "independent" analysis. This can drastically bias the raw probabilities given by various stats procedures.
By picking a local min in a descending series we can see false "recoveries" in, for example, ice extent records. Alternatively, by picking a local max in an ascending series we can see false "pauses"--or even "cooling periods"--in, for example, temp records. In both cases the reported probabilities have little to do with the actual probabilities when corrected for the cherrypicks.
Dikran valuable article, quite informative, in fact mind-boggling. It helps an uninitiated, such as myself, appreciate the depth of cumulative complexity. It also underscores the reason real experts have spent decades and life times dedicated to studying this. It'll make a handy reference. Thank you for taking the time to tackle the near impossible task of explaining statistical significance to dummies. :- )
peter
To tie jgnfld's comment 5 to the coin toss example, what most of the pseudo-skeptic fake Galileo's tend to do wtih their naive or misleading analyses is to wait for the random toss of the fair coin to come up with four heads in a row. Then they try to argue that there is a trend from heads to tails when they include those four tosses at the start of a longer sequence.
Thus, HHHHTHTT is used as "evidence" that the coin is changing its behaviour away from heads. As long as you are patient (or dishonest) enough, you will eventually find that HHHH sequence to start with.
@7 Exactly. And to take it one step further, at which point does the expectation of a fair coin exceed 50-50 once you start from a long run?
Answer: Always. The long term expectation of a fair coin will ALWAYS be biased to at least some degree into the infinite future by starting from a run and counting that cherrypicked run into the total.
WRT allegations of a statistically-significant 'hiatus', during the interval from about 2000 to about 2014, in the long-term (30+ years) trend of GMST: according to Tamino, because a significant long-term trend had already been shown, the correct null hypothesis isn't that the slope of the GMST trend was zero during the alleged hiatus, but that there was no change in the long-term trend. There wasn't, as it turns out; statistically speaking, no change from either the trend from 1970 - 2000, or the current 30-yr trend, emerges from the noise.
https://tamino.wordpress.com/2016/11/07/testing-for-change/
Here is a good 2017 article: "The Bayesian New Statistics: Hypothesis testing, estimation, meta-analysis, and power analysis from a Bayesian perspective," Kurschke & Liddell, Psychonomic Bulletin & Review. Full text is available both in browser and as downloadable PDF.
I absolutely agree that the noise is too much to show with any certainty that the 0.2 Degrees C per decade increase in temperature is statistically significant and therefore indistinguisable from 0 or 0.4 Degrees C per decade, especially since you inply a linear trend (which it most certainly is not). The correct question however is; can we predict based on experimental data what the temperature will be in 10 years time? The answer: NO.
Ado @ 11 :
It is statistically probable that you are quite wrong ;-)
Scientists look at the overall context of the climate situation, and are remembering that "significant" statistical data are only a derivative of the physical planet.
In the case you mention, the statistically insignificant 0 - 0.4 DegreesC is accompanied by significant ice-melt and significant sea level rise (for many decades . . . and the reason for that, is well-known). Only the most contrarian of scientists would fail to identify the overall warming!
Ado - using current and historical data plus basic physics, would you predict a higher temperature in 10 years' time? Or a lower temperature? (Even without your mysterious unspecified experimental data.) Probably you need to explain your thinking.
The trend over the length of the record is statistically significant. 10 years may not be enough data to extract significance but that is irrelevant, since there are much more data than is needed to assess a real trend. Such analysis will likely show that, not only there is a significant warming trend, but that it also is accelerating.
https://tamino.wordpress.com/2019/11/08/global-temperature-update-6/
https://www.climate.gov/news-features/understanding-climate/climate-change-global-temperature
Excerpt from the NOAA page: "the combined land and ocean temperature has increased at an average rate of 0.13 degrees Fahrenheit ( 0.08 degrees Celsius) per decade since 1880; however, the average rate of increase since 1981 (0.18°C / 0.32°F) has been more than twice that rate."
Considering the observed increase in decadal trends, and considering the physical reasons for the trend to continue, Ado's remark doesn't have much value.
Some of SkS contributors made a bet with the No Tricks Zone deniers and of course, they won, because the trend is unmistakeable. I have no doubt the same bet will yield the same result for the next decade. It will most likely be very close to 0.2 degC/decade, Ado's uncertainty notwithstanding.
https://www.realclimate.org/index.php/archives/2021/02/dont-climate-bet-against-the-house/#more-23421
Well, Ado might have a point if the science of global warming was based on nothing more than extrapolating the current temperature trend, but it isn't.
Climate scientists know a lot more than what Ado appears to know, so Ado is engaged in an argument from incredulity dressed in sheep's clothing.
If Ado wishes to learn more about what climate science knows, he can try either of the following:
HIstory of Climate Science (big button near the top of the Skeptical Science home page)
https://skepticalscience.com/history-climate-science.html
Spencer Weart's The Discovery of Global Warming:
https://history.aip.org/climate/index.htm
Ado @11,
In addition to the helpful comments already provided I have a different perspective regarding the answer to the question "... can we predict based on experimental data what the temperature will be in 10 years time?" The answer is that you need to be more specific. Provide all of the conditions that are to be the basis for forecast and provide a definition of what is meant by the Temperature.
Examples of Conditions:
Examples of what is meant by "Temperature 10 years from now":
Ado @ 11...
Given the fact that we know increasing greenhouse gas concentrations are increasing radiative forcing, it's actually fairly easy to make rational predictions about the coming 10 years.
I did this 10 years ago, based on the same premise, and won this bet:
https://skepticalscience.com/impossible-to-lose.html
I'm ready to make the same bet again, and would continue to do so until there's a reasonable assumption that we would reduce carbon emissions to net-zero within the coming decade.