


 Arguments


The History of Climate Science
Posted on 5 June 2020 by John Mason
Introduction
The fact that carbon dioxide is a 'greenhouse gas' - a gas that prevents a certain amount of heat radiation escaping back to space and thus maintains a generally warm climate on Earth, goes back to an idea that was first conceived, though not specifically with respect to CO2, nearly 200 years ago. The story of how this important physical property was discovered, how its role in the geological past was evaluated and how we came to understand that its increased concentration, via fossil fuel burning, would adversely affect our future, covers about two centuries of enquiry, discovery, innovation and problem-solving.
This version (June 2020, updated October 2023) supercedes the original April 2013 article, since a lot more has come to light about the work done in the 1850s-early 1860s and the important role of Eunice Foote. Katharine Hayhoe is particularly thanked for helpful discussions on that topic.
For larger versions of all timeline graphics, please click on them (they will each appear in new browser windows).

Climate Science - the complete timeline, created by jg. Click on graphic for larger version.
In the beginning...
To pick up the scientific trail of what is today known as the Greenhouse Effect, we need to travel back in time to France in the 1820s. Napoleon, defeated at the Battle of Waterloo a few years previously, had just died. A scientist, who had formerly undertaken significant engineering and academic projects for the late Emperor, was now busily engaged on his investigations of the physical world. He had a specific interest in the behaviour of heat. This was Jean Baptiste Joseph Fourier (1768–1830).
Fourier had calculated that a planetary object the size of Earth should, quite simply, not be as warm as it is, at its distance from the Sun. He knew that distance, since it had been calculated using a combination of observations of the passage of Venus across the Solar disc and trigonometry, in the 1770s. The value obtained was remarkably close to modern measurements – 149 million kilometres calculated back then, as opposed to today's measured 153 million kilometres.
Taking this calculated figure into account, Fourier reasoned there must be some other factor, apart from incoming solar radiation, that keeps the planet warmer. The suggestion he came up with was that the energy coming in from the sun in the form of visible and ultra-violet light (known back then as "luminous heat") was easily able to pass through Earth's atmosphere and heat up the planet's surface, but that the "non-luminous heat" (now known as infra-red radiation), emitted by the Earth's surface, could not make it back in the opposite direction, quite so readily. The air must, he reasoned, act as some kind of insulating blanket. That was about as far as he got with the idea back then, as the detailed measurements required to explore this hypothesis were not available, given the technology of the day. But he was uncannily close to the truth.

Climate Science timeline, 1820-1930, created by jg. Click on graphic for a larger version.
1850s-early 1860s: Foote, Tyndall and heat-trapping gases
Some 35 years later, the thread was picked up again. To Irish natural historian and pioneer in Alpine climbing, John Tyndall (1820-1893), the evidence, controversial at the time but now mainstream, clearly indicated that at one time much of northern Europe had been covered by ice-sheets. However, what was far from clear was how the climate could change in such a drastic manner. Among the possibilities Tyndall considered was variations in the composition of the atmosphere, and via a series of experiments at London's Royal Institution, he eventually made the discovery that water-vapour was an important heat-trapping agent. He also found that carbon dioxide was very good at trapping heat, despite being a trace gas occurring in the hundreds of parts per million (ppm) range.
Hundreds of parts per million may not sound like a lot, but some compounds have important properties at such concentrations: for example, 500ppm of hydrogen sulphide in air may lead to asphyxia, as any health and safety fact-sheet on the gas will tell you. To a mineral prospector, thirty parts per million of gold in a rock outcrop would count as a very significant discovery. That's easily ore-grade. Locate a few hundred thousand tonnes of ore like that in one mineralised zone and you've found yourself a profitable mine. These are all useful things to recall when someone dismissively tells you that carbon dioxide is, “only a trace gas”. It doesn't matter.
In his 1861 paper, “On the absorption and radiation of heat by gases and vapours, and on the physical connexion of radiation, absorption, and conduction” (PDF here), Tyndall stated:
“Now if, as the above experiments indicate, the chief influence be exercised by the aqueous vapour, every variation of this constituent must produce a change of climate. Similar remarks would apply to the carbonic acid diffused through the air; while an almost inappreciable admixture of any of the hydrocarbon vapours would produce great effects on the terrestrial rays and produce corresponding changes of climate.”
However, what is less well-known is that Tyndall was not the sole pioneer in this field at the time. He had, in fact, been beaten to that title by several years. Eunice Foote (1819-1888) was a scientist based on the other side of the Atlantic, in New York State. She had been investigating the effects of sunlight, using glass tubes containing air and other mixtures of gases – including carbon dioxide. Her results were announced at the 1856 meeting of the American Association for the Advancement of Science, and published in the American Journal of Science and Arts in the same year. The paper was entitled, ‘Circumstances Affecting the Heat of the Sun’s Rays’, an excellent review of which was presented by Joseph Ortiz and Roland Jackson in 2020, with open access here.
A key passage from Foote's paper is as follows:
“The highest effect of the sun’s rays I have found to be in carbonic acid gas. An atmosphere of that gas would give to our earth a high temperature; and if as some suppose, at one period of its history, the air had mixed with it a larger proportion than at present, an increased temperature from its own action, as well as from increased weight, must have necessarily resulted.”
That passage amounts to the first stated link between CO2 levels and global temperature: as such it represents a fundamental milestone in our understanding of climate. But was Tyndall aware of Foote's paper? Since the original (2013) publication of this historical account, that question has garnered a lot of interest. A paper (open access), again featuring Roland Jackson as author, was published in the Royal Society Journal of the History of Science in 2019. Entitled “Eunice Foote, John Tyndall and a question of priority”, it concludes that Foote's work largely went overlooked at the time. As Jackson points out, in the 1850s, America was a country in which active, leading scientific researchers were relatively few in number, compared to Europe with its great, long-established scientific institutions. Several other cultural and practical reasons are cited to support the same conclusion, also explored in length on Jackson's website here. Not everyone agrees with this perspective: see this excellent recent summary by Rachel Brazil for details, although it is strange that Tyndall makes no mention of Foote anywhere, unless it's simply the case that nobody has yet found it.
Thus, although Foote was the first investigator to identify carbon dioxide and water vapour as heat-trapping gases, it is apparent that Tyndall was either unaware of Foote's work or was not trying to directly replicate it in any case, since his apparatus used an infra-red heat-source as opposed to direct sunlight. Foote's detection was, by contrast, via infra-red radiation emitted in response to incident sunlight. So the specific role of infra-red is Tyndall's discovery. More critically, Tyndall's work on gases did not start with CO2 and water vapour, as one might have expected if he was attempting to replicate Foote's work. His initial tests involved oxygen, hydrogen and nitrogen, or “simple” gases as he referred to them.
Regardless of such complications, though, one thing is quite certain. Two independent workers, remote from one another on either side of the Atlantic Ocean, were able to reach the same key conclusions within a few years of one another: namely that a) atmospheric carbon dioxide traps heat and b) changes in its concentration would cause changes in global temperature. The existence of Fourier's “insulating blanket” had been confirmed and its key ingredients identified.
Carbon dioxide: Arrhenius makes a discovery
Foote and Tyndall's discoveries did not completely solve the riddle of the ice ages: that came much later. But it planted the seed of an idea that was revisited towards the end of the 19th Century by Swedish scientist Svante Arrhenius (1859-1927). Reasoning that, because it fluctuated daily, water vapour was continually recycling itself in and out of the atmosphere, he turned his attention to carbon dioxide, a gas resident for a long time in the atmosphere whose concentration was only (at that time) dramatically changed by major sources such as volcanoes or major drawdowns such as unusual and massive episodes of mineral weathering or the evolution of photosynthetic plants: events that occur on very long, geological timescales. Arrhenius figured out that an increase in the amount of carbon dioxide in the atmosphere would result in a certain amount of warming. In addition, it was already known via the Clausius-Clapeyron relation, that warmer air can hold more water vapour: the amount is about 7% more per degree Celsius of warming. And that additional water vapour would in turn cause further warming - this being a positive feedback, in which carbon dioxide acts as a direct regulator of temperature, and is then joined in that role by more water vapour as temperatures increase.
Through further work Arrhenius determined that if you halved the amount of atmospheric carbon dioxide, the temperature of Europe could drop by as much as 4-5°C. But could such a change, big enough to cause an ice age, occur? He turned to colleague Arvid Hogbom (1857-1940), who had been investigating natural carbon dioxide cycles, to see if it could. Hogbom had, at the time, started to consider carbon dioxide emissions from factories (simple enough if you know, for example, how many tons of coal each factory burns a year). He had been surprised to find that man-made emission rates were very similar to those occurring in nature. Back in the 1890s, that of course represented a tiny fraction of the fossil fuels that we burn today; but what, they asked themselves, might happen if mankind burnt ever-increasing amounts over many centuries? Side-tracking from the ice-age research, Arrhenius ran calculations to see what a doubling of carbon dioxide levels might do to temperatures. He came up with an answer of 5-6°C of warming as a globally-averaged figure.
Back then, at 1890s burning-rates, they didn't see this as a problem: firstly at those rates it would take thousands of years for the doubling to take place and secondly the oceans were thought to be able to absorb five-sixths of the emissions. By the time the hypothesis appeared in a popular book that was published in 1908, the burning-rate had already gone up significantly, so in accordance with that change they revised the doubling-time down to a few centuries, but it was still something of a scientific curiosity, the stuff of after-dinner conversations.

The Grandfathers of Climate Science
Skepticism: Arrhenius vs. Ångström
The findings did meet with a lot of skepticism during the early 20th Century: the objections were centered around claims of oversimplification, failure to factor in changes in cloudiness, and results of laboratory tests by another Swede, Knut Ångström (1857-1910). Ångström instructed a laboratory assistant to measure the passage of infra-red radiation through a tube filled with carbon dioxide. The tests began with slightly lower amounts of the gas than would be found in a complete section of the atmosphere from top to bottom - although to truly represent the atmosphere, a 250 cm tube, as opposed to the 30 cm one that was used, would have been closer to the mark. Then, the amount of carbon dioxide was reduced by a third: they found what they regarded as very little change and came to the conclusion that the absorption bands of the light spectrum at which carbon dioxide absorbs were quickly saturated - clogged-up, so that their absorption would not increase.
Another problem raised at the time was that water vapor also absorbs infra-red radiation, and in the available and by modern standards rather low-resolution spectrographs of the time, the absorption bands of the two gases overlapped one another. It was thought, therefore, that increasing carbon dioxide would be countered by it being unable to absorb infra-red radiation in bands of the spectrum that the much more abundant water vapor was already blocking.
However, the precision of the measurements obtained by Ångström has since been shown to have been poor: his reported decrease of absorption accompanying a 33% decrease in carbon dioxide concentration was 0.4%, when it would in reality be about 1%, enough to make a significant change to planetary temperatures. Not only that, total saturation in the lower atmosphere is not a problem for the Greenhouse Effect: if the upper layers of the atmosphere remain unsaturated, they will still prevent heat getting out into space. The atmosphere cannot simply be treated as a tube full of gas: it has multiple layers, each with its own properties, and how these layers interact is important.
But back then, it was concluded that Arrhenius was wrong and Ångström moved onto other research, despite Arrhenius publishing a paper critical of the experiments and explaining how in the dry upper atmospheric layers, the role of water vapour was of limited importance. This was - and still is - because water vapor in the upper troposphere occurs in concentrations several orders of magnitude less than in the lower troposphere where most of our weather occurs. As luck would have it, however, nobody took a lot of notice of that and, in effect, the carbon dioxide greenhouse effect hypothesis went to sleep for over two decades.
1930s: Hulburt and Callendar
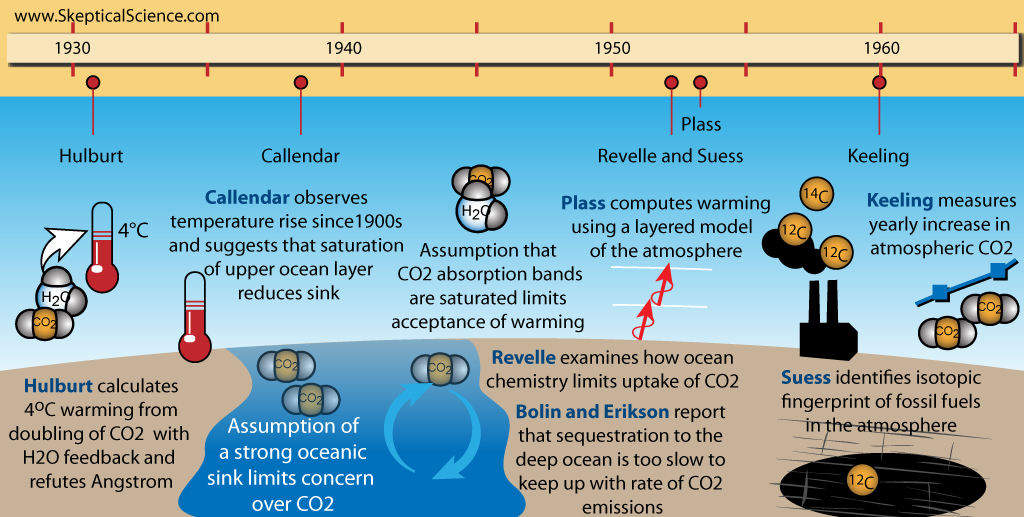
The trail was picked up again in 1931, when American physicist E.O Hulburt ran calculations to determine the effect of doubling carbon dioxide once again, and, including the added burden of water vapour, he came up with a figure of around 4°C of warming. He also rebutted Ångström's work and determined that, regardless of convective processes, it was the escape of infra-red radiation to Space (or the hinderance thereof) that was of key importance. The resultant paper appeared in a the journal Physical Review, which tended not to be read by earth and atmospheric scientists and was as a consequence missed by many of them. In any case, it was generally thought that Earth's climate system maintained itself in some natural kind of balance. In retrospect, given the dramatic climate changes that had led to the ice ages, this was a curious stance to take.
Seven years later, English engineer Guy Callendar, something of an outsider (a steam-engine specialist but with a very keen interest in meteorology), revived the idea, having discovered evidence of a warming temperature trend in the early twentieth century from compilations of temperature records. At long last, the actual levels of carbon dioxide in the atmosphere were revisited: Callendar found they had increased by some 10%, which he suggested may have caused the warming, and he went on to add that over the coming centuries there could be a climate shift to a permanently warmer state.
The reaction at the time was luke-warm: for example, doubt was cast upon the accuracy of carbon dioxide concentration measurements from the nineteenth century. Plus, there were still the old doubts with respect to the original work of Arrhenius: surely the vastness of the oceans would manage to absorb most of that extra gas. Callendar suggested that the top layer of the ocean, that interacts with the atmosphere, would easily become saturated with carbon dioxide and that would affect its ability to absorb more, because, he thought, the rate of mixing of shallow and deep oceanic waters was likely to be very slow. And there was still that old problem of water vapour and carbon dioxide radiation absorption bands overlapping, decreasing the greenhouse properties of the latter gas. Callendar's own calculations, giving a 2°C temperature rise for a carbon dioxide doubling, were slated: one major criticism was that they dealt only with radiation and left out the effects of that other important way in which heat is moved around, convection, despite what Hulburt had already written about that. Again, the prospect of warming causing more cloudiness was raised - something that there were no methods available at the time with which to estimate in terms of amount. All perfectly reasonable objections, simply because there were insufficient data available at the time to clarify matters further.
Climate Science Timeline, 1930-1960, created by jg. Click on graphic for larger version.
Post-1945: Cold War technology lends a hand
The post-Second World War period saw a renewed drive to unravel parts of the climate problem, helped by the upsurge in scientific research that accompanied the onset of the Cold War. Atmospheric processes had key implications in military terms, so that it was deemed necessary to understand them as thoroughly as possible, and the properties and behaviour of infra-red radiation came under particular scrutiny, given that if missiles were somehow able to home in on hotspots such as jet exhausts they could seek and destroy such things. The experiments of Ångström, involving air containing various amounts of carbon dioxide in a tube, were found to have been misleading: the problems were down to the relatively low-resolution measuring equipment available at the time. Instead of broad absorption bands, the more precise modern equipment found groups of sharp lines, where absorption would occur, with gaps in between where the infra-red would get through unhindered. Carbon dioxide and water-vapour had their own sets of absorption-lines that did not exactly coincide and it was reaffirmed that water vapour was relatively unimportant in the dryer upper levels of the atmosphere. Now, it was certainly realised that the properties of each layer needed to be taken into account too. Hulburt and Callendar - and indeed Arrhenius - had after all been on the right track, even if aspects of their conclusions were incorrect.
By the mid-1950s, scientists had the huge advantage of the calculating power of computers. This made it possible to dissect each layer of Earth's atmosphere and work out how it might absorb infra-red radiation. Physicist Gilbert Plass undertook the task: firstly his work (published as a paper entitled The Carbon Dioxide Theory of Climatic Change, in the journal Tellus in 1956) confirmed that more carbon dioxide would have a warming effect and secondly that doubling levels of that gas would result in a warming of 3-4°C. That, at mid-1950s emissions rates, would be a rise of around 1.1°C per century. Plass wrote that if at the end of the 20th Century the average temperature had continued to rise, it would be "firmly established" that carbon dioxide could cause climate change. But again, the response was luke-warm. The lack of attention to water-vapour and cloudiness led to criticisms of crudeness, and again the matter of the ocean absorbing the extra gas was raised in objection to Plass' suggestion that the extra carbon dioxide would remain in the atmosphere for a thousand years.
Carbon Isotopes
The 1950s was the era of nuclear tests. Amongst the fallout from nuclear explosions was carbon 14, an unstable isotope of carbon that has six protons and eight neutrons in the nuclei of its atoms (the most abundant by far, forming 98.9% of all carbon on Earth, is carbon 12 with six protons and six neutrons). Because carbon 14 is unstable, it undergoes radioactive decay, and through this radioactivity it can be tracked as it moves around in the atmosphere. The tracking enabled scientists to establish that within a matter of years any long-lived gases added to the atmosphere are well-mixed throughout all layers, from pole to pole. But carbon 14 also forms high in the upper atmosphere, where cosmic ray bombardment occurs. This is a constant process compared to the one-offs that represent each nuclear explosion, a factor that allowed another test to be made.
Carbon 14 has a short half-life, which is why radiocarbon dating is only used for getting ages for relatively recent things and not ancient stuff like rocks that are millions of years old, amongst which can be counted the fossil fuels. In coal and oil, all the carbon 14 has long since decayed away, so that burning them would only release non-radioactive carbon 12 and the much rarer but stable carbon 13. Burning fossil fuels on a massive scale would therefore add more carbon 12 and 13 to the air relative to carbon 14, regardless of nuclear tests. Chemist Hans Suess put this to the test by examining carbon isotopes in trees. He found that the younger the wood, the more carbon 12 and 13 there was relative to carbon 14. This was the fingerprint of fossil fuel-burning, recorded in the wood.
Suess and Revelle work to clarify the role of the oceans
At the time, the increase in carbon 12 and carbon 13 was small, reinforcing the idea that the oceans were absorbing much of the added carbon dioxide. However, follow-up research was commenced by Suess, working with Roger Revelle at the Scripps Institution of Oceanography, and by other specialists: all came to a similar conclusion independently of one another, which was that the ocean would typically have claimed any molecule of carbon dioxide emitted within about a decade. However, Revelle, something of a specialist in sea-water chemistry, was aware that the various chemicals present in sea-water have buffering effects that work to keep sea-water at a slightly alkaline state. Revelle suggested that the buffering would place a strict limit on the amount of carbon dioxide the oceans could actually absorb.
This was a critical step in the research. Revelle calculated that, at the emissions-rates of the time (assuming, like most of his predecessors, that these would likely remain constant), an increase of atmospheric carbon dioxide levels of around 40% was possible over the coming centuries. However, as an aside he did note that if emission-rates kept on increasing, the outcome would be different with significant warming in the decades ahead. Importantly, he pointed out that human beings were now carrying out a large-scale geophysical experiment of a kind that could not have happened in the past or be reproduced in the future - an allusion, perhaps, to the growing realisation of the finite, one-off nature of the fossil fuels, being as they are a non-renewable resource over human timescales.
The significance of the limited ability of the oceans to absorb carbon dioxide caught on after a while and was elaborated upon by Swedish meteorologists Bert Bolin and Erik Eriksson, who explained what happens. Basically, although the gas is indeed easily absorbed by sea-water, it is the timescales that matter: mixing of shallow and deep oceanic waters takes place over hundreds to thousands of years but sea-water can de-gas parts of its carbon dioxide payload over much, much shorter periods. Like their predecessors, Bolin and Eriksson ran the calculations regarding possible temperature changes for a doubling of carbon dioxide, but this time assuming emissions would increase and increase yet more on an ever-steepening upward path. They wrote of a 25% increase of atmospheric carbon dioxide by the year 2000. This was far more drastic than anything previously had suggested and Bolin warned that a radical change in climate might occur, a statement echoed by Russian climatologist Mikhael Budyko in 1962.
Late 1950s: Carbon dioxide monitoring commences in earnest
So, what was happening to the atmosphere's carbon dioxide content? Was it really going up? The only way to find out would be to start monitoring the levels of the gas by accurate measurement, so moves were made to do just that, starting with a network of 15 measuring-stations around Scandanavia. The results were incredibly noisy, but then flaws were found in the methodology. However, in California, researcher Charles David Keeling improved the techniques, to the point where he felt that it might be possible to isolate and remove spurious sources of noise. Revelle and Suess took him on, funding his time and equipment. Locations far from noisy, local manmade and natural carbon dioxide sources were chosen, in places such as Antarctica and atop the Mauna Loa volcano in Hawaii. It should be mentioned here that, at the latter site, the prevailing wind is off the ocean and the fissures that emit gases are almost always downwind: if the wind changes the sudden upticks due to volcanogenic carbon dioxide are so blindingly obvious that they can easily be removed. Anyway, the idea was to establish a baseline concentration and then see what the levels would be in subsequent years. By 1958, Keeling was confident that he had the baseline reliably nailed and two years later he reported that levels were rising, at a rate that might be expected if the oceans were not taking in most of the emissions as detailed above.

Atmospheric carbon dioxide levels from the late 1950s onwards. The red wiggles mark out seasonal variations in uptake by plants.
Sadly, the Antarctica stations fell victim to a lack of funding. However, the Mauna Loa monitoring station was continued and it continued to find an increase. The measurements also picked-up a well-defined and regular fluctuating cycle corresponding to the growing seasons of plants in the northern hemisphere. There was a decrease in Spring and Summer and an increase in Autumn and Winter marking increased and decreased uptake of carbon dioxide respectively. In the meantime, a steadily increasing understanding of other aspects of the complex carbon-cycle was ongoing. The aim in general was to work out how much of the carbon dioxide resulting from the burning of fossil fuels was ending up in the oceans, vegetation, soils, weathered minerals and so on. Importantly, this multidisciplinary work at last brought together the various branches of science that had previously been working in relative isolation: atmospheric scientists, biologists, geochemists, computer specialists and so on. In 1965, it was announced that "By the year 2000 the increase in atmospheric CO2 ... may be sufficient to produce measurable and perhaps marked changes in climate."
Mid-1960s: the first Climate Model - Mannabe and Wetherald
By 1967, the first computer model that simulated the entire planet's climate had been developed by Syukuro Manabe, working in collaboration with Richard Wetherald. It may have been relatively basic compared to modern models, but nevertheless they found that the movement of heat through convection kept the temperature from running away to extreme levels: however, if the amount of CO2 doubled, temperature would rise by some 2°C. Convective updraughts, such as those that can lead to thunderstorm development, transport a lot of heat from Earth's surface up towards the upper troposphere: a warming surface enhances the process, so that more and more heat is carried up and finds its way to levels where it may be re-radiated out into Space. If the surface got warmer, convection would carry more heat up. This important additional control addressed a long-standing problem that few workers, with the notable exception of Hulburt, had examined in depth.
1970s: New ice-age? Not!
Despite such advances, much doubt was still expressed in the scientific community: climatologist Helmut Landsberg commented in 1970 that the rise of CO2 at the then rate might bring a 2°C rise in temperature over the coming four centuries. This, he felt, could "hardly be called cataclysmic." It was also pointed out, by climatologist Hubert Lamb among others, that the uncertainties included a failure to explain previous temperature fluctuations, known from historical data, over the previous centuries. In addition, temperatures had declined a little since the 1940s yet carbon dioxide levels had increased. What was that about? S. Ichtiaque Rasool and Stephen Schneider of NASA, for example, modelled the effects of pollution in the form of aerosols and sulphur emissions in the atmosphere and discovered that a significant increase of such pollution could - possibly - lead to a cooling episode. Such findings even led to a small minority of scientists and a larger number of commentators musing over whether the current interglacial was coming to an end. Were we about to enter a new ice-age? The media loved that one: despite being a minority view, it was nice and dramatic, thereby making news headlines.

Climate science timeline, 1960-2010, created by jg. Click on graphic for larger version.
There was only one way to find out the answers as to what was really going on: continue the research effort. Through the 1970s and into the 1980s, more important developments occurred, these coincident from the mid-70s onwards with a resumption of warming. The identification of other, sometimes more powerful, greenhouse gases such as methane, the contributions to atmospheric carbon dioxide from other human activities such as deforestation and cement manufacture, better understanding of the temperature-changing properties of atmospheric pollution such as sulphur emissions, aerosols and their importance in the post-1940s northern hemisphere cooling: the knowledge-base was increasing year by year. It became understood that both plants and oceans had limits with respect to how much carbon dioxide they could take up over a fixed time. Computer models were steadily improving as the parameters became better understood. Writing in a 1981 paper in the journal Nature, climatologists Tom Wigley and Phil Jones said: "The effects of CO2 may not be detectable until around the turn of the century. By this time, atmospheric CO2 concentration will probably have become sufficiently high (and we will be committed to further increases) that a climatic change significantly larger than any which has occurred in the past century could be unavoidable."
Ice-cores and ancient air
The drilling of cores in the Greenland and Antarctic ice-caps had by now become an important branch of research into the climate of the past. The ice contains minute bubbles of prehistoric air trapped when it was formed, and once a reliable method had been developed by which to isolate and analyse that air (it is done in a vacuum), it was possible to get an idea of the composition of the atmosphere of the past, through ice-ages and interglacials. It was found that, during the frozen depths of the last ice-age, carbon dioxide levels were much lower, at less than two hundred parts per million. By the mid-1980s, the famous Vostock core had been drilled to a depth of 2km, representing 150,000 years of climate history, or a complete interglacial-glacial-interglacial cycle. Carbon dioxide fluctuations showed a remarkably consistent relationship with temperature.
Data from the ice-cores were also beginning to demonstrate another aspect of the role of greenhouse gases: feedbacks. Even if warming episodes were initiated by orbital changes, the warming itself would cause the release of greenhouse gases from sources including the oceans and melting permafrost. These additional greenhouse gases would then act as powerful amplifiers to the initial warming. The reverse could also occur with increased greenhouse gas drawdown facilitating a temperature decline back into an ice-age. But given that carbon dioxide levels were now substantially higher than anything in the past two millions of years, in either glacials or interglacials, it had become abundantly clear that the greenhouse effect was something we needed to take extremely seriously: even if the precise future increase in temperature was still an unknown quantity, with a fairly wide error-range, models indicated that for a doubling of carbon dioxide from pre-industrial levels, a rise of three degrees celsius as a global average was the most likely outcome.
Another area of research was the much longer-scale climate changes of the long-distant past. Once plate tectonics had been understood, it had become possible, using a whole raft of geological techniques, to retrace the wanderings of the continents back over hundreds of millions of years. These paleogeographical reconstructions demonstrated that, at certain periods in the past, often lasting for tens of millions of years, the distribution of flora and fauna in the fossil record showed that warmth-loving species had enjoyed a much greater latitudinal range than they do at the present day. The planet as a whole must have enjoyed a much warmer climate, with the poles especially warm compared to recent times. Now that the carbon dioxide-temperature relationship was becoming well-understood, attention was turned to these 'hothouse' periods of the past, and evidence began to accumulate that carbon dioxide levels had indeed been much higher at these times.
Solving the Faint Young Sun paradox
This finding also answered another geological problem: that of the so-called 'Faint Young Sun Paradox'. For a long time, astrophysicists had known that the Sun was a main sequence star that had gradually brightened by about 10% per billion years, so that it was considerably dimmer long ago. Geologists knew of some fairly widespread glaciations in the past: there was an ice-age at the end of the Ordovician period, some 445 million years back and, going further back again, there were some huge, perhaps planet-wide glaciations in the Proterozoic eon. The latter events left behind distinctive rock-sequences typically consisting of tillites (ancient boulder-clay, now solid rock) representing ice-deposited debris, overlain with a depositional break by cap-carbonates (chemical sediments of marine origin deposited during interglacials following global sea-level rises). But generally, despite this fainter sun, the climate had, outside of these chilly glitches, been warm, warmer than it ought to have been.

The calling-card of an ancient ice-age - an outcrop in Namibia of ancient (Proterozoic) glaciogenic sediments, overlain by a dolomitic "cap-carbonate" sequence of marine origin, deposited in warmer post-glacial conditions. Photo: P. Hoffman.
1980s: The Carbon-Cycle - Earth's thermostat
Understanding the carbon-cycle was key to explaining this: the realisation was that throughout geological time the levels of carbon dioxide and other non-condensing greenhouse-gases had exterted major controls on the planetary temperature. Carbon dioxide had sources and sinks but every now and then there were major upward or downward swings as unusually powerful sources or sinks dominated the picture. These disturbances were recorded in the strata. Major sources, such as episodes of exceptional volcanic activity, covered near-continental sized areas with lavas and tuffs, thus leaving their calling-cards behind for geologists to examine. Major sinks, likewise: for example, as continents collided, mountain-ranges were formed, making phenomenal amounts of rock debris available to weathering-agents, of which carbon dioxide dissolved in rainwater is one of the most important. These occasional disturbances resulted in warmer and cooler climatic episodes respectively. It was as if these non-condensing greenhouse-gases were acting as the planet's thermostat.
Reconstructions of past Hothouse climates had shown that temperatures had been around six degrees higher on average, and higher still in polar regions, with no polar ice-caps and a temperate to subtropical fauna and flora, as evidenced by the fossil record in these areas. But there was a very important difference between then and now: the rate of fluctuations in atmospheric carbon dioxide levels in the past appeared in many cases to have been at a snail's pace compared to recent increases - and today's levels continue to go up exponentially - faster and faster and faster. Furthermore, very rapid (over a few tens of thousands of years) environmental changes in the geological past were often accompanied by mass-extinctions due to conditions changing faster than ecosystems could adapt to them. It was amid such realisations of how badly things could go wrong that the Intergovernmental Panel on Climate Change was founded, in 1988.
By the start of the twenty-first century, the serious risks associated with the continued tinkering with the planet's thermostat had become all too apparent. They included a wide range of problems: severe and unprecedented droughts affecting agriculture in some areas and severely inflating global food prices and also making conditions more favourable for wildfires; in other areas, increases in extreme rainfall events leading to widespread inundation, destruction of crops, casualties and property loss/damage. Sea level rise over the decades would again affect agriculture due to loss of fertile low-lying lands and would also lead to population displacement and mass-migration. Mankind was, in essence, busily engaged with making areas of the planet's surface uninhabitable for future generations.
Opposition to Science makes its presence felt
It also needs to be recorded in passing that the 1990s saw the emergence of well-funded politically-based bodies promoting opposition to climate science, one of the first being the so-called Information Council on the Environment in 1991; by the closing years of the decade there was also the American Petroleum Institute with its 1998 "Global Climate Science Communication Action Plan", an excerpt from which may be seen below (screengrab of a PDF copy available from the climatesciencewatch.org website). This was a campaign aimed primarily in response to the Kyoto Protocol on limiting emissions, signed in December 1997.

The political trench-warfare that has ensued since that time will be familiar to most readers and the more recent climate science of the latest 20th and early 21st centuries has been extensively covered both here at Skeptical Science and at sites such as Realclimate. The basic principles remain the same, but everywhere the details are being fine-tuned as better methods of data-collection are developed, various problems with proxies that are used to understand the temperatures of the geological past are ironed-out and monitoring is improved. But Fourier, Foote, Tyndall and Arrhenius were definitely somewhere along the right track, all those years ago, when their pioneering work commenced into finding out what makes the Earth's climate tick. That's certainly something to recall if you're discussing climate change with somebody and they try to tell you that climate science has only been around for a couple of decades!
Further Reading
Spencer Weart's The Discovery of Global Warming gives a very detailed account of the history of climate science with a plethora of references - there are many days' worth of in-depth study there for those who want to go beyond the blogosphere!


Good work! I like the graphics; and the rising CO2 trace is a nice touch.
The article does not mention an important deail: the rock weathering climate "thermostat" is very slow to react. It works on a timescale of at least 100ky. Up to 500ky is required for Urey reaction to fully respond to an impulse forcing such as anthopo CO2.
CO2 dissolves in the oceans much quicker (on 100-1000y timescale) but that carbon still stays within AO system and may degass back into A. The amount of CO2 that can be dissolved is limited (as oceans themselves are limitted), and Henry's law dictates that it won't be absorbed entirely. The AOCM models quantify that in a case of a proposed C cycle disturbance of ~1000GT, some 10-15% of that C must stay as CO2 and wait for rock weathering (100-500ky) to be removed out of the system. That's virtual eternity, even on the timescale of homo sapiens as a species. That point should be stressed to pre-bunk the ignorant interpretations - "no worries - the Earth's thermostat will take care of the climate" - of this article.
It's also worth mentioning that rock weathering is too slow to signifficantly react on the Milankovic forcings of 100ky timescale, therfore we do not hear about "rock weathering influences on glacial cycles" in the literature.
The setting of rock weathering thermostat is influenced, on still longer timescale of My, the plate techtonics. In fact, the rock weathering has been used as explanation of temp changes in Cenozoic (64my). Early part of Cenozoic (Paleoce-Eocene) have been hot because India was running like crazy accross the ocean from antarctica to Asia at 25mm/y - therefore triggering more volcanic activity with no change in weathering - more CO2 produced. When India finally smashed against Tibet giving rise to Himalayas - triggering increased rock weathering - more CO2 absorbed in climate cooled down to today's glacial cycles. This is very interesting science, although it must be admitted is based on far less certain prerequisites (i.e. plate techtonics) than the science of e.g. radiative forcing or Charney sensitivity. However, it is rarely challenged by today's "sceptics" - simply because it's not inconvenient - even opposite - it is actually convenient to claim ignorant nonsense ala "little warmer ain't bad because it was far more warmer few My ago".
@ Chriskoz #2 - These are important points, although the piece above is primarily an historical resource. I think this aspect of the carbon cycle deserves a post all of its own. As my SkS colleagues know I'm a geologist specialising in mineralogy, I've probably just volunteered myself to do this!
You are right about the timescales involved with these major weathering cycles. Herabouts (Mid Wales) there are remnants of deep tropical terrestrial weathering (most was removed by glacial erosion in the Quaternary). Around the old lead-mines of the area, highly evolved secondary lead mineral assemblages occur in considerable amounts in association with remnants of this weathering (it leaves normally slate-grey metasediments bulk-leached to pinkish and buff shades). Post Quaternary secondary lead mineral assemblages occur in a slate-grey metasediment matrix in areas where the bulk-weathered material is now absent: the mineralisation is typically found in small amounts of non-equilibrium assemblages - perhaps just what might be expected for a weathering lasting just ten thousand, as opposed to tens of millions, of years. I'll stop rambling now!!
John and jg,
An excellent summary and superb effort. This, IMHO, is a must read by anyone new to this field, or educators looking for a resource for classes. The excellent graphics will no doubt be a popular and effective way of distilling the text/history.
Thanks, John (and jg?). While I appreciate very much Spencer Weart's work, it's nice to have a shorter version and a nice timeline graphic. I'll be using this out in the trenches.
Oh - the graphic! Snort. Thanks, jg.
In the third paragraph of the section "1930s: Hulburt and Callendar", the word "slated" is obviously a mistake. Perhaps the intended word is "slanted"?
This is good! I find myself forgetting some of the historical details, and this is the perfect refresher (the picture graphs alone are good memory aids). Weart's book is great, but if I have limited time, I tend not to check it out unless it is a "need to know" for a reply I'm working on. This article and the graphic timeline will make it so much easier to double-check myself (and certainly replaces my scribbed notes based on the info gleaned from Wearts book). Thank you.
John,
Your jargon is not understandable to me at all. You could as well speak Welsh :)
But the evidence of "weathering lasting just ten thousand [years]" is very much interesting (if you translate it to non-professional English) and hopeful that the geo processes that we need desperately in XXI century can be sped up.
Very nice and to the point.
May I suggest to enrich the text with links to the studies, articles or abstracts?
SkS has most of the needed links right here.
(A special thank you goes to BaerbelW for the german translation)
@ chriskoz - translation is underway!
I'm sure you've heard this before, but I love the name "Mason" for a guy who studies rocks.
Reminds me of back in engineering school when I was doing a project for my failure analysis class, and I was corresponding with a guy via email who was the head of a multinational European research project studying marble cladding on buildings, and in particular why some of the cladding was cracking and falling apart (due to the marble "bending" from non-uniform thermal expansion and contraction through its thickness), and some not. The name of the Danish gentleman in question was, I kid you not, Bent. Bent Grelk. And he insisted that I was the first person to comment on how appropriate that was! Very nice guy.
Coincidentally, his team happened to solve the mystery while I working on the project: Marble varieties with smooth ("granoblastic") grain boundaries would crack due to cycling thermal expansion and contraction, whereas marble varieties with rougher grain boundaries ("xenoblastic") tended to resist grains shifting around and thus didn't crack as easily.
Of course these ramblings have nothing to do with climate history and I wouldn't be offended if they were deleted as off-topic.
This is a great introduction to climate science. Lots of friends and relatives do not have the time or intrest to read a full book on the subject like Weart's "The Discovery of Global Warming" so might I suggest that this article be converted into a PDF for referal.
That's certainly something we are discussing doing. Sending someone a PDF often better guarantees a reading than sending someone a hyperlink.
Neilrieck @ 15, I would point out to those friends and relatives that Weart's interactive html history is divided into subtopics addressed in many bite-sized "essays" (his term) that can easily be read in a single sitting and don't have to be read in any particular order, and the writing is excellent. I find the Weart essays (which I downloaded as PDF's to my e-reader for reading on my daily commutes) to be page-turners, albeit speaking as someone who was already interested in this subject. Still, this post adds something in that, as a comprehensive treatment, it is far more condensed than the entirety of Weart.
I can vouch for the American Institute of Physics (AIP) website for Spencer Weart's essays, especially on the historical aspects of climate science. If I knew how to link it I would. One can "Google" or "Yahoo" it.
Re: hyperlink to Spencer Weart's book:
Ask and ye shall receive.
Last year, while planting a tree, I found a glacial erratic in my back yard. When I called the university they told me the last glaciers receded about 17,000 years ago. I would just like to know what caused that warming.
Any help would be appreciated.
Glacial erratic,
It is common knowledge that the ice ages in the past were caused by variations in the Earth's orbit around the sun. This is called the Milankovitch cycle. I am surprised that you recognize what a glacial erratic is and do not know about ice ages. If you google "ice age causes" you will find lots of information you can use. Perhaps you will want to read the "start here" button so that you are not asking basic questions that everyone else already knows.
GlacialErratic, I agree you should look at the Start Here page, to learn how to quickly and easily find information here on Skeptical Science.
The short answer is that the Earth's orbital changes (Milankovich cycles) cause really, really slow variations in the amount of the Sun's radiation that hits the northern hemisphere. During the parts of the cycles that increase that radiation on the northern hemisphere, the snow and ice melt a bit more, which reduces the amount of radiation being reflected to space, which increases the radiation being absorbed by the ground and water, warming them and in turn warming the atmosphere, which increases the warming of the oceans. The warming oceans hold less CO2, so the CO2 in the atmosphere increases, which leads to even more warming, which melts the ice and snow more, and so on. Details are on a post about Shakun et al.
There is a good series here, about the last interglacial.
Typo alert, "climatologist Hubert Lamb among others, that the uncertainties included a failure to explain previous temperture fluctuations". Temperture?
[DB] Fixed; thanks!
I needed an explaination for the dynamics of the interglacials and found it here. Thanks...
Thank you for the history review. I worked with computer models for many years in the work, that I did for the Federal Government. The one thing that I did learn repeatedly was, that if the models didn't agree with reality, that it was the model that was wrong, not reality. No mention is made of the "pause" in global warming, that the current models failed to predict for the past 15 to 18+ years, while the amount of CO2 in the atmosphere has continued to increase. Even the Remote Sensing Systems website, who regularly works with Dr. Santer to provide accurate satellite based temperature data for his models and papers, has noticed this fact/reality. There is also no mention, that the increase in CO2 always followed the increase in temperature in the geological record, as I understand it. I also believe that even the IPPC has had to reduce its estimate of Global Warming sensitivty for a doubling of CO2 in the atmosphere. I believe that some sceintists now believe it is at 1degree C, or even a little less. This would seem to pose no big threat to the world as we know it, since we may run out of fuel to produce CO2, before we increase the level of CO2 to what some may see as hazardous. Thank you for your time.
[Rob P] - See this SkS post: Climate Models Show Remarkable Agreement with Recent Surface Warming. Climate models aren't omniscient, so once you allow for changes in the solar cycle, natural variability and light-scattering aerosols from volcanic eruptions, the match is quite remarkable.
Don Sage writes:
"The one thing that I did learn repeatedly was, that if the models didn't agree with reality, that it was the model that was wrong, not reality."
This is phrased in such a way that it sounds almost impossible for a rational person to disagree with it... but it ends up meaning very little. Whatever modelling you did for the government, I'm guessing they kept you away from all the difficult problems that involve error and probability.
If the best backgammon computer in the world tells me that I should do a certain move, and I follow its advice, and the other guy rolls a double six to win, is the model wrong?
If the best oncologist in the world uses the world's best cancer model to plot the probability distribution function of my survival from the lung cancer he has just diagnosed, and I get hit my a bus on the way home from the appointment, is the model wrong?
Climate models give us a range of outcomes, and the Earth gives us just one possible run. They're not perfect, but the issue of their reliability is far more complex than your cheap drive-by shot would indicate. As Rob P notes, the match to models is remarkable if correct input is used.
As well as questioning why the"pause" doesn't get a mention in this post on the history of climate science (the RSS website reference @25 is likely this post by Carl Mears that certainly makes no mention of the “warming hiatus” being "15 to 18+ years" long), DAN SAGE @25 talks of two other topics covered elsewhere by SkS - the CO2-lagging-temperature saga and the controversal lowering of the bottom of the IPCC ECS range in AR5 (which does not justify talk of ECS being "now ... 1degree C, or even a little less", an extremely low value range that has long been proposed by contrarians).
Dan Sage @25: "The one thing that I did learn repeatedly was, that if the models didn't agree with reality, that it was the model that was wrong, not reality."
Leto @26: This is phrased in such a way that it sounds almost impossible for a rational person to disagree with it...
Imagine how disappointed Dan Sage is going to be when he buys one of these, and finds he can't actually sit in the cockpit.
"The one thing that I did learn repeatedly was, that if the models didn't agree with reality, that it was the model that was wrong, not reality. "
There is the old saying that all broad, sweeping generalizations are wrong. (Including the one in that old saying...)
Leto has already commented on the phrasing. I'll add the point that Dan Sage's phrasing only is true when you have perfect knowledge of reality. Unfortunately, we never do, which is why Leto makes the comment that (s)he does about error and probability.
Every measurement has errors. I can provide an example of one specific case where a difference between model values and measurements revealed a source of error in the measurements. This had to do with the measurement of diffuse solar radiation. Under very clear skies, some measurements produced values less than that predicted as a minimum using models for Rayleigh Scattering. Rayleight scattering is caused by the molecules of the atmosphere, and no matter how clean the atmosphere is with respect to other scattering particles, you can't stop the molecules from doing Rayleigh Scattering unless you remove the atmosphere entirely.
Were the models wrong? No. The measurements had an offset error related to the infrared radiation flux (a net loss, as the instruments involved emitted more IR than they received from clear skies). Further study of the instrument characteristics revealed the cause of the error and methods to correct for it. The models were right, and the measurements were wrong, because the measurements were not a perfect representation of reality. THe measurement were always a bit low (systematic error).
For further reading on the source of errors in these measurements, a widely-used reference is:
Dan Sage's understanding of models and data seems rather limited, despite his claims to authority as having worked with computer models for many years.
Dan Sage, regarding the wrongly named "pause" in warming, see the most recent post by Kevin Cowtan, and then the post by Matthew England. Regarding models specifically, in addition to the posts that other people have pointed you to, see the post by Roz Pidcock.
For one of many good demonstrations that the recent slowdown (which, importantly, is "slow" only relative to immediately preceding "fast" warming--that's a hint for you) in no way is evidence against the continuing long term trend, see climate statistician Tamino's recent post "Slowdown Skeptic," and "It's the Trend, Stupid," and "Is Earth's Temperature About to Soar?" Regarding trends in satellite data, see Tamino's "Stupid Is As Ted Cruz Does." For an easy to understand picture, see the Skeptical Science escalator.
Your repeat of the myth that increased CO2 always must cause a corresponding increase in temperature, see "CO2 Is Not The Only Driver of Climate," where you should read first the Basic tabbed pane and then the Intermediate one.
You forgot Eunice Foote! She seems to have beaten John Tyndall to the discovery of the infrared absorption bands of greenhouse gasses by a few years:
www.searchanddiscovery.com/documents/2011/70092sorenson/ndx_sorenson.pdf
I suggest adding the contribution of Eunice Foote to climate science. On August 23, 1856, Eunice presented a paper at the Eighth Annual Meeting of the American Association for the Advancement of Science explaining her experiments that demonstrated the effects of the sun on various gases and theorized that those gases could lead to a gradual warming of the earth's atmosphere. She found (surprise, surprise) that, of the gasses she tested, CO2 trapped the most heat. See http://www.smithsonianmag.com/science-nature/lady-scientist-helped-revolutionize-climate-science-didnt-get-credit-180961291/.
[PS] Fixex link
As I am relatively new to this site, I was wondering if you could make it more transparent about the contribution of Eunice Foote, note comments 31 and 32. Sadly as someone interested in the history of climate science I have come across here contribution very late. How about mentioning her specifically in the above story?
keithwlarson - you will like this blog post then.
keithwlarson,
The posts at SkS are written by vounteers. It is unlikely that someone will find the time to go back and edit the OP here. You are welcome to submit an OP that describes Eunice Foote's, and others who may have been previously left out, contributions. It is a simple process to submit an OP.
Make sure that you provide references to support all your claims.
I've finally gotten round to revising this post with details of both Foote and Tyndalk's work, including a few useful links.
Thanks for this update, John.
Yes, many thanks for this important update!
The article states this about Suess and Revelle, but it could well be applied to the question of Foote's influence on Tyndale. In fact, scientific and technical discoveries have an uncanny way of coming to light independantly in the same period of time ... there seems to be kind of fortuitous serendipity to the questions being asked and the inspiration it awakens across nations and peoples.
@39 - very true. That familiar, angular etch-pattern in slices of iron meteorites - the Widmanstatten pattern, was in fact first described a few years before Count Widmanstatten's write up, by a guy called G. Thomson. There are probably dozens of other examples!
Great presentation.
Interestingly, The latest BBC Ideas item in its Sustainable Thinking collection is about the History of Climate Science and includes Eunice Foote.
The video is "Three pioneers who predicted climate change". The video content begins with Eunice, presenting interesting bits of info not mentioned in this OP, and concludes with Keeling. It is less than 5 minutes long (all of the BBC Ideas Sustainable Thinking videos are brief).
There are many other Climate Science related bits in the Sustainable Thinking set of videos. But I would encourage everyone to explore all of the content. Climate Science is only a part of the important understanding needing to be pursued and applied to help develop a Sustainable Improvable future for humanity.
Hello All. This is my first post. Thank you to the people who run this site and everyone who contributes - it's an excellent public service.
I used to be a high school physics and chemistry teacher. I recently posted a video of a table top demonstration that shows CO2 emitting IR at room temperature, without any fancy equipment, just thermometers.
https://www.youtube.com/watch?v=7yK1EZ-RfDg&t=497s
Please view the video and give me feedback, especially on the second part of the video where I explain the role of CO2 in the stratosphere. I want to be sure I got it right.
Tacoma Loren @42,
I didn't spend very long on the experiment bit of your video but did watch through the 'atmosphere' bit. Given the experiment, I was thinking you would be providing a 'safe' explanation of the 'atmosphere' but there are some statements that are fundamentally wrong.
First a minor comment.
I'm not entirely sure that it is true that CO2 is the "primary GHG in the stratosphere." And the escape-altitude doubling if the GHG concentration doubles?
The big issue is that the GHG effect of CO2 is entirely in the upper troposphere not the stratosphere. And the H2O effect is almost all in the lower troposphere.
As your experiment set out, the colder an object, the less IR it emits. At higher altitudes through the troposphere, the temperature drops. But when you get to the stratosphere, the temperature starts rising again. Thus for a frequency of IR which escapes into space from the stratosphere, an increase in the concentrations of the responsible GHG (and thus an increase in the altitude of escape to space) will result in a warmer escape altitude and so more more IR escaping. This will cause global cooling.
It is thus for escape altitudes in the troposphere with its cooling-with-altitude that adding GHGs results in warming.
Now GHGs work across different frequency bands of IR. The CO2 warming results from a band centred on 15 microns. The very centre of that band is saturated all the way into the stratosphere so the IR at that very centre will be cooling with added GHG as the size of that central band escaping from up in the stratosphere increases with increasing CO2. The existence of the stratospheric escape-altitude can be seen as a spike in the centre of the 15 micron absorption band in the graphic below. (There is a similar spike at the centre of the ozone absorption band at 9 microns.)
(As CO2 increases, there are other wavebands that come into play so it is not all a one-way street. Zhong & Haig (2013) might be a useful read as to what happens to the wavebands.)
So I would suggest the main ammendment of the 'altitude' bit of the video would be to replace 'stratosphere' with 'upper troposphere' and 'troposphere' with 'lower troposphere'. And if it doesn't add too much complexity, the "thickness" or "blocking effect" of the GHG is not the mechanism (mentioned near 29:30) but the temperature-with-altitude is. Hope that helps.
An article about the History of Climate Science was recently published in the French Wikipedia, featuring translated versions of jg's neat graphics:
Histoire de la recherche sur le changement climatique
wassup my hairy fairy's, i found this site very useful to gain all the information i ever required (awesome sauce)!! sicko mode!!! #once you go black you never go back!!! Siiickkkk!!!