


 Arguments


Unprecedented trade wind strength is shifting global warming to the oceans, but for how much longer?
Posted on 10 February 2014 by dana1981
Research looking at the effects of Pacific Ocean cycles has been gradually piecing together the puzzle explaining why the rise of global surface temperatures has slowed over the past 10 to 15 years. A new study just published in Nature Climate Change, led by Matthew England at the University of New South Wales, adds yet another piece to the puzzle by examining the influence of Pacific trade winds.
While the rate of surface temperature warming has slowed in recent years, several studies have shown that the warming of the planet as a whole has not. This suggests that the slowed surface warming is not due as much to external factors like decreased solar activity or more pollutants in the atmosphere blocking sunlight, but more due to internal factors shifting the heat into the oceans. In particular, the rate at which the deep oceans have warmed over the past 10 to 15 years is unprecedented in the past half century.
Research led by Masahiro Watanabe of the Japanese Atmosphere and Ocean Research Institute suggests this is mainly due to more efficient transfer of heat to the deep oceans. Consistent with model simulations led by Gerald Meehl, Watanabe finds that we sometimes expect "hiatus decades" to occur, when surface air temperatures don't warm because more heat is transferred to the deep ocean layers. A paper published last year by Yu Kosaka and Shang-Ping Xie from the Scripps Institution of Oceanography found that accounting for the changes in Pacific Ocean surface temperatures allowed their model to reproduce the slowed global surface warming over the past 10 to 15 years. However, the mechanism causing these Pacific Ocean changes has remained elusive.
The new study published by Matthew England's team helps explain how and why more heat is being funneled into the deeper ocean layers. The study indicates that a dramatic acceleration in equatorial trade winds, associated with a negative phase of a cycle called the Interdecadal Pacific Oscillation (IPO) has invigorated the circulation of the Pacific Ocean. This has caused more heat from the surface to be mixed down into deeper ocean layers, while bringing cooler waters to the surface. The combination of these two processes cools global surface temperatures. Like the rate at which heat is accumulating in the deep oceans, the recent strengthening of the trade winds is unprecedented, as the bottom frame in the figure below shows.
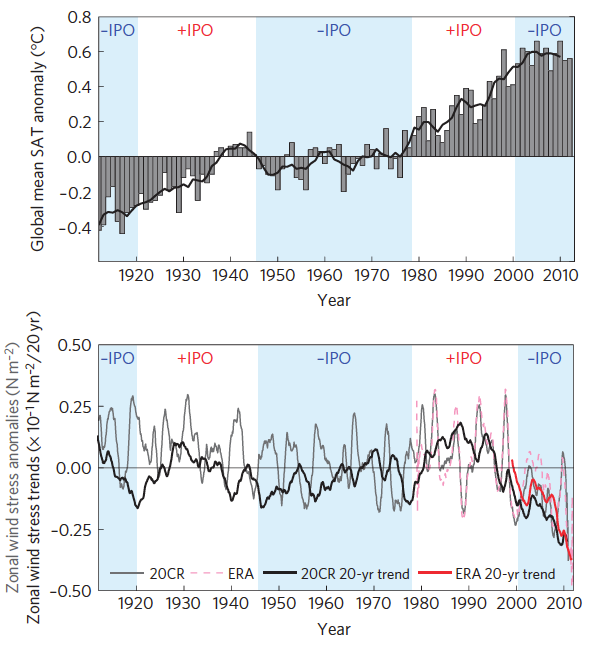
Top frame: Global surface temperature anomalies. Bottom frame: Pacific wind stress anomalies. From England et al. (2014).
Not only is this acceleration of trade winds unprecedented, but it also far exceeds anything captured by climate models. Hence they have difficulty reproducing the recent slowdown in surface warming. The catch is that oscillations eventually change phases, so as England notes, the strengthened trade winds and faster rate of ocean heat accumulation are only temporary.
"the heat uptake is by no means permanent: when the trade wind strength returns to normal - as it inevitably will - our research suggests heat will quickly accumulate in the atmosphere. So global temperatures look set to rise rapidly out of the hiatus, returning to the levels projected within as little as a decade."
The study estimates that by shifting more heat into the oceans, the strengthening trade winds can account for 0.1–0.2°C cooling of surface temperatures over the past 10 to 15 years. This would account for most of the slowed rate of warming, especially when combined with a recent study showing that the global surface warming slowdown is not as large as previously thought. The lead author of that paper, Kevin Cowtan said of this study,
"I think Professor England has uncovered the biggest piece in the puzzle of recent temperature trends"
In the figure below, the England study compares observed surface temperature changes (black) with IPCC model projections (red), and projections made by models that incorporate these changes in trade winds (green and blue). The models including trade winds can reproduce the surface warming slowdown. However, once the IPO cycle shifts and winds return to previous levels, the models see an accelerated warming at the surface, and temperatures start to catch back up to the IPCC model projections.
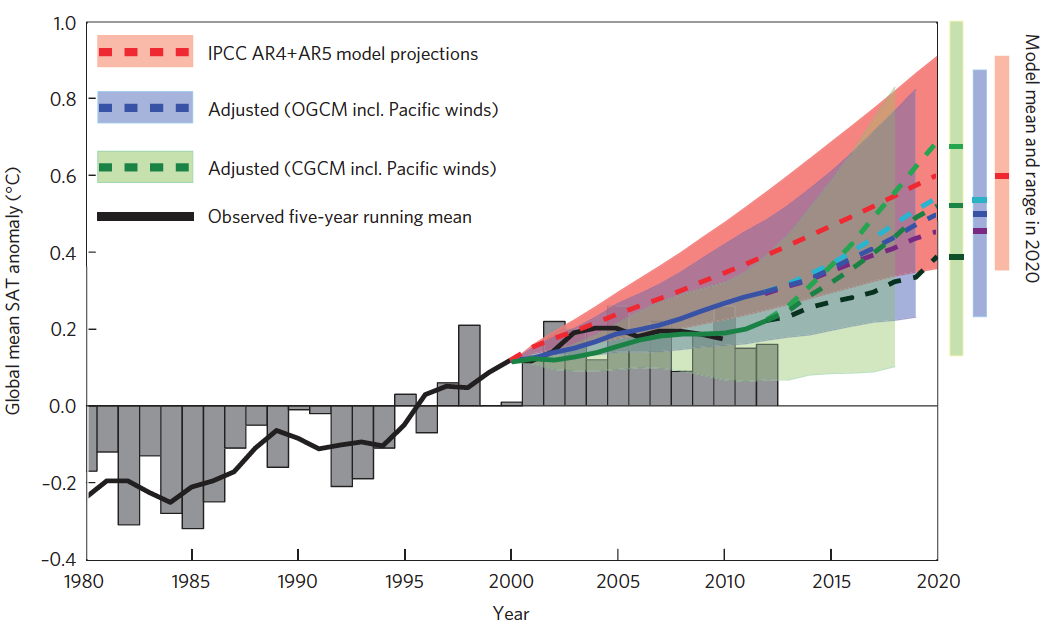
Annual (grey bars) and a five-year running mean (black solid line) global surface temperature measurements. Model projections are shown relative to the year 2000 and combine the CMIP3 and CMIP5 multi-model mean (red dashed line) and range (red shaded envelope). The cyan, blue and purple dashed lines and the blue shading indicate projections adjusted by the trade-wind-induced surface cooling estimated by the ocean model (OGCM), under three scenarios: the recent trend extends until 2020 before stabilizing (purple dashed line); the trend stabilizes in year 2012 (blue dashed line); and the wind trend reverses in 2012 and returns to climatological mean values by 2030 (cyan dashed line). The black, dark green and light green dashed lines are as per the above three scenarios, respectively, only using the trade-wind-induced SAT cooling derived from the full coupled model (CGCM). Shading denotes the multi-model range throughout. From England et al. (2014).
A consistent picture is emerging in the climate research;


As a protonope I find the second figure almost impossible to read. Here's a version with just the CGCM lines:
This same effect could be part of the reason for the rapid warming post 1975. If you run a 30 year rolling linear regression trend on the Church & White tide gauge sea level dataset you find sea level rise peaked ending in about 1965 at a sea level rise rate actually above the trend ending at 2010 (end of the dataset). Yet SAT was stagnent from 1945 to 1975.
You have very sparse data coverage for heat content down to 2000 m during this period (actually pretty much every period up to ARGO), maybe a handfull of measurements per year in the south Pacific during the 60's so you're left with sea level as your best guess at possible heat gain in the deep ocean.
The implication of that possible heat gain in the -IPO between '45 and '65 is that it's subsequent release in the 80's and 90's is some part of the warming of that period, which would mean the warming of this period was certainly not all anthropogenic.
I'm one of those skeptics who believes in an anthropogenic component to warming, but that the projections of future temperature rise have been exaggerated by the models. The information in this post points to a possible reason the models are "tuned" too hot; they have failed to account for the heat "burp" from the ocean in the '80's, and have based the warming in this period solely on radiative forcing and feedbacks to radiative forcing.
Klapper,
Your hypothethesis lacks physical support. Heat does not just rise out of the oceans, coming from nowhere (or undersea volcanos, or hidden heat sinks beneath the waves). It has to get there somehow to begin with.
You seem to be standing reality on its head. The oceans do not periodically warm the earth, as the IPO cycle shifts. Instead, other (physically explicable) mechanisms warm the earth as a whole, and the IPO either "helps" to bury that heat in the oceans, or it doesn't.
The warming you see is entirely anthropogenic. All other physical mechanisms have been negative. The only thing that is natural is the tendency of the system to temporarily obscure heat build up by burying heat in unexpected places (the Arctic, the deep oceans) where it is difficult to observe.
Mind you, to, the models are not in any way "tuned," as you suggest. They replicate physical processes and so generate physically comparable results. In this case, the study points to a detail in the models that may not be well implemented in the physics, and so is not well reflected in the results. The solution is not to "tune" the models colder, but simply to improve / amend the logic which handles this situation in the models -- that is, to make the physics in the models more accurate.
#2 IPO was much smaller in the past. Hence, you do not expect that it explain previous slowdown.
Since climate is cahotic, it is pretty obvious that such slowdown is expected.
Klapper, the primary problem is that you're only looking at one line of evidence. Your idea that the models assume too much warming is only possible if you don't consider other known facts. For example, by measuring incoming and outgoing total radiation (via sattelites) we know that there is currently an imbalance... more energy coming in then going out. Ergo, we know that extra energy is accumulating in the climate system... rather than a fixed amount of energy just moving around (i.e from oceans to atmosphere as you suggest). Similarly, if we calculate the amount of energy that the measured increase in greenhouse gases should cause to be retained we get results in line with the sattelite measurements.
Could decreased accumulation of heat in the oceans have been part of the 80s atmospheric warming? It likely was. However, that doesn't mean the models are showing too much warming... again, we know how much the climate is warming. The tricky part is figuring out where all the extra heat is going to be at any given time. Overall, the flux of heat between the atmosphere and oceans only seems sufficient to drive the warming rate slightly higher (e.g. the 80s and 90s) or slightly lower (the 00s) than the projected trend... averaging out to no change at all.
Not sure that is true. Energy imbalance is measured indirectly via changes in heat content.
BojanD - See the discussion of spectral changes at the top of the atmosphere such as in Harries 2001 and other papers, direct evidence of reductions in Earth IR emissivity leading to an imbalance.
This has been confirmed by the changes in ocean heat content (such as in Balmaseda et al 2013) provide direct evidence for the rate of longer term changes in climate heat content and the level of imbalance, putting more certain numbers to the imbalance, but the total radiation measures while less accurate do provide such evidence.
I hope I'm not the only one having a hard time grasping a key graph in the paper (a full version of which I haven't obtained yet).
Zonal wind stress trends (x10-1 N m-2/20 yr) is not a metric that that leaps intuitively to mind, particularly since the values shown are negative and declining.
To my mind, whilst it is important to keep track of what is currently going on in the climate (as discussed in this post), it is also vital to conclusively resolve the controversy over whether catastrophic climate change would result from burning all of our known reserves of fossil fuels. Basically we need to not get sidetracked into squables about whether we are already seeing an effect from a 40% rise in CO2 when what really matters is that we are on track to increase CO2 levels several fold over comming decades. Hansen has warned that the worst case scenario could be an 8x increase in CO2 and a 20 oC increase in surface temperatures on land. Everything depends on whether Hansen type warnings are verifiable. It is a question as important as whether an asteroid is going to miss or collide with the earth. In my view, the big mistake is to think that peer review is enough for such a gigantic warning. I think the best way to ensure that we get a chance to do the right thing is if there is a second level of scrutiny from a one off investigation with rigorous, formal, "outsider review" and a strict focus on the narrow question of whether burning all known recoverable reserves of fossil fuels would cause catastrophic climate change. I had a go at suggestions for such an "outsider review" process in a blog post: http://directeconomicdemocracy.wordpress.com/2014/02/07/could-this-be-a-way-to-scrutinize-climate-science-enough-for-the-skeptics/
@ CDBunkerson #6:
"...Ergo, we know that extra energy is accumulating..."
I agree with BojanD. We can measure relative changes at TOA, but not absolute not so well. The instruments are precise but not necessarily accurate. Look at Figure 1 in Loeb et al 2012. Note the baseline changes between satellites/instruments measuring these parameters. Obviously we make adjustments to create a smooth continuous record and from that we can track trends but again the absolute numbers are not so clear as you seem to assume.
On the other hand, the Argo network determination of OHC does allow for absolute estimate of energy imbalance (though obviously with error limits) eg see Trenberth 2014.
Klapper,
The absolute numbers are very, very clear, because we are able to fairly accurately measure ocean heat content and other values which represent a gain in energy of the system. Then you divide that by time.
See KR's statement.
Basically, we know there is an imbalance at TOA, and the earth is accumulating energy, but due to the difficulty of precise measurements it is difficult to use that method to determine "how much".
But we can measure the temperature of the ocean, atmosphere and land, and the volume of ice that is permanently melting, and from that compute the change in heat content over the span of years. That tells us very accurately how much heat the planet is gaining over time (look at the widget in the upper right corner of the page).
There is no doubt here, and it is not assumptions, it is reliable measurements with well-defined and understood error bars. The earth climate system is gaining heat at an alarming rate. That is an incontrovertible fact. GHG theory predicts exactly such an accumulation of heat. All natural sources of warming are currently negative (i.e. point to cooling) and so cannot be contributing.
The end result is that all warming (not some, not most, all) must be due to anthropogenic sources. The only argument we can have is one of land use versus greenhouse gases.
There is no magical heat source in the oceans that is confusing the issue.
@Dana: What is your working definition of "deep ocean"?
@Klapper, exactly my point and it was very explicitly stated by Gavin.
It would be very interesting to read an article showing which values in Trenberth's famous energy flow chart are directly measured and which ones are inferred, like energy imbalance.
John H @14 - deep ocean is usually defined as below 700m (that's the definition I use).
Magma: "Zonal wind stress trends (x10-1 N m-2/20 yr) is not a metric that that leaps intuitively to mind"
No, I'm sure it isn't, and I'm sure you're not the only one. If you don't make a living measuring turbulent energy transfer in the atmosphere, you're probably used to thinking of wind in terms of speed. Speed, however, is not a good indicator of the energy in the wind, due to several factors:
As a result, it is customary to express the effects of wind in terms of shear stress, which is a property that is roughly conserved over small vertical distances. For wind, the force exerted on the surface in a horizontal direction is a shear stress - a force that is trying to drag the earth in a horizontal direction. (Conversely, you can think of the earth as exerting a drag on the wind.) The lowest layer of the atmosphere is also subject to a shear stress from the moving air above it, and so on for each increase in height. Thus shear stress is a good indicator of the effects of wind. THe shear force, created by the circulation that makes the wind blow, is transferred downward to the surface through the lower atmosphere.
As analogy, think of a block sitting on the ground, with a rope attached. The weight of the block exerts a downward force, which is measured in Newtons (N). This downward force translates to a horizontal force, via friction - when we try to drag the block with the rope. The horizontal force is {weight X coefficient of friction}, but we need to account for the area of the block, too, so the term we really want is weight per unit area, or N/m2. This is the shear stress between the block and the ground (when we pull it), and the wind's shear stress has exactly the same effect.
So that explains the units. As for the negative sign: I suspect, but I am not sure (and the full article doesn't help)that the reason is as follows. One custom in measuring turbulent atmospheric motion is to make all fluxes directed away from the surface to be positive. Examples of such that make sense are thermal energy transfer (within the turbulently-mixed air) and the movement of water vapour away from the surface (AKA evaporation). For shear stress (also known as "momentum transfer"), the actual direction is from the top down: the air is dragging on the earth and transferring momentum from the atmosphere to the surface. So, being downward-directed, it ends up with a negative sign, and more negative means stronger forces.
As a last tangent, although pressure is also "force per unit area" and for pressure the units of N/m2 become Pascals (Pa), it is not correct to change the units of shear stress to Pa. Pressure is a non-directional force, whereas shear stress has a direction. Thus, the habit is to use N/m2.
Hope that helps.
BojanD - what is the your problem with the OHC method of estimating TOA? Seems a pretty good way to do it to me.
Also, when you are talking about the global energy fluxs (which have to take into account both temporal and spatial sampling issues), the line between direct measurement and inferrred is somewhat blurred. However, for all the detail, the place to start is the Trenberth 2009 paper from which the diagram is drawn.
KR #8:
BojanD and Klapper have a point regarding direct measurements of the TOA radiation – they are not accurate enough to tell us about the global energy balance, as Gavin states here.
The only direct evidence for a positive energy imbalance is the increase of the heat content in the climate system, most notably in the oceans. (and that has been significant!)
Figure 2 in your link (change in spectrum from 1970 to 1996) proves that the greenhouse effect has in fact increased, but it covers far from all of the Earth’s OLR.
A blackbody calculator reveals that the radiation in the range from 700 cm-1 to 1400 cm-1 only constitutes about 37% of all radiation from a body at 255 K (Earth’s temperature as "seen" from space). In theory, increased OLR on other frequencies could have offset the decrease in the range shown here.
BTW, I don’t like the unit on the Y-axis (brightness temperature) because it exaggerates the impact of methane vs. CO2. The spectral radiance (W/m²/cm-1) at 255 K is over 4 times higher at 700 cm-1 than at 1300 cm-1, so a 1 K change in brightness temperature counts much more in the CO2 part of the spectrum than in the methane part.
Klapper #2:
If the surface warming from the late 1970's to about 2000 was mostly caused by release of ocean heat trapped between 1940 and 1970, then the global surface temperature would have changed more or less like the blue curve here.
If there really was more heat accumulation in the oceans between 1940 and 1970, something else must have prevented the surface temperature from dropping during that period, just like something has prevented the surface temperature from dropping in the 2000's despite record high heat accumulation in the oceans in recent years.
That "something" is certainly not the sun, which had its highest recorded activity more than 50 years ago
Why are the trade winds getting stronger? Is this itself a response to warming? Does this amount to a (temporary) negative feedback? What might reverse it?
I have a feeling that there are all sorts of other important mechanisms (existent and potential) of circulation in air and ocean that we still have little to no clue about.
@ HK #20:
"if the surface warming from the late 1970's to about 2000 was mostly caused by release of ocean heat..."
Firstly, I didn't say "mostly" in my post, I said "some part". Secondly, I disagree the sun peaked 50 years ago (mid 1960's). That's nowhere close to the truth for some parameters.
The sun's magnetic activity is closely related to the length of the sunspot cycle. The shortest cycle since 1840 is the <10 year one ending in 1996. Plot up the aa-index and you will see it peaked at an all time record year in 2003. More important the successive 11 year peaks and valleys both climbed steadily from 1900 to 1992 or so, when the valley's started to decline (although the peaks kept climbing).
Since the 2003 peak there has been a sharp decline but clearly the upward trend continued for this solar parameter into the 21st century.
wili@21,
That's an interesting question I presume no one has answered yet.
Mike Mann has an interesting op-ed where, in the context of England et al. 2014, he recalls Paul Handler mid-80s research and also his own research about volcanoes and ENSO correlation. Mike's hypothesis is that oceans act as "thermostat" in a sense that negative feedback of LaNina kicks in response to positive forcing (e.g. GHE), or ElNino in response to negative forcing (volcanoes). So, our ever-warming world could lead to a semi-permanent LaNina state. But not a word about physical mechanisms leading to it, let alone quantify the supposed negative ocean feedback.
Klapper, for the parameter that matters - the energy we get from the sun - I dont such a peak. Can you reconcile your statement with the data presented in this paper please?
wili,
i speculated the same thing, that the fact the trade winds are so anomalously strong, that it might be related to AGW and act as some sort of "negative feedback" even though the surface and oceans still warm. the big question is what is causing the switch from negative to postitive PDO indices? i don't think anyone has a clue.
As far as I know, PDO may be little more than average from several superimposed processes each of which is more or less understood. I dont think there is a "switch" - just reflecting the chaotic processes underlying ENSO. Part of the heat redistribution engine. See for instance here and here.
There is much concerned spluttering in denierdom. "We were told in 2006 that the Pacific winds were slowing", citing Vecchi 2006.
Bob Loblaw @17
A great explanation; I too had no clue about the wind stuff, but here's a nitpick in the interest of basic physics purity: The friction for a sliding dry block isn't dependent on surface area.
@ scaddenp #26:
Here's a quote from the link you posted (Svalgaard 2013).
"It should be clear that there is no consensus and that the question mark in the title of the present paper is fully justified: we do not know what the variation of solar activity has been even over the most recent 170 years, let alone in centuries and millennia past. It is somewhat of a travesty that we cannot provide the climate research community with that fundamental piece of input to their debate."
The aa-index is what it is. Whatever proxies you use to reconstruct the magnetic activity of the sun, here down on earth the actual measurements show a steady increase to at least the very end of the 20th century. Perhaps there are complications of how the solar wind and magnetic activity interact. I don't know, but certainly there is room to speculate that indirect solar effects need not have peaked 50 years ago, particularly in light of Svalgaard's quote above.
Klapper #22:
None of the graphs in Svalgaard’s paper support the idea that solar activity is responsible for any of the recent global warming (last 30-40 years), not even Shapiro’s controversial TSI reconstruction in the right panel of figure 5. (read why it’s controversial and probably wrong here)
I didn’t say the sun peaked 50 years ago, but “more than 50 years ago”. Maybe I should have been more precise and said 1958, as these graphs show:
Anyway, the fingerprints of the recent warming don’t fit the “it’s the sun” claim. For instance, more warming in winter than summer in the Arctic is the opposite of what the sun is expected to do.
So I’m pretty sure that the sun has no responsibility for the recent warming, although it probably played a role before 1960.
mgardner @29: You are correct that the friction force in the block example is independent of area (for first order effects). However, the reason the area was (correctly) brought into the discussion by BobLoblaw is that the goal was to express the horizontal force on a per-unit-area basis. (i.e. as a shear stress). Stress is force per unit area.
Does the paper entitled "Slowdown of the Walker circulation driven by tropical Indo-Pacific warming" by Tokinaga, et al, 2012, contradict the report referenced in your post? Help a biologist out!
The abstract for the paper can be found here.
ianw01@32
I said I thought it was a great explanation, but I can elaborate on how it might be improved if you insist. Note that Bob was using the term shear "force" not "stress" of the wind when he introduced the block, and the transition to F/A was not overtly related back to the "stress" usage for wind. To my mind, the transitional sentence could be interpreted either way. Is it worth arguing about?
So perhaps we should push ahead with sail assisted ships pushed around the world by these enhanced trade winds. They weren't called trade winds for nothing.
mgardner@34: No, not worth further debate. I think we both know what's going on here, and probably either of us could edit Bob's post for dimensional correctness. As I'm sure he could too. :-)
Isn't the engine for the trade winds the Hadley circulation, and the engine for that circulation is the heat pumped into the air by water changing phase (raining) at the equator? As water vapor increases with global warming, shouldn't this circulation become enhanced, and thus the trade winds enhanced as well? If so, the trade-wind shear-stress induced vertical ocean circulation (La Nina) may be a 'helpful' negative feedback in the next few decades. Helpful with climate consequences, though not with sea level rise.
I am well aware of Svalgaard's opinions - he is a true skeptic as opposed to someone who is only skeptical of views opposed to their preconceptions - but my point is that none of the actual data supports solar involvement in recent warning. You seem to pinning hopes on some possible unknown rather than heeding the warnings from what is known from actual physics and measurement. It seems to me that your views on AGW are biased by an a priori position rather than informed by published science.
AFAIK the el nino southern oscillation has been made responsible for the low temperatures especially in 2008 and 2012, which contribute most to the impression of some warming pause. (Foster and Rahmstorf).
It is unclear to me - and may be to others - in what relation the trade wind strengthening stand to ENSO. Both phenomena operate on the same theatre with the water body of the pacific ocean beeing shoveled over in this or the other direction.
Does anybody can give a clarification or a link to one?
dlen - trade winds and ENSO are deeply intertwined. Try this recent review article for more detail. Wang et al 2012.
There is always the possibility, one that no one seems to want to explore, that for the absolute possible amount of AGW that can be produced the ocean is for all intents and purposes an infinite heat sink.
Muzz... What makes you think that no one has considered this idea?
Muzz, ocean models are bound by laws of thermodynamics. You need to dream up some physically reasonable mechanism for dragging more heat deeper, faster than has been observed so far. Estimates for very deep heating (below 2000m) is constrained by steric sealevel rise. I would regard this is clutching at straws. People dont tend to explore physically unreasonsonable propositions especially when physically reasonable models are working okay.
It was once considered that the ocean uptake of CO2 might be able to keep atmospheric concentrations safe, but that idea was shown to be wrong many decades ago.
It might help, also, to put the depth of the oceans into perspective.
The distance across the Pacific is ~6000 miles (9650 km). That is 9,650,000 meters, and the average ocean depth is ~4500 meters. In rough numbers, the Pacific ocean is about 2200X as wide as it is deep.
The thickness of a standard piece of paper is 0.1mm, and it's about 216mm wide. Interestingly, that's about 2100X as wide as thick.
So, while the oceans are very large bodies of water, relative to the full scale of the surface of the Earth, they are proportionately fairly thin.
@ HK #31:
@ Scaddenp #38:
You're fairly sure that solar peaked in the late '50s. However, here's what Lockwood & Frohlich 2007 said about solar activity in the 20th century: "Hence, all solar trends since 1987 have been in the opposite direction to those seen or inferred in the majority of the twentieth century—particularly in the first half of that century". They don't argue that solar peaked in the late '50s. To be sure they are adament that solar could not have had an effect after 1985. I agree except I would extend that date to the mid '90s based on the aa index.
Note the shortest length solar cycle (22 from '86 to '96) is also the most intense from the aa index, which is an indication that things weren't quite over by '85 as Lockwood asserts.
Here's another point: say hypothetically I accept the Lockwood argument that solar rose through the first half of the 20th century, then plateaued until say the mid '80s and then declined. Since climate doesn't equilibriate immediately to changes in forcing is it not possible that this sustained high level of solar activity was responsible for onging climate change through the '80s and into the '90s? And wouldn't that be true even if the actual peak was in 1958 as you assert?
[TD] The lag between solar forcing and temperature response is not that long. And the moment the solar forcing flattened, the energy imbalance must start to decrease, which has not happened. See the post "Climate Time Lag," and please comment there if you want to discuss that topic more.
@ terranova & @ jsam both these papers you reference look at the evaporation near Indonesia. This process is slowing due to increased evaporation from global warming. The increased trade winds have been caused by the onset of the IPO. I might be a little off, it's just what I have noted from all these denier blogs.
Wouldn't you have to almost completely igonore the vertical temperature profile, as well as the relative level of radiative forcing to consider solar to be the major responsible forcing?
More from Lockwood:
Lockwood 2008: "It is shown that the contribution of solar variability to the temperature trend since 1987 is small and downward; the best estimate is -1.3% and the 2? confidence level sets the uncertainty range of -0.7 to -1.9%." http://rspa.royalsocietypublishing.org/content/464/2094/1387.abstract
Lockwood 2008: "The conclusions of our previous paper, that solar forcing has declined over the past 20 years while surface air temperatures have continued to rise, are shown to apply for the full range of potential time constants for the climate response to the variations in the solar forcings." http://rspa.royalsocietypublishing.org/content/464/2094/1367.abstract
Lockwood 2007: "The observed rapid rise in global mean temperatures seen after 1985 cannot be ascribed to solar variability, whichever of the mechanism is invoked and no matter how much the solar variation is amplified." http://www.warwickhughes.com/agri/lockwood2007.pdf
Klapper:
What about the fingerprints of the recent global warming?
6 of the 13 fingerprints listed here are incompatible with a warming sun, 2 are neutral and 5 are related to the source of the extra CO2.
That and comment 48 by DSL should be the end of the argument It’s the sun.
Any further discussion about this topic probably belongs to that thread and not here.
Given that the deniers are pointing to two papers about the Walker circulation.
See jsam and Terranova above.
It would be useful if someone clarified the difference between what is researched/described in those papers as opposed to what is looked at Matthew England et al.