Climate Science Glossary

Term Lookup

Enter a term in the search box to find its definition.

Settings

Use the controls in the far right panel to increase or decrease the number of terms automatically displayed (or to completely turn that feature off).

Term Lookup

Settings


All IPCC definitions taken from Climate Change 2007: The Physical Science Basis. Working Group I Contribution to the Fourth Assessment Report of the Intergovernmental Panel on Climate Change, Annex I, Glossary, pp. 941-954. Cambridge University Press.

Home Arguments Software Resources Comments The Consensus Project Translations About Support

Twitter Facebook YouTube Mastodon MeWe

RSS Posts RSS Comments Email Subscribe


Climate's changed before
It's the sun
It's not bad
There is no consensus
It's cooling
Models are unreliable
Temp record is unreliable
Animals and plants can adapt
It hasn't warmed since 1998
Antarctica is gaining ice
View All Arguments...


Username
Password
New? Register here
Forgot your password?

Latest Posts

Archives

Shapiro et al. – a New Solar Reconstruction

Posted on 21 May 2011 by dana1981

The journal Astronomy & Astrophysics is publishing dueling total solar irradiance (TSI) reconstructions.  We recently examined the 'solar hockey stick', a physics-based reconstruction by Vieira et al. (Figure 1).

3000 year TSI

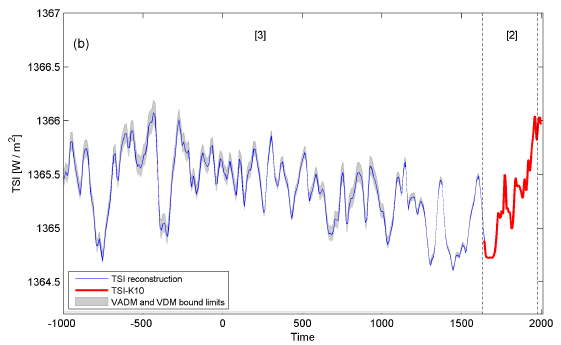
Figure 1: Vieira TSI reconstruction over the past 3,000 years

And in April, the journal published the reconstruction of Shapiro et al.  The authors of the latter study note the significant difference between their results and previous TSI reconstructions:

"We obtained a large historical solar forcing between the Maunder minimum and the present, as well as a significant increase in solar irradiance in the first half of the twentieth-century. Our value of the historical solar forcing is remarkably larger than other estimations published in the recent literature."

For those interested in the details, Shapiro et al. describe their methods as follows.

"We assume that the minimum state of the quiet Sun in time corresponds to the observed quietest area on the present Sun.  Then we use available long-term proxies of the solar activity, which are 10Be isotope concentrations in ice cores and 22-year smoothed neutron monitor data, to interpolate between the present quiet Sun and the minimum state of the quiet Sun. This determines the longterm trend in the solar variability which is then superposed with the 11-year activity cycle calculated from the sunspot number. The time-dependent solar spectral irradiance from about 7000 BC to the present is then derived using a state-of-the-art radiation code."

Figures 2 and 3 show their results from 500 BC and 1600 AD to present, respectively.

Shapiro 500

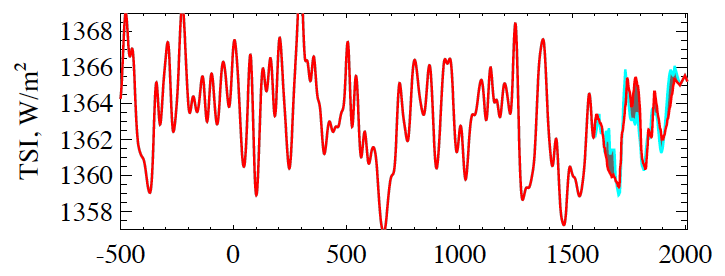
Figure 2: Shapiro et al. TSI reconstruction from 500 BC to Present

Shapiro 1600

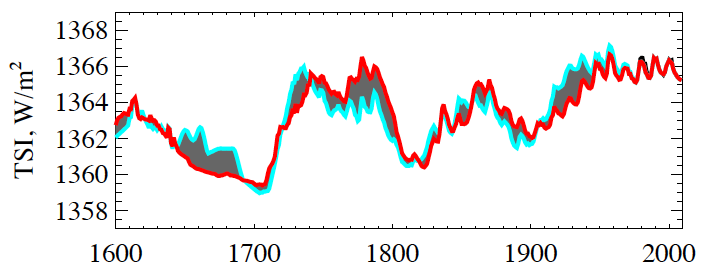
Figure 3: Shapiro et al. TSI reconstruction from 1600 AD to Present

I thought it would be an interesting exercise to evaluate the plausibility of these two reconstructions from a climatic standpoint.

Quantifying Solar Warming

The solar radiative forcing is the change in total solar irradiance (TSI) in Watts per square meter (W/m2) divided by 4 to account for spherical geometry, and multiplied by 0.7 to account for planetary albedo (Meehl 2002).  The albedo factor is due to the fact that the planet reflects approximately 30% of the incoming solar radiation.  As with CO2, we calculate the equilibrium temperature change by multiplying the radiative forcing by the climate sensitivity parameter (λ).

Vieira vs. Shapiro

There are three relatively recent periods during which both reconstructions agree TSI changed substantially.  From 1500 to 1600 AD, Vieira and Shapiro find that TSI increased approximately 0.75 and 4.5 W/m2, respectively.  From 1600 to 1700 AD, they both decreased by approximately the same amount.  And from 1700 to 1800 AD, the Vieira reconstruction once again increased by approximately 0.75 W/m2, while the Shapiro reconstruction increased by approximately 6 W/m2, and remained sustained at this high level for several decades. 

We can use these figures to calculate two things: given the IPCC expected climate sensitivity, how much warming should each change in TSI have caused, and if the actual temperature changes during these periods were mainly due to TSI changes, what does that tell us about climate sensitivity?

Expected Temperature Change

The IPCC most likely values for transient and equilibrium climate sensitivity are 2 and 3°C for doubled CO2 (3.7 W/m2).  For our purposes we'll assume the sensitivity to CO2 and solar activity are similar, which is a reasonable assumption.  Thus the climate sensitivity parameters are 0.54 and 0.81°C/[W/m2], respectively.

For the Vieira reconstruction, the 0.75 W/m2 change in TSI would be expected to cause 0.07 to 0.11°C change in average global surface temperatures.  For the Shapiro reconstruction, the 4.5 to 6 W/m2 changes in TSI would be expected to cause 0.38 to 0.85°C temperature changes.  A marked difference between the two.  So how do they compare to reconstructed temperature changes?


Figure 4: Ljungqvist (2010) 30-90°N decadal averages (black) vs. HadCRUT land-ocean 30-90°N decadal averages (red).   Courtesy of Robert Way.

Figure 4 provides the Ljungqvist reconstruction of northern hemisphere land temperatures.  Bear in mind that because temperatures change faster over land than oceans, and the northern hemisphere has more land area than the southern hemisphere, this reconstruction exhibits larger temperature changes than the planet as a whole by a factor of approximately two.

So, from 1500 to 1600, the Ljunqvist temperature reconstruction warmed approximately 0.2°C, from 1600 to 1700 cooled approximately 0.3°C, and from 1700 to 1800 warmed approximately 0.4°C.  If we assume all other forcings over this 300 year period averaged out to approximately zero, the average global surface temperature change over each century is roughly 0.15°C - not far from the change expected from the Vieira reconstruction, but far less than expected from the Shapiro reconstruction.  This tells us that if Shapiro et al. are correct, the climate sensitivity must be substantially lower than the IPCC most likely value.

Sensitivity Estimates

In the Vieira case, if a 0.75 W/m2 TSI change is causing a 0.15°C global surface temperature change, the climate sensitivity parameter is approximately 1.14°C/[W/m2], which corresponds to approximately 4°C for doubled CO2 - towards the high end of the IPCC range of possible values.

In the Shapiro case, if a 5 W/m2 TSI change is causing a 0.15°C temperature change, the sensitivity parameter is 0.17°C/[W/m2], which corresponds to approximately 0.6°C for doubled CO2.  This is well below the IPCC range of possible values, and even low by "skeptic" standards like Lindzen and Spencer.  A climate sensitivity this low contradicts the many lines of evidence supporting the IPCC range, and would make large past climate changes (i.e. transitions between glacial and interglacial periods) extremely hard to explain.

What About Recent Warming?

Another important consideration in evaluating the plausibility of these two reconstructions is the fact that both show approximately no change in TSI since 1950.  Yet we know that global temperatures rose approximately 0.55°C since 1975, after a period of slight cooling between 1945 and 1975. Solar activity has clearly had a negligible if any contribution to the warming over recent decades, and this magnitude of warming is well outside the range of internal variability.

According to the Shapiro reconstruction, TSI increased approximately 4 W/m2 in the early 20th Century, which is less than it increased from 1500 to 1600 AD, during which time the average surface temperature increased only 0.15°C.  If climate sensitivity is as low as their reconstruction requires, then the anthropogenic radiative forcing over the past 150 years (1.6 W/m2) would have caused less than 0.25°C warming.  Thus their reconstruction and low climate sensitivity can only account for less than half of the observed 0.8°C surface warming over the past century, and only one quarter of the warming over the past 40 years.

Who's Right?

The calculations done here are rough back-of-the-envelope style approximations.  The non-solar radiative forcing wasn't exactly zero from 1500 to 1800 AD, for example.  Nevertheless, even with these rough calculations, we see that while the Vieira TSI reconstruction is plausible, the Shapiro reconstruction does not match up well with observed and reconstructed temperature changes.  It's also worth noting that if the solar radiative forcing were consistently as large as Shapiro et al. suggest, TSI would correlate much better with global temperature than it actually does. 

The Shapiro reconstruction may seem appealing to those of us who want to believe that the Sun plays a dominant role in climate changes, or that climate sensitivity is low.  But the requied low sensitivity for their study to be correct fails to explain the global warming over the past century, and especially over the past 40 years.  In other words, it increasingly diverges from reality.  It's important to remember that  as the authors note, the Shapiro TSI reconstruction is an outlier.  Newer isn't always better, and although they present an interesting alternative result, it simply doesn't seem to gel with other observational data.

0 0

Printable Version  |  Link to this page

Comments

Comments 1 to 34:

  1. Hi Dana, Thanks for your post. It's instructive to cross check findings with the bulk of the available data. When you say, for example, 0.75 W/m2 more TSI would lead to a hypothetical calculated 0.15ºC warming, are feedbacks already counted in? Wouldn't those first 0.75 W/m2 of solar forcing lead to other feedbacks, which would in turn result into a larger total radiative forcing? Please help me understand this.
    0 0
  2. Alexandre - yes, in calculating the expected temperature change, I incorporate the climate sensitivity, which is based on feedbacks. So feedbacks are accounted for in these calculations.
    0 0
  3. Hey Dana, good post. Quick question: in the Shapiro TSI graphs, what do the blue and red trends respectively signify?
    0 0
  4. I believe they're based on two different Berrylium-10 proxy data sets, Alex.
    0 0
  5. dana #1981 Would you venture a guess at the TSI value which would keep the Earth in equilibrium - neither gaining or losing heat? Assume we are in pre-industrial times with a CO2 concentration of about 280ppmv.
    0 0
  6. Ken, your question doesn't really make sense. The Earth will be in equilibrium if the net forcing is zero. Thus the TSI value to keep it in equilibrium depends on all other forcings.
    0 0
  7. It is very obvious from the literature that TSI and past temps do not correspond well. To use temperature as a metric to put the results of this paper in question has very little validity.
    0 0
    Response:

    [dana1981] Yes because we know the sun has no impact on global temperatures...

  8. Dana1981: There is a lot more to the sun than TSI. We both know that....or at least I would hope that you know that. We have just ended the longest solar max in recent times. Since the ending of that solar max in approx 2003, the upper atmosphere has shrunk to the smallest size ever recorded. That is just one effect. http://www.space.com/8770-record-collapse-earth-upper-atmosphere-puzzles-scientists.html
    0 0
  9. And then there is this recent research, which demonstrates an effect on low clouds, which is a HUGE driver of climate. http://www.atmos-chem-phys.net/10/10941/2010/acp-10-10941-2010.pdf
    0 0
  10. Camburn you didn't read the paper, did you? From the conclusions: "This work has demonstrated the presence of a small but statistically significant influence of GCRs on Earth’s atmosphere over mid-latitude regions." Where is the huge driver of climate?
    0 0
  11. To be fair, I think Camburn is suggesting that low clouds are a huge driver of climate (which is untrue - they are a potentially significant feedback, but not a driver). I don't think he's suggesting that GCRs are a huge driver of climate. At least I hope not, since the scientific literature strongly indicates otherwise, and the paper he references likewise discusses "little ( 0.088 C/decade) systematic change in temperature at mid-latitudes has occurred over the last 50 years."
    0 0
  12. No, I am not suggesting the GCR are a huge driver of climate. I was trying to show that TSI is not the only item that the sun provides or shields that affects climate. As far as low clouds, there is question as to whether they are a driver or feedback. This has to do with OHT etc.
    0 0
  13. Dana @11, Good points. But, is this thread not about TSI. IIRC, there is no firm relationship between TSI and GCRs. But please correct me if I am wrong about that. Riccardo @10, INdeed. What is more, they found evidence of a possible weak relationship over the mid-latitudes, that does not speak to or explain recent from increasing GHG concentrations.
    0 0
    Response:

    [dana1981] Well, TSI and GCRs are reasonably well correlated, but you're right that it's off topic here.  I think Camburn is trying to look for some other solar effect to blame recent warming on, but at least he's not trying to blame it on TSI.

  14. Camburn, Your comments do not appear to have anything to do with Dana's posts about reconstructions of TSI. If you want to talk about GCR's or clouds then please go to the appropriate threads.
    0 0
  15. Actually, if we look at Figure #2, there is a reasonable correlation between TSI & Climate between 600AD & 1600AD. From around 600AD to around 1300AD, we see TSI sitting around the 1365-1368 W/Square meter range. Then from around 1500AD to almost 1900AD, it bobs around the 1358-1364 W/Square meter range. So the higher TSI correlates well to the Medieval Warm Period, whilst the lower TSI's correlates well to the Little Ice Age. Now of course these are only *proxies*, so I don't expect to see *perfect* correlations. Also, we *know* other factors were involved in both these Climatic Events (principally volcanic activity). So I really don't see where Camburn is coming from. Also, though, the Shapiro reconstruction shows quite clearly that, though temperatures today are currently *warmer* than at the height of the Medieval Warm Period, TSI is currently *lower* than the average for that time period. Kind of goes a long way towards ruling out the Sun as the cause of current warming, wouldn't you say?
    0 0
  16. dana1981 #6 "Ken, your question doesn't really make sense. The Earth will be in equilibrium if the net forcing is zero. Thus the TSI value to keep it in equilibrium depends on all other forcings." If we go back to pre-industrial tmes, all the AG forcings from IPCC AR4 disappear. We are left with climate responses only - S-B Radiative feedback and Water Vapour & Ice Albedo feedbacks. Aside from the occasional big volcano, the variation in TSI is the only 'external' forcing. There must be a theoretical magnitude of TSI which produces an equilibrium ie. above it and the Earth warms -below it and the Earth cools in the absence of all AG forcings.
    0 0
    Moderator Response: [Dikran Marsupial] The reason that the forcings in AR4 dissapear prior in pre-industrial times is because forcings are defined as changes from pre-industrial (1750) values. Note also that the climate system has a 'momentum', which means that true equilibrium cannot be reached. For a very approximate answer, you could try some simple climate models (such as those in the first few chapters Pierrehumbert's book on planetary climate). Or perhaps average the TSI reconstructions for interglacials (but bear in mind the error bars).
  17. Dana1981 I congratulate the "revolutionary vigilance" But I hope to talk about SSI and SIM ... Courage ... But it is worth to read my reference - I recommend. Best regards, Yours faithfully A. Semczyszak
    0 0
  18. Ken, no TSI is not the only long term pre-industrial temperature forcing. The same TSI can have different impacts depending on orbital tilt of the planet... the northern and southern hemisphere have different albedos and different climate feedback cycles. This can be seen in the ~100,000 year glaciation cycle... which is driven by orbital forcing. Fluctuations in TSI forcing over the same time frame are miniscule in comparison. Thus, as Dana indicated, any answer to your question would require definition of the other forcings present. Currently the orbital forcing is producing a slow cooling trend. Thus, without enhanced GHG warming the TSI required to tip the planet into a warming trend would be very high... short term oscillations might occasionally spike high enough, but the long term TSI trend is nowhere close.
    0 0
  19. I hate to jump to Ken's defense, but I think his question deserves an answer (although it's accompanied by that low, dramatic, foreboding background music that implies that it's the lead in to some sort of pending "gotcha" argument). But all he's basically saying is, given the state of climate variables set prior to industrial times (and I'm assuming that this includes the global mean temp at that time), what TSI would have held the planet in that climate state (barring a new forcing)? Alternately, the same question (and perhaps it's what he meant, it's unclear) could be applied to pre-industrial forcing/feedback variable settings, but current temperatures, although that's sort of a not-possible condition, since the increased temps would continue to change the feedbacks, so there isn't any set single "TSI" setting would not hold the system in equilibrium, because the "feedback forcings" would continue to change. Instead, you'd need a projection of changing TSI values needed to continually counteract the feedbacks and hold the temperature at present levels while the feedbacks stabilize -- which is a totally artificial situation with no application to the real world.
    0 0
  20. Re my #19 comment, it's also probably not a fair question, in that computing the answer might be a fairly complex exercise. Ken might want to try to derive the answer himself before asking it of others.
    0 0
  21. Not sure I understand what Ken is asking. He wrote "There must be a theoretical magnitude of TSI which produces an equilibrium ie. above it and the Earth warms -below it and the Earth cools in the absence of all AG forcings. " From this sentence it appears that he's changing cause and effect. I mean, given the magnitude of the TSI (and the other parameters, of course), you can calculate the equilibrium temperature. Doing it the other way around, as Ken is apparently asking, means to give the equilibrium temperature and then calculate the TSI. Am I right Ken?
    0 0
  22. The thing is, there's no answer to Ken's question. A change in temperature is caused by a change in forcing (for the solar forcing, that's a change in TSI). So assuming all other forcings were zero, you could get equilibrium for any unchanging TSI value, as long as you give the system enough time to reach that equilibrium. Now if you want to calculate equilibrium at a specific given temperature, that's a different story, as Riccardo notes.
    0 0
  23. Sphaerica, even if we make a lengthy list of assumptions which Ken didn't specify (e.g. no change in aerosol particulates, no ozone deterioration, no 'land use' changes, et cetera) there is still no single answer. The TSI needed to maintain any specific 'climate state' (and note that the 'climate state' at the start of the industrial revolution was something called 'the Little Ice Age') would be constantly increasing for thousands of years as the cooling from the orbital forcing grew greater. So, in short, no Ken's question cannot be answered... because it is founded on his false belief that "the variation in TSI is the only 'external' forcing". Given the existence of other forcings, which are changing over time, it is completely impossible to cite a single TSI value which would maintain a stable climate on an ongoing basis. He is looking for a fixed TSI value which keeps the climate stable and no such number exists.
    0 0
  24. CBD #18 #23 You are right about orbital tilt cycles being another 'natural' forcing - however these are on 90,000 - 110,000 year time scales. I was talking about the period since AD1750, which forcings appear in Fig 2.4 of AR4. Going back to AD1750 when fossil fuelled industrialization began - the only radiative forcing is Solar irradiance. A couple of factors need to be held constant - the Earth's albedo and the WV & Ice Albedo feedbacks - but since these are at pre-industrial 'natural' levels and not influenced by human released GHG - the assumption seems reasonable.
    0 0
  25. Sphaerica, Riccardo Thank you Sphaerica for your generous defence. I am simply saying that the Earth has a natural cycle of warming and cooling and it is never at equilibrium, but cycles around some mid point. Excluding CBD's orbital forcing over 100Ky time scales, Solar irradiance variation prior to AD1750 is the driver. Increase the TSI and the Earth receives more incoming energy, warms up until temperature rise increased S-B outgoing energy and the warming is arrested and temperature stabilizes at a higher level. Drop TSI at this higher temperature level and the S-B outgoing exceeds the incoming and the Earth temperature cools. It seems to me that this underlying cycle has an amplitude of natural temperature range and that will follow the natural TSI variation over centuries (excluding the 11 year sun spot ripple). To tell how much Solar irradiance is warming or cooling the Earth we need to know the point we are at in this natural cycle - and that supposes an 'equilibrium' TSI or an average TSI over the cycle.
    0 0
  26. TSI is one thing, but Direct and Indirect Solar forcing Mechanisms on the Climate System Are another thing completely. The Whole argument "TSI has been decreasing since 1980" really is not even relevant because its assuming that overall "equilibrium" is reached immediately after changes in TSI occur. In this case of "rapid equilibrium", TSI energy changes from the Sun are the only way the sun can modulate the climate. But that is assumption. TSI basically covers changes in total energies from the Sun itself, but not how the climate system responds to these changes, whether it be long term changes in Cloud Cover, Effects on the Ozone layer changing the amount of UV rays that can enter the atmosphere/oceans etc... I could go on and on. If we were to look at low clouds, for example..none of our measurement systems are "state of the art", so to speak, in measuring them. Its for this reason though...as if to say that clouds will remain fairly constant unless inflenced by AGW (with no mechanism to boot), that Either Direct or Indirect solar influence cannot affect them. A change in total clouds of 3% would have a significant radiative impact to the Surface Heating, a 0.5W/m^2 Net Radiative Impact, and a change in low clouds only of 3% would apply a 1.8W/m^2 of increased energy. Even if those Values are incorrect, Changes in Low Clouds would act to ( -All caps usage snipped- ) through more incoming SW radiation....and that is exactly what we have seen thus far, Satellite measurements of the entire tropospere showing less warming overall that the surface measurements...AGW works the other way around. And the small Proposed effect from GCR's to cloud cover... if GCR's are excessively low for some time, may have a significant effect on Low Clouds Overtime. So Arguing for TSI in the first place, at least short term, is really a bunch of semantics.
    0 0
    Response:

    [DB] Please familiarize yourself with the Skeptical Science Comments Policy and refrain from the use of All-Caps.  Thanks!

  27. The main argument of the article is to take the difference of north globe temperature level from 1500 to 1800 (+0,15 Degree) and compares this to the same difference in TSI levels of 6 W/m2. This infers tome the question whether it is the chicken or the egg we are looking at first. Since we are right where I want to be, namely comparing the relation of long-term TSI to long-term global temperature (GT), I have some observations/questions: First, on the temperature data used here: It is stated that the Ljungqvist reconstruction exhibits larger temperature changes than the planet as a whole by a factor of approximately two. Based on my limited school knowledge about oceanic and continental climate, shouldn't that just mean "faster"? Are there any global reconstructions which show that this factor of 2 is indeed true? Also, I eyeball that the temperature difference between 1880 and 2000 is 0,4 and not 0,8 Degree, as IPCC states for the whole globe. So could it even be smaller instead of larger temperature changes, by the factor of two? Second, on comparing the curves: At 1700, temperature jumps up by 0,4 Degree, after it fell about the same about before, in the course of almost a century. Behold, the End of the Maunder Minimum (MM). At the same time, TSI was raising by 6 W/m2 (from 1360 to 1366 W/m2). This seems to be a direct feedback, without any climate lag, from TSI to GT. How is that possible? GT then stays more or less the same level for two centuries until 1900. TSI drops in between almost back to the value from the MM. How is that possible? We see another jump up of GT, roughly from 1900 to 1960, by almost the same amount as after the MM; 0,4 Degrees. TSI was raising about 4 W/m2 in that time, again, apparently no lagged response time of GT. How is that possible? My jump-conclusion: Short term relations of TSI to temperature are not possible without heavily taking into consideration all other possible forcings. Seems to make no sense otherwise. Third, not being able to correlate curves on a short-term timescale, maybe we can nevertheless and at least do a more general comparison of TSI and temperature levels: As to the medieval warm period, as well in the antique, we see very rough correspondence between average GT and TSI. High level TSI corresponds to high level temp. Temp seemed at those times roughly to be at the same level as today. And the same applies for TSI! Jump-conclusion: Everything seems to be "normal" at first glance? (Of course, an "unnormality" would be there if temp rises further in the next decades, which is, to quote the infamous wording of IPCC, "very likely".)
    0 0
  28. Falkenherz, First, please, you appear to have skimmed the article, or at best read it without complete comprehension. Please re-read the article several times, and when you hit something you are not absolutely sure of, go do some more research on it. But remember, the point of the article is to discuss whether or not the Shapiro reconstruction is valid, not how TSI correlates to temperature.
    ...shouldn't that just mean "faster"?
    No. Why would you think that? If the NH warmed "faster" then it would get further and further out of balance with the global mean. How could that physically work?
    Are there any...?
    What do you mean? There must be global reconstructions against which to compare the NH reconstruction, otherwise no one could state any factor at all.
    ... 0,4 and not 0,8 Degree, as IPCC states...
    Citation, please. Is this supposed IPCC statement about the northern hemisphere or the globe? To 2000, or 2007? Using 1880 as a baseline, or some other point? Was this an observed or projected value? Did you get this from an actual IPCC report, or from some blog that is itself misrepresenting a statement by the IPCC?
    At the same time, TSI was raising by 6 W/m2...
    If you accept the Shapiro reconstruction, which is the entire point of this article. That reconstruction is an outlier with problems explicitly explained in the OP. Don't cherry pick the data that best fits your hypothesis. That's bad science.
    How is that possible?
    (a) You're still not understanding climate lag and (b) it's probably not, which is sort of the point (that reconstruction is suspect... a 6 W/m2 increase in such a short period has all sorts of problems), and (c) as has been repeatedly explained, there are other factors in climate, and solar variation is only one (and one that in all probability does not vary greatly over time).
    How is that possible?
    See the answer above.
    How is that possible?
    See the answer above.
    ...maybe we can nevertheless and at least do a more general comparison of TSI and temperature levels...
    Yes, we can, we have, and when we do, it seems that the correlation is very, very weak, unless you consider all of the other factors (aerosols, volcanic activity, GHGs, albedo changes) simultaneously. Which is why we have climate models, and which is why trying to sort things out with just 2 variables (TSI + GT) and one constant (climate lag) is never, ever, ever going to lead to anything of any value.
    ... we see very rough correspondence between average GT and TSI.
    Over very long time scales when using the Shapiro reconstruction, which has been called into question, and which is at odds with other solar reconstructions. So why do you uncritically cling to it? This entire post is about the issues with Shapiro, and yet you have adopted it as fact and are attempting to use it to sort out your own misconceptions of climate. Doesn't that strike you as a silly approach?
    Jump-conclusion: Everything seems to be "normal" at first glance?
    Long answer: it shows that in the recent past the primary driver of climate, i.e. the only factor that was able to vary consistently for a long enough time to affect climate (i.e. fractionally drop or rise for hundreds of years) has been the sun. Other factors like albedo changes, volcanic activity, natrual aerosols etc. have not been strong enough or long lived enough to, over the long term in the past thousand years, greatly affect climate. But GHG are not small in their effect, and they are not short lived. They'll be in the atmosphere for hundreds to thousands of years, and their forcing dwarfs even the Shapiro reconstruction of TSI changes. So what does that tell you? Short answer: Key (wrong) words in your statement/question are "seems", "normal" and "first glance". No. You can't eyeball this stuff and get it right, there is no "normal", and first glances are always, always deceiving. You are starting from a very, very, very bad point with all of this, the assumption that the answer is as simple as that hot thing you see in the sky, and a mythical lag like the way you have to wait for the fuel pump to fill your gas tank. At the same time you are ignoring the science that describes all of the other factors, simply because it's too complicated and you want to start "easy." There is no easy. Please make some effort to actually learn the subject, all of it, and stop playing games and wasting everybody's time by taking a too simplistic approach to the subject.
    0 0
  29. Falkenherz: "to quote the infamous wording of IPCC, 'very likely'." This is the kind of comment, Falkenherz, that suggests you're not as open-minded in your approach as you've claimed. The IPCC's wording is only "infamous" among the Heartland group and its adherents. The general public rarely encounters the actual language of the IPCC (how many people outside of the online climate "debate" just up and decide to read the SREX?). It was attacked because it was an inherently soft target: there was no way for the IPCC to use language that could not be attacked. If they had used numerical values for confidence and certainty, they would have been attacked (in presentation to the general public) for trying to quantify certainty (which, to the general public, seems impossible). Had they expressed any sort of absolute certainty, they would obviously have been attacked for being unscientific (science does not deal in absolutes). What would you have them do? Or are you just satisfied to re-hash the attack, an attack that serves absolutely no purpose within the context of the current argument but does act semiotically to place you within a certain group from which you've previously attempted to divorce yourself? Further, if you really want to understand this, then you're going to have to do the math to some extent. There are free spreadsheet programs with useful functions, if you don't have Excel. There are other resources to help you as well. Science of Doom is basically an online textbook. It has taken me four years (spare time, after the babies go to bed) for me to work out the details well enough to not feel like a complete idiot when I open my mouth.
    0 0
  30. Falkenherz, To add to DSL's point about your "very likely" comment... if you made that statement in good faith, believing it to be a valid and tenable position, then you need to step back and to realize how (subtly) warped your view has become as a result of propaganda. There are a hundred (thousand?) trivial little details like this one that you have probably completely and uncritically accepted without even knowing it. Any scoffing dismissal of mainstream science, dripping with venom and disdain, is quite honestly the position of a 21st century moron, someone who wants to enjoy all of the fruits of our modern civilization while living within it like a savage. Your current position is one of a stone age aborigine who believes a camera will steal his soul, and he won't believe otherwise until the tribal shaman (in the form of an un-degreed blogging ex-TV-weatherman?) assures him otherwise. It's up to you to go back and delete these twisted preconceptions from your mental image of climate science. You need to do that before you can proceed and actually understand. On the other hand, if you did not make the "very likely" statement in good faith...
    0 0
  31. With "to quote the infamous wording of IPCC, 'very likely'", I seem to strike a nerve, again. By saying "infamous", I was referring how much deniers get worked up with that wording, by demanding "100%-proof" and thus debunking IPCC assessments on totally wrong premises. I am aware what the article is trying to do; it discusses the findings of the Shapiro essay. So, I repeat: The TSI graph from Shapiro seems to be much more suited to explain the antique and medival warm periods, by linking them to a much clearer high TSI level. On top of it, TSI and temperature from that time seem to roughly match today's. Marcus earlier up seemed to draw exactly the opposite conclusion. That's why I put a questionmark and wanted to discuss this more. Your answers so far were not helpful. Spaerica, as a side remark, I find it strange that Marcus' statement was not contested, mine is, but the basis of our observations are the same "eyeballing method". (-snip-).
    0 0
    Moderator Response: [DB] Tone-trolling snipped.
  32. I am trying to understand the point of the article better: - pointing out that doubled CO2 will yield 3,7W/m2 radiative forcing - comparing that with effects of TSI forcing according to Shapiro on the Ljungqvist-data: "low climate sensitivity" - consequence would be, which is not expressively mentioned in the article: doubled CO2 would be less severe than assumed (if you assumed the same cliamte sensitiviy) - counter argument of the article: "A climate sensitivity this low contradicts the many lines of evidence supporting the IPCC range, and would make large past climate changes (i.e. transitions between glacial and interglacial periods) extremely hard to explain." (includes link to another article here) Did I get the argumentation logic correctly?
    0 0
  33. Falkenherz @32 In general, the answer is yes. As you are not a scientist, let me explain what this means in the science world: 1. If the Shapiro result is defensible in methodology and argumentation, it contrasting past results (metaphor: does not fit existing puzzle) is provisionally accepted 2. This leads to more questioning in this field (actual skepticism!) to explain why different results were obtained, which usually improves the science down the road 3. When said improvement comes along, the result that does not fit into the improved picture becomes marginalized (even if we cannot clearly explain why it was wrong) So far, any arguments made in the past not fitting global warming theory (call them "rogue puzzle pieces") by forwarding alternative explanations (e.g. the Lindzen Iris hypothesis) have not stood the test of time outlined in 1.-3. So if past is any indication of future, Shapiro et al. will not cease to exist, but it may get marginalized quickly unless more evidence fitting it is appearing in the peer-reviewed literature. Does that help?
    0 0
  34. gws, yes, thanks! So I will now look into the bigger picture from that quoted article "how sensitive is the climate" in order to fully understand the argument of this article here.
    0 0

You need to be logged in to post a comment. Login via the left margin or if you're new, register here.


The Consensus Project Website

THE ESCALATOR

(free to republish)


© Copyright 2024 John Cook
Home | Translations | About Us | Privacy | Contact Us