Climate Science Glossary

Term Lookup

Enter a term in the search box to find its definition.

Settings

Use the controls in the far right panel to increase or decrease the number of terms automatically displayed (or to completely turn that feature off).

Term Lookup

Settings


All IPCC definitions taken from Climate Change 2007: The Physical Science Basis. Working Group I Contribution to the Fourth Assessment Report of the Intergovernmental Panel on Climate Change, Annex I, Glossary, pp. 941-954. Cambridge University Press.

Home Arguments Software Resources Comments The Consensus Project Translations About Support

Twitter Facebook YouTube Mastodon MeWe

RSS Posts RSS Comments Email Subscribe


Climate's changed before
It's the sun
It's not bad
There is no consensus
It's cooling
Models are unreliable
Temp record is unreliable
Animals and plants can adapt
It hasn't warmed since 1998
Antarctica is gaining ice
View All Arguments...


Username
Password
New? Register here
Forgot your password?

Latest Posts

Archives

Two Centuries of Climate Science: part two - Hulburt to Keeling, 1931- 1965

Posted on 2 May 2012 by John Mason

The fact that carbon dioxide is a 'greenhouse gas' - a gas that prevents a certain amount of heat radiation escaping back to space and thus maintains a generally warm climate on Earth, goes back to an idea that was first conceived, though not specifically with respect to CO2, nearly 200 years ago. The three-part tale of how this important physical property, its role in the geological past and understanding how it may affect our future, covers about two centuries of enquiry, discovery, innovation and problem-solving.

This is Part Two of this series, which also includes Part One and Part Three.

 Atmospheric carbon dioxide levels from the late 1950s onwards

above: atmospheric carbon dioxide levels from the late 1950s onwards. The red wiggles mark out seasonal variations in uptake by plants.

We resume this narrative in 1931, when American physicist E.O Hulburt ran calculations to determine the effect of doubling carbon dioxide once again, and, including the added burden of water vapour, he came up with a figure of around 4°C of warming. He also rebutted Ångström's work and determined that, regardless of convective processes, it was the escape of infra-red radiation to Space (or the hinderance thereof) that was of key importance. The resultant paper appeared in a the journal Physical Review, which tended not to be read by earth and atmospheric scientists and was as a consequence missed by many of them. In any case, it was generally thought that Earth's climate system maintained itself in some natural kind of balance. In retrospect, given the dramatic climate changes that had led to the ice-ages, this was a curious stance to take.

Seven years later, English engineer Guy Callendar, something of an outsider (a steam-engine specialist but with a very keen interest in meteorology), revived the idea, having discovered evidence of a warming temperature trend in the early twentieth century from compilations of temperature records. At long last, the actual levels of carbon dioxide in the atmosphere were revisited: Callendar found they had increased by some 10%, which he suggested may have caused the warming, and he went on to add that over the coming centuries there could be a climate shift to a permanently warmer state.

The reaction at the time was luke-warm: for example, doubt was cast upon the accuracy of carbon dioxide concentration measurements from the nineteenth century. Plus, there were still the old doubts with respect to the original work of Arrhenius: surely the vastness of the oceans would manage to absorb most of that extra gas. Callendar suggested that the top layer of the ocean, that interacts with the atmosphere, would easily become saturated with carbon dioxide and that would affect its ability to absorb more, because, he thought, the rate of mixing of shallow and deep oceanic waters was likely to be very slow. And there was still that old problem of water vapour and carbon dioxide radiation absorption bands overlapping, decreasing the greenhouse properties of the latter gas. Callendar's own calculations, giving a 2°C temperature rise for a carbon dioxide doubling, were slated: one major criticism was that they dealt only with radiation and left out the effects of that other important way in which heat is moved around, convection, despite what Hulburt had already written about that. Again, the prospect of warming causing more cloudiness was raised - something that there were no methods available at the time with which to estimate in terms of amount. All perfectly reasonable objections, simply because there were insufficient data available at the time to clarify matters further.

Such objections, however, led to a renewed drive to unravel parts of the problem, helped by the upsurge in scientific research that accompanied the onset of the Cold War. Atmospheric processes had key implications in military terms, so that it was deemed necessary to understand them as thoroughly as possible, and the properties and behaviour of infra-red radiation came under particular scrutiny, given that if missiles were somehow able to home in on hotspots such as jet exhausts they could seek and destroy such things. The experiments of Ångström, involving air containing various amounts of carbon dioxide in a tube, were found to have been misleading: the problems  were down to the relatively low-resolution measuring equipment available at the time. Instead of broad absorption bands, the more precise modern equipment found groups of sharp lines, where absorption would occur, with gaps in between where the infra-red would get through unhindered. Carbon dioxide and water-vapour had their own sets of absorption-lines that did not exactly coincide and it was reaffirmed that water vapour was relatively unimportant in the dryer upper levels of the atmosphere. Now, it was certainly realised that the properties of each layer needed to be taken into account too. Hulburt and Callendar - and indeed Arrhenius - had after all been on the right track, even if aspects of their conclusions were incorrect.

By the mid-1950s, scientists had the huge advantage of the calculating power of computers. This made it possible to dissect each layer of Earth's atmosphere and work out how it might absorb infra-red radiation. Physicist Gilbert Plass undertook the task: firstly his work confirmed that more carbon dioxide would have a warming effect and secondly that doubling levels of that gas would result in a warming of 3-4°C. That, at mid-1950s emissions rates, would be a rise of around 1.1°C per century. Plass wrote that if at the end of the 20th Century the average temperature had continued to rise, it would be "firmly established" that carbon dioxide could cause climate change. But again, the response was luke-warm. The lack of attention to water-vapour and cloudiness led to criticisms of crudeness, and again the matter of the ocean absorbing the extra gas was raised in objection to Plass' suggestion that the extra carbon dioxide would remain in the atmosphere for a thousand years.

The 1950s was the era of nuclear tests. Amongst the fallout from nuclear explosions was carbon 14, an unstable isotope of carbon that has six protons and eight neutrons in the nuclei of its atoms (the most abundant by far, forming 98.9% of all carbon on Earth, is carbon 12 with six protons and six neutrons). Because carbon 14 is unstable, it undergoes radioactive decay, and through this radioactivity it can be tracked as it moves around in the atmosphere. The tracking enabled scientists to establish that within a matter of years any long-lived gases added to the atmosphere are well-mixed throughout all layers, from pole to pole. But carbon 14 also forms high in the upper atmosphere, where cosmic ray bombardment occurs. This is a constant process compared to the one-offs that represent each nuclear explosion, a factor that allowed another test to be made.

Carbon 14 has a short half-life, which is why radiocarbon dating is only used for getting ages for relatively recent things and not ancient stuff like rocks that are millions of years old, amongst which can be counted the fossil fuels. In coal and oil, all the carbon 14 has long since decayed away, so that burning them would only release non-radioactive carbon 12 and the much rarer but stable carbon 13. Burning fossil fuels on a massive scale would therefore add more carbon 12 and 13 to the air relative to carbon 14, regardless of nuclear tests. Chemist Hans Suess put this to the test by examining carbon isotopes in trees. He found that the younger the wood, the more carbon 12 and 13 there was relative to carbon 14. This was the fingerprint of fossil fuel-burning, recorded in the wood.

At the time, the increase was small, reinforcing the idea that the oceans were absorbing much of the added carbon dioxide. However, follow-up research was commenced by Suess, working with Roger Revelle at the Scripps Institution of Oceanography, and by other specialists: all came to a similar conclusion independently of one another, which was that the ocean would typically have claimed any molecule of carbon dioxide emitted within about a decade. However, Revelle, something of a specialist in sea-water chemistry, was aware that the various chemicals present in sea-water have buffering effects that work to keep sea-water at a slightly alkaline state. Revelle suggested that the buffering would place a strict limit on the amount of carbon dioxide the oceans could actually absorb.

This was a critical step in the research. Revelle calculated that, at the emissions-rates of the time (assuming, like most of his predecessors, that these would likely remain constant), an increase of atmospheric carbon dioxide levels of around 40% was possible over the coming centuries. However, as an aside he did note that if emission-rates kept on increasing, the outcome would be different with significant warming in the decades ahead. Importantly, he pointed out that human beings were now carrying out a large-scale geophysical experiment of a kind that could not have happened in the past or be reproduced in the future - an allusion, perhaps, to the growing realisation of the finite, one-off nature of the fossil fuels, being as they are a non-renewable resource over human timescales.

The significance of the limited ability of the oceans to absorb carbon dioxide caught on after a while and was elaborated upon by Swedish meteorologists Bert Bolin and Erik Eriksson, who explained what happens. Basically, although the gas is indeed easily absorbed by sea-water, it is the timescales that matter: mixing of shallow and deep oceanic waters takes place over hundreds to thousands of years but sea-water can de-gas parts of its carbon dioxide payload over much, much shorter periods. Like their predecessors, Bolin and Eriksson ran the calculations regarding possible temperature changes for a doubling of carbon dioxide, but this time assuming emissions would increase and increase yet more on an ever-steepening upward path. They wrote of a 25% increase of atmospheric carbon dioxide by the year 2000. This was far more drastic than anything previously had suggested and Bolin warned that a radical change in climate might occur, a statement echoed by Russian climatologist Mikhael Budyko in 1962.

So, what was happening to the atmosphere's carbon dioxide content? Was it really going up? The only way to find out would be to start monitoring the levels of the gas by accurate measurement, so moves were made to do just that, starting with a network of 15 measuring-stations around Scandanavia. The results were incredibly noisy, but then flaws were found in the methodology. However, in California, researcher Charles David Keeling improved the techniques, to the point where he felt that it might be possible to isolate and remove spurious sources of noise. Revelle and Suess took him on, funding his time and equipment. Locations far from noisy, local manmade and natural carbon dioxide sources were chosen, in places such as Antarctica and atop the Mauna Loa volcano in Hawaii. It should be mentioned here that, at the latter site, the prevailing wind is off the ocean and the fissures that emit gases are almost always downwind: if the wind changes the sudden upticks due to volcanogenic carbon dioxide are so blindingly obvious that they can easily be removed. Anyway, the idea was to establish a baseline concentration and then see what the levels would be in subsequent years. By 1958, Keeling was confident that he had the baseline reliably nailed and two years later he reported that levels were rising, at a rate that might be expected if the oceans were not taking in most of the emissions as detailed above.

Sadly, the Antarctica stations fell victim to a lack of funding. However, the Mauna Loa monitoring station was continued and it continued to find an increase. The measurements also picked-up a well-defined and regular fluctuating cycle corresponding to the growing seasons of plants in the northern hemisphere. There was a decrease in Spring and Summer and an increase in Autumn and Winter marking increased and decreased uptake of carbon dioxide respectively. In the meantime, a steadily increasing understanding of other aspects of the complex carbon-cycle was ongoing. The aim in general was to work out how much of the carbon dioxide resulting from the burning of fossil fuels was ending up in the oceans, vegetation, soils, weathered minerals and so on. Importantly, this multidisciplinary work at last brought together the various branches of science that had previously been working in relative isolation: atmospheric scientists, biologists, geochemists, computer specialists and so on. In 1965, it was announced that "By the year 2000 the increase in atmospheric CO2 ... may be sufficient to produce measurable and perhaps marked changes in climate."

history part 2

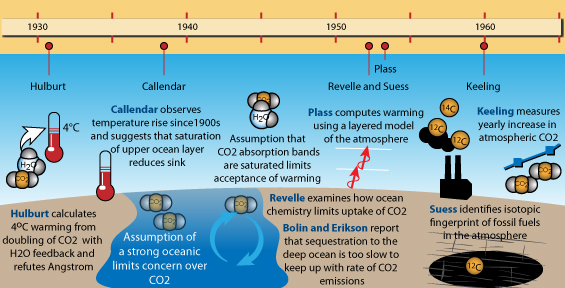
Major discoveries in climate science, 1930-1960.  Image by jg

Further Reading

Spencer Weart's The Discovery of Global Warming gives a very detailed account of the history of climate science with a plethora of references - there are many days' worth of in-depth study there for those who want to go beyond the blogosphere!

0 0

Printable Version  |  Link to this page

Comments

Comments 1 to 23:

  1. John, thanks so much for compiling this history of the science in one easy to access place, or ultimately three places. No longer will I have to thumb back and forth through my dog-eared copy of Spencer Weart's The Discovery of Global Warming.
    0 0
  2. I have been looking for answer to this carbon dioxide question for a few years. Exactly how much CO2 change will cause how much temperature rise? The only real data I could find is the planet Venus. Let us assume the atmosphere is 100% CO2. (It is almost). For round numbers, the temperature is 800 degrees warmer than earth. Let us ignore for now the fact that Venus is closer to the sun and atmospheric pressure (thus CO2 content) is 15 time greater than earth. I will also assume the rate of change of temperature and CO2 is linear. If anyone has any data that differs, I would like to know about it. So, 100% is 800 degrees warmer, 1% would be 8 degrees warmer. And, .01% (100ppm) would be .08 degrees warmer. If you consider that Venus is closer to the sun and the pressure is higher, that further reduce the effect of CO2. It would seem by the above that the effect of CO2 is small. Comments Please. -Jeff
    0 0
  3. Jeff18: 1) The albedo of Venus is much higher than that of Earth, with the result that Venus absorbs less energy from sunlight than does the Earth; 2) Temperature does not increase linearly with CO2 concentration, but rather it increases linearly for each doubling of CO2 concentration. 100% atmospheric concentration represents 12 to 13 doublings of CO2. Therefore based on your simple method, one doubling of CO2 should result in 800/13 = 61.5 degrees C temperature increase. 3) The actual figure for doubling CO2 is the far less disastrous 3 degrees C. The figure is much lower because: a) The more even temperatures on Venus also contribute slightly to increased temperature; b) (more importantly), the much greater atmospheric density on Venus contributes significantly to increased temperatures; and c) The greenhouse effect contributes significantly more to the temperature of Venus than the simple formula for the radiative forcing of CO2 would indicate, that formula only being accurate for a few doublings or halvings of CO2 concentration relative to current levels on Earth. Despite the difficulties represented by (a), (b), and (c) above, models of the greenhouse effect have been shown to predict Venutian surface temperatures for Venutian atmospheric conditions since 1980.
    0 0
  4. Jeff, I don't know whether you were looking over those years, but you should try IPCC WG1 report for starters. How much temperature change for given much change in CO2, is known as climate sensitivity. Search here for that. Remember that radiative response is to log(CO2). Ie you get the same response as going from 200 to 400, as you get from 400 to 800 (or 100 to 200). Secondly, the instantaneous change in forcing directly from CO2 can be directly calculated from the Radiative Transfer Equations but tells only part of the story. The change in temperature from the CO2 induces feedbacks (particularly water vapour, albedo) which further increase temperature. The same physics works for Venus but its not a good analogue because the feedbacks are so different. The feedbacks work over different timescales up to hundreds of years for equilibrium. The IPCC report goes into the detail and links back to the relevant papers.
    0 0
  5. I have seen it noted on this site that CO2 is adding about .02 to the yearly temperature anomaly. I am counting on this effect to power my winnings in the Global Temperature Anomaly prediction markets at Intrade. They have monthly and yearly, plus some other climate bets. Intrade is notoriously good on predicting things. For example, the markets correctly predicted the Oscars, getting 93 out of 95 predictions correct. Intrade was correct 92% on Super Tuesday. I encourage everyone to join in as the more people mean better predictions, but be sure to get the deniers you argue with to put their money where their mouths are too, as there just aren't that many sellers. Seems many of them don't believe their own theories enough to bet on it. I thank Neil Degrasse Tyson for pointing out that you can bet on this, when he was on Bill Maher's show. After all, what's the sense in arguing with them if they don't really believe what they're saying.
    0 0
  6. Jeff18: Venus' atmospheric pressure at the surface is 90x that of earth. Supak: What do you mean by 'adding .02 to the yearly temp anomaly'? Is that .02 degrees? That works as a decadal scale average, but annual variation can be much more.
    0 0
  7. Jim @ 1 linked at the bottom of part 1 is the online version of "The Discovery of Global Warming," which is more detailed than the book, and I believe Weart updates it annually. I'm sure you're aware of it, but for anyone else, it's an excellent chronological primer on the subject. http://www.aip.org/history/climate/co2.htm
    0 0
  8. Indeed, Barry. I'll see if we can place the same link at the end of each of the three parts. Weart's attention to detail is first-rate and if anyone wants to study this story in depth, I can't think of a better place to go. Cheers - John
    0 0
  9. re - above: Done!
    0 0
  10. I also have written about this time period.
    0 0
  11. An amendment to my comment @3. On checking my claims, I noticed that the surface temperature of Venus is 735 degrees, K, making it just 447 degrees K (or C) warmer than the Earth. Consequently, if we were to determine climate sensitivity by a simple comparison with Venusian temperatures, we would find a climate sensitivity between 26 and 34 degrees C per doubling of CO2. The 26 degrees is from the fact that it takes 17 doublings of CO2 to exceed the CO2 concentration of Venus if other atmospheric components are held constant, and not simply replaced by CO2. At the 17th doubling, the Earth's atmosphere would have 37 times its current mass, compared to the Venusian atmosphere which has 93 times the mass of Earth's atmosphere.
    0 0
  12. 5 - supak Hummm... for the US voting and the Oscars results, the 'truth' is identically people think; whereas the "Global Temperature Anomaly" is what physics does. Just because asking people what they think people think is quite accurate, doesn't mean that asking people what they think physics does will be accurate! Mind you, you should expect a better spread for the latter and therefore better betting options.
    0 0
  13. Roger Revelle actually did the fundamental chemical analysis that cracked the question of how much CO2 the oceans would absorb in the late 30's. Howeverthis didn't come to prominence until his paper with Suess in 1957 - Busy year 1957, the International Geophysicl Year. Spencer Weart also comments that the recognition if the implications of Revelle's earlier work in R & S 1957 seems like an after thought, perhaps added at the prompting of reviewers. Perhaps R & S didn't quite want to bite the bullet initially on what their findings meant. Also during this same period Revelle was involved in another study that serendipitously shed light on ocean mixing or the lack thereof. After a US test in the 50's of a Depth Bomb - an atomic depth charge designed to destroy a submarine no matter what - Revelle was on an oceanographic research ship that went back to the test area months later. They took water samples in the region around the balst site. Remnants from the blast had spread out over an area of over 100 sq miles. Not that far when you consider it was months later. But the real find was the vertical distribution of blast products. They were found in a layer in the water only meters thick. Months later! That is a patch of ocean that really, really doesn't want to engage in vertical mixing, even after a Nuclear blast. Strongly suggesting that vertical mixing of heat, chemical changes, dissolved gases etc is quite slow except in regions where vertical currents facilitate mixing. The oceans don't mix things up as much as might be imagined.
    0 0
  14. My thanks to Tom Curtis and scaddenp for their response regarding my post about the planet Venus. When I said it was about 800 degrees hotter than Earth that was degrees F. I should have made that clear. If the temperature change related to CO2 is not linear, that certainly throws my calculations out the window. When you say the temperature change goes up for each doubling of CO2, is there experimental data to back that up? How was that determined? Any publications for that? Thanks. -Jeff
    0 0
  15. Jeff18 there can obviously be no experimental data on the effect of doubling CO2 concentration on current climate. Though, the forcing can be calculated fairly accurately. The "standard" reference is Myhre et al. 1998.
    0 0
  16. Jeff18 @14, the constant change in temperature per doubling of CO2 is primarily a consequence of the fact that the radiative forcing of changed CO2 levels is constant per doubling. The direct radiative forcing is known from detailed studies using radiative transfer models, the results of which are directly compared with observations. To get an idea of the accuracy of the models, I suggest you read my post, "Warm Earth, Cold Atmosphere", particularly the sections, "No more hand waving" and " Settled science"; and also my comment 43. The actual temperature response depends on feedbacks, which are not as well known. Therefore they may vary from the equal temperature change per doubling of CO2, but because the change in forcing is constant, they will not vary much, and certainly not enough to make the response near linear.
    0 0
  17. Just a further addition, the log relation of concentration to radiative forcing drops straight out of the RTE - see Ramanathan and Coakley 1978. The basic radiative properties of the gases is based on experimental data but going back a long time. I dont have them to hand, but try Weart's excellent Discovery of Global Warming for the historical work. The same equations also predict the spectral signature which can be compared to observed. Eg See Harries 2001.
    0 0
  18. @les They have all kinds of markets at Intrade. You can even predict when they'll find the Higgs Boson. But yes, the climate markets are the one market that's money in the bank if you play it right. And they encourage insider trading! @muoncounter This is the data they go by for the monthly and yearly temp anomalies. As I continue betting in the future, the chances of .55s paying off gets higher.
    0 0
  19. Can someone explain how on the one hand the oceans' layers don't mix much at all. On the other hand there are the AMOC and La Nina and other ocean flows where the deeper layers come to the surface and vice versa? And these ocean flows have a huge impact on the worlds climate so they seem to be very significant.
    0 0
  20. BC, there are a range of forces working at different speeds and volumes. Go here for a look at the basics of upper ocean mixing. Go here for a very thorough and technical look at mixing in general wrt energy exchange. Go here for a general look at large-scale ocean currents. Here is a SkS article on the subject, and that is where anyone else who replies to BC--and BC--should post.
    0 0
  21. In addition to Weart's book and website, I have run across another valuable resource, Historical Perspectives on Climate Science by James Rodger Fleming. He does not agree with Weart in every detail. Here is the way Fleming ends his section on Fourier: "For Fourier, the "temperature of space" was much more important than the greenhouse effect in controlling terrestrial temperatures." Fleming gives Callendar more credit than most authors I have read. He has also written a biography called "The Callendar Effect."
    0 0
  22. Jim Powell, yes Fourier thought that cosmic radiation (i.e. "the temperature of space") was the most likely reason for the increased planetary warmth he detected... but we now know he was wrong on that and his ideas about something in the atmosphere holding in the heat closer to the truth (though his description of how that might happen weren't how the greenhouse effect actually works either). I don't see this as disagreeing with Weart... it's just an additional bit of information. Fourier suggested several possible explanations for the extra heat... Weart just concentrated on the one which came closest to being correct rather than the one Fourier himself thought most likely.
    0 0
  23. Fleming's book is a good read, The disagreement between Fleming and Weart on Fourier is marginal. It's true that Fourier was more interested on the temperature of space; nevertheless the idea of the role of the atmosphere is his. Callendar, instead, is rarely quoted despite he was the first (to my knowledge) to try to put up a global surface temperature record and to show the concomitant increase of CO2 and temperature. Maybe it's because he was wrong on several accounts. Archer and Pierrehumbert included one of his articles in their "The Warming Papers".
    0 0

You need to be logged in to post a comment. Login via the left margin or if you're new, register here.


The Consensus Project Website

THE ESCALATOR

(free to republish)


© Copyright 2024 John Cook
Home | Translations | About Us | Privacy | Contact Us