Enter a term in the search box to find its definition.
Settings
Use the controls in the far right panel to increase or decrease the number of terms automatically displayed (or to completely turn that feature off).
Term Lookup
Settings
All IPCC definitions taken from Climate Change 2007: The Physical Science Basis. Working Group I Contribution to the Fourth Assessment Report of the Intergovernmental Panel on Climate Change, Annex I, Glossary, pp. 941-954. Cambridge University Press.
Climate scientists are confident in three ways that climate change will make the impacts of hurricanes worse. First, global warming causes sea level rise, which amplifies storm surges and flooding associated with hurricanes. As a paper published in the Proceedings of the National Academy of Sciences by Aslak Grinsted and colleagues concluded,
"we have probably crossed the threshold where Katrina magnitude hurricane surges are more likely caused by global warming than not."
Second, as climate scientist Kevin Trenberth has noted, global warming has also increased the amount of moisture in the air, causing more rainfall and amplifying flooding during hurricanes.
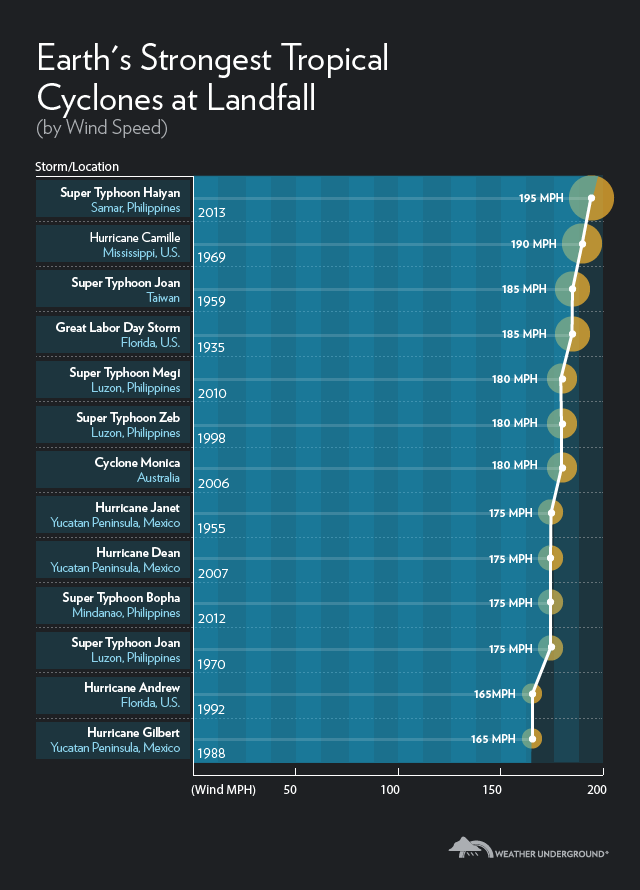
Third, warmer oceans are fuel for hurricanes. Research has shown that the strongest hurricanes have grown stronger in most ocean basins around the world over the past several decades, and climate models consistently project that this trend will continue. Chris Mooney recently documented the past decade's worth of monster hurricanes around the world, and Jeff Masters estimates that 6 of the 13 strongest tropical cyclones on record at landfall have happened since 1998.
The 13 strongest tropical cyclones at landfall. 6 have happened since 1998. Source: wunderground.com
What about Typhoon Intensity Near the Philippines?
"Time series of cyclone indices such as power dissipation ... show upward trends in the North Atlantic and weaker upward trends in the western North Pacific since the late 1970s"
The hurricane intensity trend in the western North Pacific (where the Philippines are located) isn't crystal clear. One recent paper finds that over the past few decades their intensity has slightly fallen (but has grown for the planet as a whole), while others suggest it's slightly risen, or that there are fewer but stronger hurricanes in that western North Pacific region.
However, a paper published earlier this year in the Proceedings of the National Academy of Sciences by MIT hurricane expert Kerry Emanuel found that future "Increases in tropical cyclone activity are most prominent in the western North Pacific." So while we're not certain about the trend over the past few decades, the evidence indicates that hurricanes near the Philippines will both become stronger and form more frequently in a warmer world.
Hurricane Frequency Used to Sow Doubt
The frequency of hurricane formation overall is another story. To this point the evidence does not indicate that hurricanes are forming or making landfall more often than in the past, nor are climate scientists confident how global hurricane frequency will change. Thus it's not a surprise that climate contrarians have focused on hurricane frequency while ignoring hurricane intensity. This is a clear sign of bias by writers like the Mail on Sunday's David Rose, who even went as far as to once again repeat the myth of a global warming 'pause' (a myth that was comprehensively debunked by a new study last week).
Similarly, in a piece published in The Guardian Political Science section, Roger Pielke Jr. criticized President Obama, climate scientist Michael Mann, and others for linking extreme weather to climate change. Pielke lamented that those he criticized didn't reference the 2012 IPCC special report on extreme weather (SREX). However, Pielke's reading of that report was very selective.
Climate Change Intensifies Many Types of Extreme Weather
The IPCC SREX emphasizes that hurricane data include significant uncertainties. However, it's important to note that absence of evidence is not the same as evidence of absence. For example the fact that the data aren't good enough to confidently link rising hurricane intensity to human greenhouse gas emissions so far doesn't mean there isn't a link. It means we need better data to make a conclusive determination.
"Heavy rainfalls associated with tropical cyclones are likely to increase with continued warming."
"Average tropical cyclone maximum wind speed is likely to increase."
"There is medium confidence that some regions of the world have experienced more intense and longer droughts ... There is medium confidence that droughts will intensify in the 21st century in some seasons and areas ... This applies to regions including southern Europe and the Mediterranean region, central Europe, central North America, Central America and Mexico, northeast Brazil, and southern Africa."
"It is virtually certain that increases in the frequency and magnitude of warm daily temperature extremes and decreases in cold extremes will occur in the 21st century at the global scale. It is very likely that the length, frequency, and/or intensity of warm spells or heat waves will increase over most land areas."
When considering all the available evidence, most of the comments about climate change and extreme weather criticized by Pielke were on solid scientific footing. It's important that we face up to not just the changes in extreme weather that we've seen so far, but those which are soon to come if we continue on our current path. It's not so much the climate change we've seen so far that we're worried about; it's what's yet to come.
What Do We Do About It?
Some climate contrarians have claimed that climate realists are exploiting the victims of Haiyan by discussing the link between hurricanes and climate change. But it was Yeb Saño, the Philippines' lead negotiator to this year's United Nations climate talks who pleaded that we stop procrastinating in addressing climate change.
Klause Flemlose @1, the statistics in the chart are simply for the thirteenth strongest tropical cyclones at landfall. That does not include, fairly obviously, all landfalling tropical cyclones and hence the trend in the sample does not show the trend in speeds at landfall of tropical cyclones. Nor is a sample of thirteen large enough to draw any significant conclusions from. Further, the trend you show is probably almost entirely an artifact of the increased frequency of observation of tropical cyclones in the satellite era.
That cuts both ways, of course. The chart does not provide enough information for the downward trend to be significant, but neither does it show enough information to suspect an upward trend if more data was included. In particular, the higher frequency of tropical cyclones with a one minute wind gust velocity greater than 164 mph in recent decades is almost certainly a result of better tracking of cyclones with satellites.
Further, a significant confounding factor in the period of satellite observation is the switch from predominantly El Nino conditions from the late 1970s to the mid 2000s, to predominantly La Nina conditions. La Nina conditions reinforce the Western Pacific Warm Pool, increasing SST around the Phillipines and Australia, a factor in 5 of the 6 cyclones listed since 1998. (It may also be a factor the sixth, striking the caribean coast of Mexico, but I am unsure of the ENSO influence in the caribean).
That confounding factor does not, however, detract from the point of the OP. If increased SST increases the frequency of category 5 tropical cyclones, it will do so wether that increase is due to ENSO or global warming.
One topic at a time. What is the recorded SLR in that region of the world? And, more importantly what was the official storm surge? Can you quantitatively demonstrate that SLR had any appreciable impact on the storm surge?
Statements and predictions are easy. Scientifically proving those statements is not. As one multi-degreed and practicing environmental scientist to another, I am challenging you to show valid proof of your statements.
In addition to the excellwent figure provided by scaddemp @5, see also the following image from the IPCC's fifth assessment report. Note that the tide gauge at Manilla has recorded an increase in sea level of about 0.75 metres since the 1960s (H/T to Eli Rabett)! Note, not all of that is related to global warming, some of the increase in sea-level in the western Pacific is related to decadal-scale variability. Regardless, now add that to a 3-4 m storm surge (as far as I know, no official number has been released yet, but given the intensity of the storm, the observed damage and what storm surge models were predicting, the 3-4 m value is entirely plausible; see video to witness the devastating force of the storm surge) and you have a really big problem made even worse.
Extending Terranova's thoughts, there's a world of difference between a house with no water on the floor and another with only 1cm underfoot.
Some of us have experienced the difference up close and personally. Rest assured, there's only a fraction of a meter of water between a house being useful and useless.
Anywhere there's a storm surge, SLR is playing a role. If it's outdoors, no big deal. Indoors, the story is entirely otherwise.
I don't wish to offend or come across as callous to the suffering that has occurred...now having said that...
Using this video as some kind of humanistic plea for change does nothing to address the issue at hand and actually creates an opening for denialist to take advantage of. The Philippines is not the place to try and link human tragedy and AGW impacts as a way of addressing the need for change. Any half intelligent denialist is going to aggressively wonder off topic and easy show that the amount of the death and destruction was the result of conditions that exist in the Philippines as opposed to the absolute force of the storm. A comparable death count between the next largest storm, Hurricane Camille, and this most recent storm illustrates that death counts and overall destruction have to factor the inherent conditions that exist. You can bet the cost will be lower in the Philippines but the death count much higher. Addressing the measured storm surge and speaking of the loss of life does not factor in that a very large population of people have to live in the surge zone due to poverty and are unlikely to have received timely information suggesting evacuation or refuse to evacuate because where exactly would they go? Any natural disaster is tragic where there is a loss of life or suffering. But adding that human element in an attempt to pull at the heart strings is disingenuous when the speaker/negotiator knows that his government and the culture of corruption are standing in the way of real change or doing anything significant to lessen the impact felt by these kinds of natural disasters.
I say stick to the science and leave the tears for the TV dramas and bakla emotional meltdowns.
YubeDude @9 indeed, any "half intelligent denialist" will always wander aggressively off topic. Wether the disaster is a heat wave in Russia, floods in Pakistan or typhoons in the Phillipines, they will play the age old game of blaming the victims. The interesting thing here is that the game of blaming the victims is even played when the disaster strikes a wealthy western nation with little corruption, such as the Brisbane floods of 2011. Never mind that they need to get their facts almost completely wrong to do so. Blaming the victim exonerates the person laying blame, and allows them to feel superior.
In your case, the fact that the game is played even against an Australian capital city, should it be so unfortunate as to suffer a disaster shows that there is no ideal country whose disasters can be held up as an example that, yes, more extreme weather results in more victims of natural disaster. (The possible exception is disasters in the US, which seem never to be the fault of the victim.) Pointing to the poverty, and the corruption in the Phillipines is just a smoke screen. The victim blaming would have occurred anyway.
What is more, they are mere whisps of a smoke screen. The Phillipines is not unusually corrupt (ranking similarly to the BRIC group of nations, the power houses of economic growth in the third world). So while corruption in the Phillipines may contribute to poverty, it is not the major factor. By far the largest factors are a lack of significant resources in high demand (such as oil), combined with a super-abundance of low wage workers in other nations such that they are a poor choice for sweated factory labour. Even without corruption, even with a strong spirit of enterprise (which by all accounts the Phillipinos have), their nation would still be poor. And because poor unable to build to cyclone resistant standards for the majority of their accomadation. "Corruption" serves in this context only to provide an excuse for not thinking about the real implications.
Those implications are simply that adaption does not work. At least, we are currently unable to adapt to even normal levels of storms except in the most wealthy of nations (and not even always then), so the notion that we can face a world made far worse by global warming and simply adapt to it is laughable. It relies on the fact that death is also a form of adaption, and that deaths in the third world do not weigh significantly on the scales in western policy. (In fact, in Bjorn Lomberg's favourite economic model, it is a "feature" that third world deaths and injury are considered a lower cost than first world deaths and injury.)
So, the response of your putative "half intelligent denialist" amounts to simple moral bankruptcy. It simply treats the suffering of the very poor in the face of disasters as of little moral consequence - and hides the calousness of that fact behind ideological blinders.
Thank you for your analysis and your links to brisbanewaters blog where you provide comprehensive numbers to refute the game of blaming the victim. I just realised that similar game has been playing by one of my fiends (denier of AGW) in relation to the unprecedented NSW fires in October. To my argument that BOM & CSIRO assert the increasing Australian weather extremes will be responsible for more frequent bushfires, and this bushfire, occuring so unusually early in the season, is the evidence supporting their assertion, he replied:
There were always bushfires in Australia. And CAGW has nothing to do with it. If this fire was unusual, or if we've seen more fires recently, that's because there are more people living in Blue Mountains now, and more people means more arsenists. More fires are the acts of arson, the latest one included.
I didn't know what to answer to such argumentation because I didn't have detailed arson statistics at hand and didn't consider the ethical aspect of that talk. Now I see how corrupt such argumentation is. And it's astonishing that it can be applied not only to an exotic country like Philipines, but also to your own country, even your own neighbours (!) And it's often not easy to refute on empirical basis only, like you did in case of Brisbane floods.
I don't see the "Blame the victim" in the list of Climate Myths under the thermometer on the left margin. I think the issue is impotant enough to get our attention: that myth is particularly nasty to warrant a comprehensive rebuttal.
Klaus Flemlose @12, the Skeptical Science comments panel is now WYSIWG (What You See Is What You Get). When editing, stay in the basic tab and just type what you want. You can bold, italic, underline, strike through, subscript, and supercript from that tab by highlighting the relevant text and pressing the relevant button. You can also make ordered and unordered lists, and indents.
If you need to insert links, tables or figures go to the second tab, and use the appropriate buttons. When inserting a picture, ensure you go to the appearance tab and set the width to 500 pixels or less.
Finally, if all else fails, you can use the source tab to edit using html code.
Entering html code anywhere other than in the source tab will simply result in it being displayed as characters on the screen. If the html code is not broken, however, if a moderator clicks edit on your post and then updates, the html code will normally run.
An additional reason that the third world has had bigger hits from extreme weather is that it occupies more of the globe. A gigantic hurricane like Hayian is much more likely to strike a third world country because there are few developed countries in the hurricane zone. A few years ago a denier in my Florida chemistry class told me that concerns about increases in hurricanes were misplaced because Florida had not been hit recently. Two category 5 hurricanes had hit central America that year. He said that if his house was not affected it did not matter! Sandy showed what happens to a developed country when an extreme storm hits. If Miami or Tampa (where I live) got hit with the storm surge that Haiyan had there would be many deaths. Do you feel lucky today?
It is obvious that many extreme storms are caused by AGW, even though there is not statistical confidence in the data. The nature of expreme events is such that scientific confidence will trail the real world experience. Most people in the US now realize that tornadoes in Illonois in November and Hurricanes in New York in October are not normal. Hopefully people will vote for action sooner than later. Five years ago there were many skeptics in my class. Today few students are openly skeptical of AGW.
It is obvious that many extreme storms are caused by AGW, even though there is not statistical confidence in the data.
How is it obvious if there is no confidence in the data. That is counter-intuitive.
The nature of expreme events is such that scientific confidence will trail the real world experience.
How can that be? Unless you are talking about the very first occurance of something. If there had never been a hurricane in Florida, and now there was, your statement could be true, but what you had been discussing does not lead to this conclusion.
Most people in the US now realize that tornadoes in Illonois in November and Hurricanes in New York in October are not normal.
This is simply not true. Where did you get this info from? Did you make it up? Tornados have happened in Ill previously, even in November. While not a common occurrance, it is by no means not normal. The hurricane season, as most described, is from June through November. This obviously includes October.
Tom Curtis @10, to add to your excellent response to Yubedude @9, emotions are necessary to change most minds. Rev. Martin Luther King, Jr., had to write that letter from a Birmingham jail cell to get wider support for the civil rights movement. If anything, the scientific community has not been emotional enough in conveying the gist of the message, viz., complex life on earth is in jeopardy if we continue twiddling our thumbs.
In a sense, a so called developed country is more at risk from extreme hurricanes than an undeveloped country. The higher you are the further you have to fall. If you can build your house yourself from local materials, thatching the roof with palm leaves, you may recover relatively quickly. If you flood the subway with salt water, flood western houses and destroy your electrical grid, the costs build up pretty quickly. The Hurricane zone is, arguably, going to expand into temperate climes as climate zones shift north and we probably need a Philippine type hurricane to hit an American city before we will be shaken out of our comfortable paradigm. No, it won't be possible to attribute any given storm to climate change but that won't interfere with the perception amongst the public that it is so. The sooner we have such storms, the sooner we may get off our duff and start to seriously do something.
The steroids in baseball example shows how it is difficult statistically prove the effect of change. A baseball player hits 20 home runs one year without steroids. The next year he takes steroids and hits 30 home runs. You cannot state with confidence that any single home run was hit because of the steroids, but normal people realize that the steroids have influenced the result.
Here is a list of New York Hurricanes going back before 1800. When I read it I see no landfalling storms that were hurricane strength in October. Hurricane Sandy is described as:
"The largest hurricane ever recorded in the Atlantic Basin [just before landfall], wind gusts topped 100 mph in some parts of the New York Metropolitan area."
Please provide a description of a comparable storm in October within 500 miles of New York. This list of New England hurricanes convienently lists the strength of the storms at landfall and lists no hurricanes in October. Hurricane season lasts from June to November in the Carribean sea, where it is warmer. Your assertion that hurricane season lasts until November in New York is "simply not true". It used to be too cold to support hurricanes in New York at the end of October.
James Hansen has shown that most (over 95%) of hot summers are caused by AGW. There is still debate over individual hot events. That does not mean that the individual hot events were not caused by AGW, just that it is difficult to prove. It is very difficult to prove individual events.
The recent tornadoes in Illonois are extremely rare. Jeff Masters states:
Sunday's outbreak will probably rank as the second to fourth most prolific November tornado outbreak since 1950. But what was really remarkable about the outbreak was how far north it extended. With three confirmed tornadoes on Sunday, Michigan has increased its total number November tornadoes observed since 1950 by 50%, from six to nine. Prior to Sunday, Indiana had recorded 57 November tornadoes. That total increased by 26 on Sunday,"
Although he adds that the record is too short to statistically prove anything. How many of those home runs were hit after the steroids?
I claim that extreme events have become so common that normal people now recognize them. Ten years ago only perceptive people who measured carefully (like James Hansen) noticed them. Now, they are obvious but difficult to prove statistically. Your claim that most people do not recognize these as unusual events is simply incorrect.
The list of the 13 strongest tropical cyclones at landfall appears to be incomplete, since it does not include either of the following, which incidentally are the highest wind velocities ever recorded:
407 kph recorded at Barrow Island, Australia, Apr. 1996
Agnostic, these numbers seem very unlikely to be corresponding to any kind of tropical low pressure system. Small scale phenomena can muster violent winds but the total energy contained in a system thatnears 1000km in diameter is what is at issue here.
Tropical cyclones, TC, have nothing to do with global warming. They put energy into the oceans rather than take it out. High activity since 1974 has created the warming trend an melted the Arctic sea ice. This year, 2013, we had low TC activity and the Arctic sea ice increased fast enough to trap some pleasure vessels. Solar storms create TCs. They come from the sun. We are probably going to have a cold winter. If the sunspots dissapear on the sun, we will have less TCs and overall colder weather.
wpsokeland, you may not have read the comment policy or perhaps you're not familiar with this site. Assertions must be backed up, peer-reviewed science articles are best for that. A statement of fact like "High activity since 1974 has created the warming trend an melted the Arctic sea ice" has no value unless it is backed up by science. Same applies to bascially every sentence of your post. You also need to make an argument that is internally consistent: the first sentence of your post is in contradiction with the third one.
Agnostic @20, the Barrow Island wind gust occurred during a tropical cyclone, but was an individual gust, not a sustained one minute gust as recorded on the chart. On the other hand, the gust recorded in Oklahoma was from a tornado.
wpsokeland @22, cyclones take energy out of the ocean, as is proved by how quickly they dissipate over dry land or cold water. Beyond the first sentence of your post you disappear into pure gobbledigook. As it all depends on the false first claim, there is no need to respond in detail.
William @18, it is more complex than that. Extreme events of similar magnitude will, above a certain threshold, cause more expensive property damage in industrialized nations than in the third world. They will, however, cause fewer deaths and injuries, and less disruption of services. The threshold exists because, in simple terms, a wind that will demolish a corrugated iron shanty shack is likely to leave a brick house undamaged. Indeed, there will always be less property damage in the industrialized world for equivalent storms, but the property damage that occurs will cause greater financial losses. Personally, I think the industrialized world wins on that equation. So do most storm survivors, who are oftern heard saying "You can rebuild houses, you can't rebuild lives."
"TC have nothing to do with global warming". This article presents a case, backed by references for way GW impacts on cyclones and there effects. What is the basis for your assertion?
"The put energy into oceans" - This would be contrary to both physics and measurement overs decades. Please back the extraordinary assertion.
"High activity has melted sea ice". Actually both are just result of global warming. By what physics do you propose that TCs melt arctic ice? Your evidence?
"Low TC activity in 2013". I think you mean low Atlantic TC activity. But if you assertion is correct, then shouldnt sea ice increase in every low TC year and not just 2013?
"Solar storms create TCs". Just got to supporting evidence for this!
"We are going to have a cold winter". Who is we? With ENSO still neutral, I wouldnt bet of a NH cold winter, but its a fair bet that jet stream behaviour will give some unusually cold and some warmer. On other hand, more arctic sea ice might bring back some normality to the jet streams.
chriskoz @11, the situation with regard to bush fires is complicated. First, there is no doubt that one (at least) of the recent fires in NSW was lit by an arsonist, and another by the Army in a live fire excercise. Absent such human activity they would not have occurred. Of course, most fires in Australia prior to white settlement were lit by humans as part of Aboriginal land management. Further, there is little doubt that increased habitation in the blue mountains increases the risk to property and lives from bush fires. Against that, past equivalent fires were not combated by tenders, fire retardant chemicals and helicopters, or large scale back burning. Overall, not climate anthropogenic factors have probably decreased the risk of fire at any given location, although that is far from clear.
What is clear is that if you increase rainfall in wet periods, and decrease rainfall and increase tempertures in dry periods, you will get more fuel for fires, which will be in a drier more ignitable state come fire season. That is what happened this year, and is a prediction for the east coast of Australia - ie, that part of Australia most influence by ENSO. I don't think the science supports any stronger claim with regard to bushfires in Qld, NSW and Victoria. It is also probable that bushfires will decline in the top end (NT, norther WA) as stronger monsoons coming further south green the environment; and decrease also in southern WA where overall drier conditions will support less plant life (not many bushfires in a desert). Bushfires will likely increase in Tasmania as it also dries, but not sufficiently to remove fuel.
In any event, the bushfire debate was not like the flood debate in that in the Brisbane flood, victims were being blamed despite an overwhelming preponderance of measures taken to mitigate floods. Indeed, even residents of Toowoomba (on top of the range) were blamed for choosing to live in a flood plain (!?!). In contrast, some anthropogenic activities beyond climate have increased the risk from bushfires in Australia, and it is reasonable to point that out. It is not reasonable to insist that the impact of climate (as in the bolded sentence above) is not occurring; or to insist that it is immoral to mention it (the first response when the issue was raised). In fact the vehemence with which public figures from the PM on down repudiated that obvious fact surprised me. That they cannot concede something so obvious, and insist on vilifying those who say no more than that bodes ill for Australia.
SCADDENP - Thanks for the info. I have not been able to find that. Do you know where CSIRO mines their data from?
ALBATROSS - Thanks again for another excellent graphic. As a survivor of Hurricane Hugo in 1989 with its 18 ft storm surge, I will not diminish the impact of any tropical storm. I do want to see the official data on the storm surge. The best I can tell is that it is less than 6 feet. Again, that is preliminary. Also, has anyone considered the subject of subsidence in the region? Look up the work of Dr. Lagmay Investigating ground deformation and subsidence in northern Metro Manila in that region of the world.
My overall point is literally: how much SLR has occurred (whether a combination of SLR and subsidence, or not), and what was the realistic storm surge? Once we know those numbers we can input the data and begin to compile data over a period of time to determine any statistical signficance of any of these events.
Before we begin any "immediate action", we need to make sure we are doing it for the right reasons.
wpsokeland - Your claim that tropical storms "...put energy into the oceans rather than take it out" is utterly wrong, and in fact backwards. I would suggest you look at any reference on tropical storms, such as this one, and read about what really happens - heat from the oceans drive the storm, moving energy into cooler air above:
"...warm, moist air from the ocean surface begins to rise rapidly, where it encounters cooler air that causes the warm water vapor to condense and to form storm clouds and drops of rain. The condensation also releases latent heat, which warms the cool air above, causing it to rise and make way for more warm humid air from the ocean below."
The rest of your post is equally baseless. I am puzzled as to what you thought to accomplish by posting such nonsense.
Terranova @29 you cannot tell how high the storm surge was just from one video. You have no idea how close the house shown was to the shore, nor how far above the waterline. Nor, for that matter, do you even know which city it was in; nor the state of the tide at the time it hit. The numerical information I have been able to find puts the storm surge at Tacloban at 6 meters (19.7 feet) in one instance, 17 feet (5.18 meters) in another, and at 5 meters (16.4 feet) in a third. That compares to predictions of up to 7 meters (23 feet). These figures, however, are hardly authoritative.
Further, your appoach to estimateing the impact of global warming on storm surges is dubious. Landfalling tropical cyclones make a sparse and noisy data set. As the increased height of storm surges due to global warming will just be the increase in sea level due to global warming, it is far better to just use estimates of that increase, either observational (for current data) or predicted (for the future). Predicted sea level rise is going to be around 750 mm (2.5 feet) with no mitigation. That is the global average, and will be significantly greater in the tropics. The effect of an additional 2.5 feet on top of the Haiyan storm surge would depend on your exact location. Where the land has a shallow gradient, it will greatly increase the area effected. For those near the shore, it may make no difference at all, in that dead is dead. For those at 4.5 meters above sea level, it may turn a dangerous and damaging flood into a life threatening torrent that destroys all before it. In no case is it a good thing.
CSIRO researchers Church and White have long publishing history from analysis of worldwide tide gauge and satellite sealevel. See for instance here for "Sea-Level Rise from the Late 19th to the Early 21st Century". I would imagine it comes from that group.
There's another factor of anthropogenic global warming that I have not seen mentioned, which is lapse rate, i.e. the temperature gradient between sea level and tropopause.
One of the key factors identifying AGW as distinct from milankovitch or solar-flux-driven global climate change is the fact that the earth is warming "from the inside out" -- specifically, the troposphere is warming at the same time that the stratosphere is cooling.
this change increases the gradient between warm floor (ocean and land) and cold ceiling (tropopause or base of stratosphere).
That increased gradient should cause increased rates of updraft, lower surface pressures, higher/taller storms with greater lateral extent, and stronger surface winds as a result of all of the above.
One thing I do not know is how well constrained are measurements (if any) of lapse rate change, specifically in the tropics.
The average trmperature of our globe is varying over the past 30 years with swings of 0.1 to 0.2 degrees centigrade -- up and down. The general overall trend is upward. Since the solar constant, your only energy source ts constant and, if greenhouse gases were continually increasing via human input, the average temperature of our globe would be continually increasing. There would be no temperature swings as seen in the data. Any PhD in heat transfer would know that a different energy source is active in the real temperature variation.
My published peer reviewed paper on the subject of incoming severe weather from outer space is:
Sokeland, W. P. (2005) SOLAR PILLARS OF FIRE: Part 1: Tornadoes from the Sun, Journal of
Meteorology, UK, 30, 298
Energy is incoming via solar storms. In the case of melting northern sea ice, tropical cyclones in the Atlantic know as hurricanes have been increasing and decreasing at various times over the last 30 years. When the hurricane activity goes to a maximum, the North Atlantic Current convects increased temperatures by 1 degree centigrade to the Arctic seas due to the energy deposited in the tropics by the hurricanes and the sea ice melts. The reverse is true when Hurricane activity is a minimum. Hurricane activity hit a minimum in 2013 and the Arctic sea ice is increasing in area. The changing global average temperatures has very little to do with the concentration of greenhouse gases in our atmosphere.
WP, did you just say that total solar irradiance was constant? Did you just strongly suggest that the oceans transfer energy at a constant rate? I looked for your paper on the internet. Google found eight hits.
wpsokeland @34 draws attention to the "peer reviewed" article he had published in the "Journal of Meteorology", now the International Journal of Meteorology, an article so groundbreaking that it does not appear on Google Scholar save as a single cite.
That is probably par for the course in the Journal of Meteorology. In 2005, 18 of the 33 articles in the journal recieved no citation. Of those that were cited, 10 of the 16 citations recieved were self citations. Doing the maths, only one article recieved more than one citation, and it recieved only 2. This low citation rate and high self citation rate has led the Journal of Meteorology to recieve a very low impact factor. Unsurprisingly, it lies in the bottom quartile atmospheric science journals. As it happens, Sokeland's (almost certainly) single cite was almost certainly a self cite, given that he published SOLAR PILLARS OF FIRE: Part 2 the following year in the same journal.
What is the point of this? Getting a journal through peer review requires convincing (typically) just three people that the paper does not make an obvious blunder. It does not mean it did not make an obvious blunder. It only means the editor and peer reviewers of the paper did not spot it. This very low bar is made easier if you submit multiple times. The more often you submit, the more likely you will find an editor and peer reviewers who themselves blunder by not picking up your blunder. It is made easier again if you submit to a low impact journal, which by its nature will not attract high quality editors and reveiwers, and will be more willing to accept low quality papers.
This low standard is why I have a certain contempt for those who publicize their ground breaking discoveries on blogs, but never get around to submitting for peer review. If they are afraid to face even that hurdle, just how confident in their argument can they be?
In any event, congratulations are in order for Sokeland for having the courage of his convictions, and submitting his ideas and getting them published. However, that is in no way an indication of quality in an argument. At most it indicates a lack of obvious blunders - but in very low impact journals such as the International Journal of Meteorology or Energy and Environment (which appears to have a slightly higher impact rating than the Journal of Meteorology) it does not even indicate that.
So, rather than being published, the true indication of quality in an article is the frequency with which it is cited by others - and the period over which they do so. A poor quality paper might attract a small number of citations from refutations published shortly thereafter - but papers with many citations and which are cited years after publication have indeed been judged by the experts to be of high quality (which is not the same as being judged correct).
Having pointed that out, what of the actual science in Sokeland's papers?
I think his proposal of the existence of invisible tornadoes and hurricanes in his second paper sums it up. It is nonsense, pure and simple.
Tom @10 I think you may have made some mistaken inferences regarding my message. I have long held that diagnosis and prognosis have to be separated to avoid any attempts at clouding the diagnosis with emotion or a fear of the cure. The science of the storm and AGW inputs that are suggested by the intensity of the storm are valid points to consider and investigate and fall within the guidelines of SKS; including the video and making the link to “human tragedy” as part of the message disrupts the flow of science and has no place when determining the diagnosis. I was lobbying for a removal of the video and did so by mentioning that if you are going to shed tears over the pain and suffering than a little perspective is required otherwise this connection of diagnosis and prognosis is low hanging fruit for the “blame the victim” crowd as you mentioned. I find that straight forward hard science does establish the realities and adding the “human” factor only muddies the waters and turns the discourse away from the metrics and PR and starts to introduce suffering as an offset that has to be taken into consideration when weighing the science. That was all I was saying about this post…
Tom Curtis was kind enough to read my peer reviewed articles that state severe weather is incoming due to explosions on the sun and solar storms impacting earth. It is very difficult to state that 50 years of PhD level research is wrong, but very few understand the physics of a tornado or a hurricane and experts are still looking for their Genesis or beginnings. If you do not understand the physics of the storm, you cannot defeat its destructive power. Recall project STORM FURY. The hurricane experts who believed that energy release from the oceans fueled hurricanes tried to use that theory to reduce the power of Wilma. They failed because their theory was incorrect.
Matthew 16:3 And in the morning, It will be foul weather today: for the sky is red and lowering. O ye hypocrites, ye can discern the face of the sky; but can ye not discern the signs of the times?
Check out thr solar storm that occurred a day and one half at the ACE spacecraft before our last tornado outbreak, if you know how.
Oh - I guess we also need a new thread for the "It's God's fury" myth.
Very few understand, WP? And one of those few is undoubtedly you, yes? The world-renowned tornado expert WP Sokeland, with his one floppy publication and general unwillingness to describe any actual physical mechanism. Oh, and general unwillingness to address criticisms of his basic physical model (e.g. ocean-atmosphere energy transfer as spatial and temporal constant).
I'm not just taking your word for it, WP. Expert schmexpert. Cough up the physical theory and observational evidence. Or is the whole thing simply you noticing that, sometimes, tornado outbreaks and solar flares occur in time near one another?
The chart is interesting. If you use the vertical bands to designate decades you can put a red dot at the appropriate point on that timespan for each cyclone. This greatly improves understanding of the data.
Sorry that I don't know how to post graphics here, since I don't have a place on-line to post my enhanced graphic.
"The average trmperature of our globe is varying over the past 30 years with swings of 0.1 to 0.2 degrees centigrade -- up and down. The general overall trend is upward. Since the solar constant, your only energy source ts constant and, if greenhouse gases were continually increasing via human input, the average temperature of our globe would be continually increasing. There would be no temperature swings as seen in the data. Any PhD in heat transfer would know that a different energy source is active in the real temperature variation." (my emphasis)
I agree that any Ph.D. in heat transfer understands conservation of energy, and thus, to the extent that the thermal energy that is added to a system isn't converted into something else like chemical potential energy, latent heat of phase change, mechanical work, or mechanical potential energy, the average temperature of the system (as long as "average temperature" is calculated by properly weighting temperature data with heat capacity of the material at the recorded temperature, to accord with conservation of energy) is generally physically forced to rise when you add thermal energy to it. I don't think you have to be a specialist in heat transfer or have a Ph.D. or even a B.S. in anything to understand conservation of energy. Conservation of energy is an intuitive concept that people are generally taught in required science courses in high school if not before.
That said, I suspect you are misapplying the principle of conservation of energy to the global climate. What do you mean by "average temperature of the globe?" I assume you probably mean average surface air temperature over land? If so, that represents a very tiny component of the thermal energy of the climate system, about 90% of which is found in the oceans. Given the cycles of heat flow back and forth between the oceans and the land and atmosphere, it is unsurprising and consistent with AGW theory that there are fluctuations in land surface air temperature rather than a constant rise. My understanding is that, when you account for warming of the oceans, the total thermal energy of the climate system has been consistently increasing over the past 30 years, as would be expected given the thermal disequilibrium caused primarily by spiking CO2 levels primarily due to human activities.
"(The possible exception is disasters in the US, which seem never to be the fault of the victim.)"
Just sayin', but there was an awful lot of blaming (or at least stigmatizing) the victims around Katrina. And of course the 'God's fury' loons came out of the woodwork for Sandy as well, New York being in their eyes a Sodom on the Hudson.
But (slightly closer to the topic at hand) I wonder about even the presumption that warnings lag greatly in all developing nations. For example, the Christian Science Monitor reported that:
I'm getting 180-190 mph limit for category 6 here, http://erimaassa.blogspot.fi/2013/11/haiyan-scale.html
I think there is a need for a consistent scale of above 11 beauforts, since i think the ocean water-atmosphere exchange should increase even though the height of the waves do not. Do stronger hurricanes produce saltier rain than the lesser ones? In the grand scheme of things this likely isn't very notable effect but locally it might be, not to talk anything about the devastation caused by the tropical cyclone itself. My 6$ isn't much but it should be enough for some water proof cloth for a shelter or rain water collection. on B.Gates income that would be some 10M$, and he does a lot of charity, but every little bit may help.
00
You need to be logged in to post a comment. Login via the left margin or if you're new, register here.


 Arguments


For other reason that presented here, I think the statement is correct.
The statistics copied from Earth’s Strongest Landfall Tropical Cyclones at landfall does not indicate at all that the wind speed is increasing.
There too little information in the graph to show anything. The data is sorted by mph creating a picture of an increasing trend.
Below the data is plotted by year and the histogram is shown:
The number of records broken over the years 1935 to 2013 is 4.This is not extreme in any ways.
This following graph shows 10000 simulated runs of 79 years of observations assuming that no development in wind speed has taken place.
The probability for 4 broken records or more is 0.5768.
[RH] Deleted empty lines.
Klause Flemlose @1, the statistics in the chart are simply for the thirteenth strongest tropical cyclones at landfall. That does not include, fairly obviously, all landfalling tropical cyclones and hence the trend in the sample does not show the trend in speeds at landfall of tropical cyclones. Nor is a sample of thirteen large enough to draw any significant conclusions from. Further, the trend you show is probably almost entirely an artifact of the increased frequency of observation of tropical cyclones in the satellite era.
That cuts both ways, of course. The chart does not provide enough information for the downward trend to be significant, but neither does it show enough information to suspect an upward trend if more data was included. In particular, the higher frequency of tropical cyclones with a one minute wind gust velocity greater than 164 mph in recent decades is almost certainly a result of better tracking of cyclones with satellites.
Further, a significant confounding factor in the period of satellite observation is the switch from predominantly El Nino conditions from the late 1970s to the mid 2000s, to predominantly La Nina conditions. La Nina conditions reinforce the Western Pacific Warm Pool, increasing SST around the Phillipines and Australia, a factor in 5 of the 6 cyclones listed since 1998. (It may also be a factor the sixth, striking the caribean coast of Mexico, but I am unsure of the ENSO influence in the caribean).
That confounding factor does not, however, detract from the point of the OP. If increased SST increases the frequency of category 5 tropical cyclones, it will do so wether that increase is due to ENSO or global warming.
Dana,
One topic at a time. What is the recorded SLR in that region of the world? And, more importantly what was the official storm surge? Can you quantitatively demonstrate that SLR had any appreciable impact on the storm surge?
Statements and predictions are easy. Scientifically proving those statements is not. As one multi-degreed and practicing environmental scientist to another, I am challenging you to show valid proof of your statements.
[JH] Please lose the snark.
When people talk about Camille in 1969 I point out that Haiyan was massive. It was likely about 3X the size of Camille.
Wind speed records are somewhat misleading and don't account for the amount of energy contained in cyclones.
Philippines sealevel rise is much higher than world average at around 12mm/yr.
Are you suggesting that it is physically possible for SLR not to add to storm surge height? That would seem to violate a no. of physical laws.
[RH] Fixed image width.
Terranova @3,
In addition to the excellwent figure provided by scaddemp @5, see also the following image from the IPCC's fifth assessment report. Note that the tide gauge at Manilla has recorded an increase in sea level of about 0.75 metres since the 1960s (H/T to Eli Rabett)! Note, not all of that is related to global warming, some of the increase in sea-level in the western Pacific is related to decadal-scale variability. Regardless, now add that to a 3-4 m storm surge (as far as I know, no official number has been released yet, but given the intensity of the storm, the observed damage and what storm surge models were predicting, the 3-4 m value is entirely plausible; see video to witness the devastating force of the storm surge) and you have a really big problem made even worse.
Extending Terranova's thoughts, there's a world of difference between a house with no water on the floor and another with only 1cm underfoot.
Some of us have experienced the difference up close and personally. Rest assured, there's only a fraction of a meter of water between a house being useful and useless.
Anywhere there's a storm surge, SLR is playing a role. If it's outdoors, no big deal. Indoors, the story is entirely otherwise.
Just to bring a bit of visual and audible to the discussion:
http://www.youtube.com/watch?v=hcfdFggVnPE&list=UUVLkqTvsRpm46RDmM4SYf6Q
[RH] in the future please include a more descriptive comment with your links.
I don't wish to offend or come across as callous to the suffering that has occurred...now having said that...
Using this video as some kind of humanistic plea for change does nothing to address the issue at hand and actually creates an opening for denialist to take advantage of. The Philippines is not the place to try and link human tragedy and AGW impacts as a way of addressing the need for change. Any half intelligent denialist is going to aggressively wonder off topic and easy show that the amount of the death and destruction was the result of conditions that exist in the Philippines as opposed to the absolute force of the storm. A comparable death count between the next largest storm, Hurricane Camille, and this most recent storm illustrates that death counts and overall destruction have to factor the inherent conditions that exist.
You can bet the cost will be lower in the Philippines but the death count much higher. Addressing the measured storm surge and speaking of the loss of life does not factor in that a very large population of people have to live in the surge zone due to poverty and are unlikely to have received timely information suggesting evacuation or refuse to evacuate because where exactly would they go?
Any natural disaster is tragic where there is a loss of life or suffering. But adding that human element in an attempt to pull at the heart strings is disingenuous when the speaker/negotiator knows that his government and the culture of corruption are standing in the way of real change or doing anything significant to lessen the impact felt by these kinds of natural disasters.
I say stick to the science and leave the tears for the TV dramas and bakla emotional meltdowns.
YubeDude @9 indeed, any "half intelligent denialist" will always wander aggressively off topic. Wether the disaster is a heat wave in Russia, floods in Pakistan or typhoons in the Phillipines, they will play the age old game of blaming the victims. The interesting thing here is that the game of blaming the victims is even played when the disaster strikes a wealthy western nation with little corruption, such as the Brisbane floods of 2011. Never mind that they need to get their facts almost completely wrong to do so. Blaming the victim exonerates the person laying blame, and allows them to feel superior.
In your case, the fact that the game is played even against an Australian capital city, should it be so unfortunate as to suffer a disaster shows that there is no ideal country whose disasters can be held up as an example that, yes, more extreme weather results in more victims of natural disaster. (The possible exception is disasters in the US, which seem never to be the fault of the victim.) Pointing to the poverty, and the corruption in the Phillipines is just a smoke screen. The victim blaming would have occurred anyway.
What is more, they are mere whisps of a smoke screen. The Phillipines is not unusually corrupt (ranking similarly to the BRIC group of nations, the power houses of economic growth in the third world). So while corruption in the Phillipines may contribute to poverty, it is not the major factor. By far the largest factors are a lack of significant resources in high demand (such as oil), combined with a super-abundance of low wage workers in other nations such that they are a poor choice for sweated factory labour. Even without corruption, even with a strong spirit of enterprise (which by all accounts the Phillipinos have), their nation would still be poor. And because poor unable to build to cyclone resistant standards for the majority of their accomadation. "Corruption" serves in this context only to provide an excuse for not thinking about the real implications.
Those implications are simply that adaption does not work. At least, we are currently unable to adapt to even normal levels of storms except in the most wealthy of nations (and not even always then), so the notion that we can face a world made far worse by global warming and simply adapt to it is laughable. It relies on the fact that death is also a form of adaption, and that deaths in the third world do not weigh significantly on the scales in western policy. (In fact, in Bjorn Lomberg's favourite economic model, it is a "feature" that third world deaths and injury are considered a lower cost than first world deaths and injury.)
So, the response of your putative "half intelligent denialist" amounts to simple moral bankruptcy. It simply treats the suffering of the very poor in the face of disasters as of little moral consequence - and hides the calousness of that fact behind ideological blinders.
Tom@10,
Thank you for your analysis and your links to brisbanewaters blog where you provide comprehensive numbers to refute the game of blaming the victim. I just realised that similar game has been playing by one of my fiends (denier of AGW) in relation to the unprecedented NSW fires in October. To my argument that BOM & CSIRO assert the increasing Australian weather extremes will be responsible for more frequent bushfires, and this bushfire, occuring so unusually early in the season, is the evidence supporting their assertion, he replied:
I didn't know what to answer to such argumentation because I didn't have detailed arson statistics at hand and didn't consider the ethical aspect of that talk. Now I see how corrupt such argumentation is. And it's astonishing that it can be applied not only to an exotic country like Philipines, but also to your own country, even your own neighbours (!) And it's often not easy to refute on empirical basis only, like you did in case of Brisbane floods.
I don't see the "Blame the victim" in the list of Climate Myths under the thermometer on the left margin. I think the issue is impotant enough to get our attention: that myth is particularly nasty to warrant a comprehensive rebuttal.
In post nr 1, I have tried to include pictures and links using the syntax prescribed. Nothing works.
I could earlier use the html bottom, but i does not work any more.
Please help me.
Klaus Flemlose @12, the Skeptical Science comments panel is now WYSIWG (What You See Is What You Get). When editing, stay in the basic tab and just type what you want. You can bold, italic, underline, strike through, subscript, and supercript from that tab by highlighting the relevant text and pressing the relevant button. You can also make ordered and unordered lists, and indents.
If you need to insert links, tables or figures go to the second tab, and use the appropriate buttons. When inserting a picture, ensure you go to the appearance tab and set the width to 500 pixels or less.
Finally, if all else fails, you can use the source tab to edit using html code.
Entering html code anywhere other than in the source tab will simply result in it being displayed as characters on the screen. If the html code is not broken, however, if a moderator clicks edit on your post and then updates, the html code will normally run.
An additional reason that the third world has had bigger hits from extreme weather is that it occupies more of the globe. A gigantic hurricane like Hayian is much more likely to strike a third world country because there are few developed countries in the hurricane zone. A few years ago a denier in my Florida chemistry class told me that concerns about increases in hurricanes were misplaced because Florida had not been hit recently. Two category 5 hurricanes had hit central America that year. He said that if his house was not affected it did not matter! Sandy showed what happens to a developed country when an extreme storm hits. If Miami or Tampa (where I live) got hit with the storm surge that Haiyan had there would be many deaths. Do you feel lucky today?
It is obvious that many extreme storms are caused by AGW, even though there is not statistical confidence in the data. The nature of expreme events is such that scientific confidence will trail the real world experience. Most people in the US now realize that tornadoes in Illonois in November and Hurricanes in New York in October are not normal. Hopefully people will vote for action sooner than later. Five years ago there were many skeptics in my class. Today few students are openly skeptical of AGW.
post nr 1 and nr 13:
Thanks to Tom Curtis. Now it is working
michael sweet @ 14
How is it obvious if there is no confidence in the data. That is counter-intuitive.
How can that be? Unless you are talking about the very first occurance of something. If there had never been a hurricane in Florida, and now there was, your statement could be true, but what you had been discussing does not lead to this conclusion.
This is simply not true. Where did you get this info from? Did you make it up? Tornados have happened in Ill previously, even in November. While not a common occurrance, it is by no means not normal. The hurricane season, as most described, is from June through November. This obviously includes October.
Tom Curtis @10, to add to your excellent response to Yubedude @9, emotions are necessary to change most minds. Rev. Martin Luther King, Jr., had to write that letter from a Birmingham jail cell to get wider support for the civil rights movement. If anything, the scientific community has not been emotional enough in conveying the gist of the message, viz., complex life on earth is in jeopardy if we continue twiddling our thumbs.
In a sense, a so called developed country is more at risk from extreme hurricanes than an undeveloped country. The higher you are the further you have to fall. If you can build your house yourself from local materials, thatching the roof with palm leaves, you may recover relatively quickly. If you flood the subway with salt water, flood western houses and destroy your electrical grid, the costs build up pretty quickly. The Hurricane zone is, arguably, going to expand into temperate climes as climate zones shift north and we probably need a Philippine type hurricane to hit an American city before we will be shaken out of our comfortable paradigm. No, it won't be possible to attribute any given storm to climate change but that won't interfere with the perception amongst the public that it is so. The sooner we have such storms, the sooner we may get off our duff and start to seriously do something.
Franklefkin:
The steroids in baseball example shows how it is difficult statistically prove the effect of change. A baseball player hits 20 home runs one year without steroids. The next year he takes steroids and hits 30 home runs. You cannot state with confidence that any single home run was hit because of the steroids, but normal people realize that the steroids have influenced the result.
Here is a list of New York Hurricanes going back before 1800. When I read it I see no landfalling storms that were hurricane strength in October. Hurricane Sandy is described as:
"The largest hurricane ever recorded in the Atlantic Basin [just before landfall], wind gusts topped 100 mph in some parts of the New York Metropolitan area."
Please provide a description of a comparable storm in October within 500 miles of New York. This list of New England hurricanes convienently lists the strength of the storms at landfall and lists no hurricanes in October. Hurricane season lasts from June to November in the Carribean sea, where it is warmer. Your assertion that hurricane season lasts until November in New York is "simply not true". It used to be too cold to support hurricanes in New York at the end of October.
James Hansen has shown that most (over 95%) of hot summers are caused by AGW. There is still debate over individual hot events. That does not mean that the individual hot events were not caused by AGW, just that it is difficult to prove. It is very difficult to prove individual events.
The recent tornadoes in Illonois are extremely rare. Jeff Masters states:
Sunday's outbreak will probably rank as the second to fourth most prolific November tornado outbreak since 1950. But what was really remarkable about the outbreak was how far north it extended. With three confirmed tornadoes on Sunday, Michigan has increased its total number November tornadoes observed since 1950 by 50%, from six to nine. Prior to Sunday, Indiana had recorded 57 November tornadoes. That total increased by 26 on Sunday,"
Although he adds that the record is too short to statistically prove anything. How many of those home runs were hit after the steroids?
I claim that extreme events have become so common that normal people now recognize them. Ten years ago only perceptive people who measured carefully (like James Hansen) noticed them. Now, they are obvious but difficult to prove statistically. Your claim that most people do not recognize these as unusual events is simply incorrect.
The list of the 13 strongest tropical cyclones at landfall appears to be incomplete, since it does not include either of the following, which incidentally are the highest wind velocities ever recorded:
407 kph recorded at Barrow Island, Australia, Apr. 1996
484 kph recorded in Oklahoma, USA, May 1999.
Agnostic, these numbers seem very unlikely to be corresponding to any kind of tropical low pressure system. Small scale phenomena can muster violent winds but the total energy contained in a system thatnears 1000km in diameter is what is at issue here.
Tropical cyclones, TC, have nothing to do with global warming. They put energy into the oceans rather than take it out. High activity since 1974 has created the warming trend an melted the Arctic sea ice. This year, 2013, we had low TC activity and the Arctic sea ice increased fast enough to trap some pleasure vessels. Solar storms create TCs. They come from the sun. We are probably going to have a cold winter. If the sunspots dissapear on the sun, we will have less TCs and overall colder weather.
wpsokeland, you may not have read the comment policy or perhaps you're not familiar with this site. Assertions must be backed up, peer-reviewed science articles are best for that. A statement of fact like "High activity since 1974 has created the warming trend an melted the Arctic sea ice" has no value unless it is backed up by science. Same applies to bascially every sentence of your post. You also need to make an argument that is internally consistent: the first sentence of your post is in contradiction with the third one.
Agnostic @20, the Barrow Island wind gust occurred during a tropical cyclone, but was an individual gust, not a sustained one minute gust as recorded on the chart. On the other hand, the gust recorded in Oklahoma was from a tornado.
wpsokeland @22, cyclones take energy out of the ocean, as is proved by how quickly they dissipate over dry land or cold water. Beyond the first sentence of your post you disappear into pure gobbledigook. As it all depends on the false first claim, there is no need to respond in detail.
William @18, it is more complex than that. Extreme events of similar magnitude will, above a certain threshold, cause more expensive property damage in industrialized nations than in the third world. They will, however, cause fewer deaths and injuries, and less disruption of services. The threshold exists because, in simple terms, a wind that will demolish a corrugated iron shanty shack is likely to leave a brick house undamaged. Indeed, there will always be less property damage in the industrialized world for equivalent storms, but the property damage that occurs will cause greater financial losses. Personally, I think the industrialized world wins on that equation. So do most storm survivors, who are oftern heard saying "You can rebuild houses, you can't rebuild lives."
Lets break this down:
"TC have nothing to do with global warming". This article presents a case, backed by references for way GW impacts on cyclones and there effects. What is the basis for your assertion?
"The put energy into oceans" - This would be contrary to both physics and measurement overs decades. Please back the extraordinary assertion.
"High activity has melted sea ice". Actually both are just result of global warming. By what physics do you propose that TCs melt arctic ice? Your evidence?
"Low TC activity in 2013". I think you mean low Atlantic TC activity. But if you assertion is correct, then shouldnt sea ice increase in every low TC year and not just 2013?
"Solar storms create TCs". Just got to supporting evidence for this!
"We are going to have a cold winter". Who is we? With ENSO still neutral, I wouldnt bet of a NH cold winter, but its a fair bet that jet stream behaviour will give some unusually cold and some warmer. On other hand, more arctic sea ice might bring back some normality to the jet streams.
chriskoz @11, the situation with regard to bush fires is complicated. First, there is no doubt that one (at least) of the recent fires in NSW was lit by an arsonist, and another by the Army in a live fire excercise. Absent such human activity they would not have occurred. Of course, most fires in Australia prior to white settlement were lit by humans as part of Aboriginal land management. Further, there is little doubt that increased habitation in the blue mountains increases the risk to property and lives from bush fires. Against that, past equivalent fires were not combated by tenders, fire retardant chemicals and helicopters, or large scale back burning. Overall, not climate anthropogenic factors have probably decreased the risk of fire at any given location, although that is far from clear.
What is clear is that if you increase rainfall in wet periods, and decrease rainfall and increase tempertures in dry periods, you will get more fuel for fires, which will be in a drier more ignitable state come fire season. That is what happened this year, and is a prediction for the east coast of Australia - ie, that part of Australia most influence by ENSO. I don't think the science supports any stronger claim with regard to bushfires in Qld, NSW and Victoria. It is also probable that bushfires will decline in the top end (NT, norther WA) as stronger monsoons coming further south green the environment; and decrease also in southern WA where overall drier conditions will support less plant life (not many bushfires in a desert). Bushfires will likely increase in Tasmania as it also dries, but not sufficiently to remove fuel.
In any event, the bushfire debate was not like the flood debate in that in the Brisbane flood, victims were being blamed despite an overwhelming preponderance of measures taken to mitigate floods. Indeed, even residents of Toowoomba (on top of the range) were blamed for choosing to live in a flood plain (!?!). In contrast, some anthropogenic activities beyond climate have increased the risk from bushfires in Australia, and it is reasonable to point that out. It is not reasonable to insist that the impact of climate (as in the bolded sentence above) is not occurring; or to insist that it is immoral to mention it (the first response when the issue was raised). In fact the vehemence with which public figures from the PM on down repudiated that obvious fact surprised me. That they cannot concede something so obvious, and insist on vilifying those who say no more than that bodes ill for Australia.
SCADDENP - Thanks for the info. I have not been able to find that. Do you know where CSIRO mines their data from?
ALBATROSS - Thanks again for another excellent graphic. As a survivor of Hurricane Hugo in 1989 with its 18 ft storm surge, I will not diminish the impact of any tropical storm. I do want to see the official data on the storm surge. The best I can tell is that it is less than 6 feet. Again, that is preliminary. Also, has anyone considered the subject of subsidence in the region? Look up the work of Dr. Lagmay Investigating ground deformation and subsidence in northern Metro Manila in that region of the world.
My overall point is literally: how much SLR has occurred (whether a combination of SLR and subsidence, or not), and what was the realistic storm surge? Once we know those numbers we can input the data and begin to compile data over a period of time to determine any statistical signficance of any of these events.
Before we begin any "immediate action", we need to make sure we are doing it for the right reasons.
wpsokeland - Your claim that tropical storms "...put energy into the oceans rather than take it out" is utterly wrong, and in fact backwards. I would suggest you look at any reference on tropical storms, such as this one, and read about what really happens - heat from the oceans drive the storm, moving energy into cooler air above:
The rest of your post is equally baseless. I am puzzled as to what you thought to accomplish by posting such nonsense.
Terranova @29 you cannot tell how high the storm surge was just from one video. You have no idea how close the house shown was to the shore, nor how far above the waterline. Nor, for that matter, do you even know which city it was in; nor the state of the tide at the time it hit. The numerical information I have been able to find puts the storm surge at Tacloban at 6 meters (19.7 feet) in one instance, 17 feet (5.18 meters) in another, and at 5 meters (16.4 feet) in a third. That compares to predictions of up to 7 meters (23 feet). These figures, however, are hardly authoritative.
Further, your appoach to estimateing the impact of global warming on storm surges is dubious. Landfalling tropical cyclones make a sparse and noisy data set. As the increased height of storm surges due to global warming will just be the increase in sea level due to global warming, it is far better to just use estimates of that increase, either observational (for current data) or predicted (for the future). Predicted sea level rise is going to be around 750 mm (2.5 feet) with no mitigation. That is the global average, and will be significantly greater in the tropics. The effect of an additional 2.5 feet on top of the Haiyan storm surge would depend on your exact location. Where the land has a shallow gradient, it will greatly increase the area effected. For those near the shore, it may make no difference at all, in that dead is dead. For those at 4.5 meters above sea level, it may turn a dangerous and damaging flood into a life threatening torrent that destroys all before it. In no case is it a good thing.
CSIRO researchers Church and White have long publishing history from analysis of worldwide tide gauge and satellite sealevel. See for instance here for "Sea-Level Rise from the Late 19th to the Early 21st Century". I would imagine it comes from that group.
There's another factor of anthropogenic global warming that I have not seen mentioned, which is lapse rate, i.e. the temperature gradient between sea level and tropopause.
One of the key factors identifying AGW as distinct from milankovitch or solar-flux-driven global climate change is the fact that the earth is warming "from the inside out" -- specifically, the troposphere is warming at the same time that the stratosphere is cooling.
this change increases the gradient between warm floor (ocean and land) and cold ceiling (tropopause or base of stratosphere).
That increased gradient should cause increased rates of updraft, lower surface pressures, higher/taller storms with greater lateral extent, and stronger surface winds as a result of all of the above.
One thing I do not know is how well constrained are measurements (if any) of lapse rate change, specifically in the tropics.
Anyone know?
The average trmperature of our globe is varying over the past 30 years with swings of 0.1 to 0.2 degrees centigrade -- up and down. The general overall trend is upward. Since the solar constant, your only energy source ts constant and, if greenhouse gases were continually increasing via human input, the average temperature of our globe would be continually increasing. There would be no temperature swings as seen in the data. Any PhD in heat transfer would know that a different energy source is active in the real temperature variation.
My published peer reviewed paper on the subject of incoming severe weather from outer space is:
Sokeland, W. P. (2005) SOLAR PILLARS OF FIRE: Part 1: Tornadoes from the Sun, Journal of
Meteorology, UK, 30, 298
Energy is incoming via solar storms. In the case of melting northern sea ice, tropical cyclones in the Atlantic know as hurricanes have been increasing and decreasing at various times over the last 30 years. When the hurricane activity goes to a maximum, the North Atlantic Current convects increased temperatures by 1 degree centigrade to the Arctic seas due to the energy deposited in the tropics by the hurricanes and the sea ice melts. The reverse is true when Hurricane activity is a minimum. Hurricane activity hit a minimum in 2013 and the Arctic sea ice is increasing in area. The changing global average temperatures has very little to do with the concentration of greenhouse gases in our atmosphere.
WP, did you just say that total solar irradiance was constant? Did you just strongly suggest that the oceans transfer energy at a constant rate? I looked for your paper on the internet. Google found eight hits.
Why don't you take your argument to an appropriate thread.
Regulars, wasn't there a "It's solar flares" myth once upon a time. Can't find it.
wpsokeland @34 draws attention to the "peer reviewed" article he had published in the "Journal of Meteorology", now the International Journal of Meteorology, an article so groundbreaking that it does not appear on Google Scholar save as a single cite.
That is probably par for the course in the Journal of Meteorology. In 2005, 18 of the 33 articles in the journal recieved no citation. Of those that were cited, 10 of the 16 citations recieved were self citations. Doing the maths, only one article recieved more than one citation, and it recieved only 2. This low citation rate and high self citation rate has led the Journal of Meteorology to recieve a very low impact factor. Unsurprisingly, it lies in the bottom quartile atmospheric science journals. As it happens, Sokeland's (almost certainly) single cite was almost certainly a self cite, given that he published SOLAR PILLARS OF FIRE: Part 2 the following year in the same journal.
What is the point of this? Getting a journal through peer review requires convincing (typically) just three people that the paper does not make an obvious blunder. It does not mean it did not make an obvious blunder. It only means the editor and peer reviewers of the paper did not spot it. This very low bar is made easier if you submit multiple times. The more often you submit, the more likely you will find an editor and peer reviewers who themselves blunder by not picking up your blunder. It is made easier again if you submit to a low impact journal, which by its nature will not attract high quality editors and reveiwers, and will be more willing to accept low quality papers.
This low standard is why I have a certain contempt for those who publicize their ground breaking discoveries on blogs, but never get around to submitting for peer review. If they are afraid to face even that hurdle, just how confident in their argument can they be?
In any event, congratulations are in order for Sokeland for having the courage of his convictions, and submitting his ideas and getting them published. However, that is in no way an indication of quality in an argument. At most it indicates a lack of obvious blunders - but in very low impact journals such as the International Journal of Meteorology or Energy and Environment (which appears to have a slightly higher impact rating than the Journal of Meteorology) it does not even indicate that.
So, rather than being published, the true indication of quality in an article is the frequency with which it is cited by others - and the period over which they do so. A poor quality paper might attract a small number of citations from refutations published shortly thereafter - but papers with many citations and which are cited years after publication have indeed been judged by the experts to be of high quality (which is not the same as being judged correct).
Having pointed that out, what of the actual science in Sokeland's papers?
I think his proposal of the existence of invisible tornadoes and hurricanes in his second paper sums it up. It is nonsense, pure and simple.
Tom @10
I think you may have made some mistaken inferences regarding my message.
I have long held that diagnosis and prognosis have to be separated to avoid any attempts at clouding the diagnosis with emotion or a fear of the cure. The science of the storm and AGW inputs that are suggested by the intensity of the storm are valid points to consider and investigate and fall within the guidelines of SKS; including the video and making the link to “human tragedy” as part of the message disrupts the flow of science and has no place when determining the diagnosis.
I was lobbying for a removal of the video and did so by mentioning that if you are going to shed tears over the pain and suffering than a little perspective is required otherwise this connection of diagnosis and prognosis is low hanging fruit for the “blame the victim” crowd as you mentioned.
I find that straight forward hard science does establish the realities and adding the “human” factor only muddies the waters and turns the discourse away from the metrics and PR and starts to introduce suffering as an offset that has to be taken into consideration when weighing the science.
That was all I was saying about this post…
Tom Curtis was kind enough to read my peer reviewed articles that state severe weather is incoming due to explosions on the sun and solar storms impacting earth. It is very difficult to state that 50 years of PhD level research is wrong, but very few understand the physics of a tornado or a hurricane and experts are still looking for their Genesis or beginnings. If you do not understand the physics of the storm, you cannot defeat its destructive power. Recall project STORM FURY. The hurricane experts who believed that energy release from the oceans fueled hurricanes tried to use that theory to reduce the power of Wilma. They failed because their theory was incorrect.
Matthew 16:3 And in the morning, It will be foul weather today: for the sky is red and lowering. O ye hypocrites, ye can discern the face of the sky; but can ye not discern the signs of the times?
Check out thr solar storm that occurred a day and one half at the ACE spacecraft before our last tornado outbreak, if you know how.
Oh - I guess we also need a new thread for the "It's God's fury" myth.
Very few understand, WP? And one of those few is undoubtedly you, yes? The world-renowned tornado expert WP Sokeland, with his one floppy publication and general unwillingness to describe any actual physical mechanism. Oh, and general unwillingness to address criticisms of his basic physical model (e.g. ocean-atmosphere energy transfer as spatial and temporal constant).
I'm not just taking your word for it, WP. Expert schmexpert. Cough up the physical theory and observational evidence. Or is the whole thing simply you noticing that, sometimes, tornado outbreaks and solar flares occur in time near one another?
[JH] Please dial down the sarcasm.
The chart is interesting. If you use the vertical bands to designate decades you can put a red dot at the appropriate point on that timespan for each cyclone. This greatly improves understanding of the data.
Sorry that I don't know how to post graphics here, since I don't have a place on-line to post my enhanced graphic.
wpsokeland@34
"The average trmperature of our globe is varying over the past 30 years with swings of 0.1 to 0.2 degrees centigrade -- up and down. The general overall trend is upward. Since the solar constant, your only energy source ts constant and, if greenhouse gases were continually increasing via human input, the average temperature of our globe would be continually increasing. There would be no temperature swings as seen in the data. Any PhD in heat transfer would know that a different energy source is active in the real temperature variation." (my emphasis)
I agree that any Ph.D. in heat transfer understands conservation of energy, and thus, to the extent that the thermal energy that is added to a system isn't converted into something else like chemical potential energy, latent heat of phase change, mechanical work, or mechanical potential energy, the average temperature of the system (as long as "average temperature" is calculated by properly weighting temperature data with heat capacity of the material at the recorded temperature, to accord with conservation of energy) is generally physically forced to rise when you add thermal energy to it. I don't think you have to be a specialist in heat transfer or have a Ph.D. or even a B.S. in anything to understand conservation of energy. Conservation of energy is an intuitive concept that people are generally taught in required science courses in high school if not before.
That said, I suspect you are misapplying the principle of conservation of energy to the global climate. What do you mean by "average temperature of the globe?" I assume you probably mean average surface air temperature over land? If so, that represents a very tiny component of the thermal energy of the climate system, about 90% of which is found in the oceans. Given the cycles of heat flow back and forth between the oceans and the land and atmosphere, it is unsurprising and consistent with AGW theory that there are fluctuations in land surface air temperature rather than a constant rise. My understanding is that, when you account for warming of the oceans, the total thermal energy of the climate system has been consistently increasing over the past 30 years, as would be expected given the thermal disequilibrium caused primarily by spiking CO2 levels primarily due to human activities.
"(The possible exception is disasters in the US, which seem never to be the fault of the victim.)"
Just sayin', but there was an awful lot of blaming (or at least stigmatizing) the victims around Katrina. And of course the 'God's fury' loons came out of the woodwork for Sandy as well, New York being in their eyes a Sodom on the Hudson.
But (slightly closer to the topic at hand) I wonder about even the presumption that warnings lag greatly in all developing nations. For example, the Christian Science Monitor reported that:
www.csmonitor.com/World/Latest-News-Wires/2013/1113/Typhoon-Haiyan-Was-the-government-prepared
[JH] Unnessecary white space deleted.
I'm getting 180-190 mph limit for category 6 here, http://erimaassa.blogspot.fi/2013/11/haiyan-scale.html
I think there is a need for a consistent scale of above 11 beauforts, since i think the ocean water-atmosphere exchange should increase even though the height of the waves do not. Do stronger hurricanes produce saltier rain than the lesser ones? In the grand scheme of things this likely isn't very notable effect but locally it might be, not to talk anything about the devastation caused by the tropical cyclone itself. My 6$ isn't much but it should be enough for some water proof cloth for a shelter or rain water collection. on B.Gates income that would be some 10M$, and he does a lot of charity, but every little bit may help.