Climate Science Glossary

Term Lookup

Enter a term in the search box to find its definition.

Settings

Use the controls in the far right panel to increase or decrease the number of terms automatically displayed (or to completely turn that feature off).

Term Lookup

Settings


All IPCC definitions taken from Climate Change 2007: The Physical Science Basis. Working Group I Contribution to the Fourth Assessment Report of the Intergovernmental Panel on Climate Change, Annex I, Glossary, pp. 941-954. Cambridge University Press.

Home Arguments Software Resources Comments The Consensus Project Translations About Support

Twitter Facebook YouTube Mastodon MeWe

RSS Posts RSS Comments Email Subscribe


Climate's changed before
It's the sun
It's not bad
There is no consensus
It's cooling
Models are unreliable
Temp record is unreliable
Animals and plants can adapt
It hasn't warmed since 1998
Antarctica is gaining ice
View All Arguments...


Username
Password
New? Register here
Forgot your password?

Latest Posts

Archives

Wall Street Journal 'Skeptics' Misrepresent the IPCC

Posted on 3 March 2012 by keithpickering

A recent comment thread at RealClimate contains some loose talk about Skeptical Science (SkS), including one commenter's complaint that SkS has not (or not adequately) discussed the climate projections of the IPCC's 1990 First Assesment Report (FAR). Although we have posted about the FAR in the past, this is a good time to take another look.

Figure 1 shows the IPCC's 1990 projections from FAR, figure 6.11, page 190 (the original pdf is a scanned image that is slightly skewed; I have corrected that here).

ipcc projections

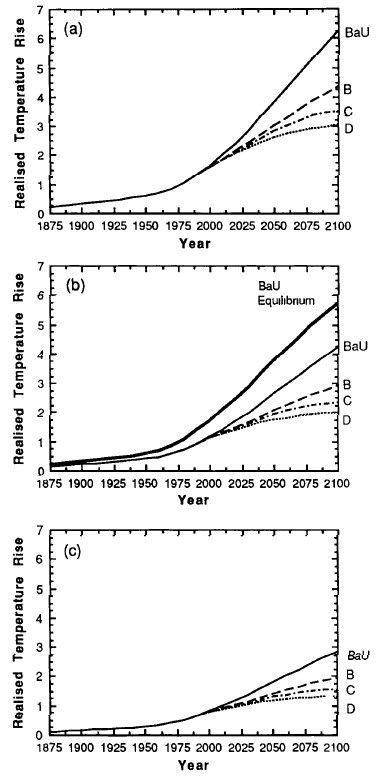
Figure 1: IPCC FAR Figure 6.11, surface temperature projections

As you can see, the IPCC shows three graphs in the figure, for three different equilibrium climate sensitivities (how much the planet will warm in response to a doubling of atmospheric CO2 once it reaches energy equilibrium). This is because in 1990, the value of equilibrium climate sensitivity was not well known, and IPCC was covering several possibilities: (a) is for a sensitivity of 4.5° for CO2 doubling (which FAR labels as a "high" estimate); (b) is for 2.5° (FAR calls this the "best" estimate), and (c) is for 1.5° (called the "low" estimate).

Within each graph are four projections based on four emissions scenarios. So there is not one climate projection in the FAR, but twelve different projections based on twelve different possibilities. Here are my measurements of the temperature increase rates (in °C per decade) shown in the figure of these twelve possibilities, for the period 1990-2010 (Table 1).

Table 1: FAR Figure 6.11 Surface Temperature Projections

  Emissions Scenarios:
Equilibrium SensitivityBaUBCD
4.5° (High estimate, graph a) .35 .25 .25 .25
2.5° (Best estimate, graph b) .24 .20 .18 .17
1.5° (Low estimate, graph c) .18 .14 .12 .11


The discussion on RealClimate was kicked off by recent editorials in the Wall Street Journal (WSJ). Back on January 27, sixteen scientists and engineers (many with undisclosed ties to the oil industry) wrote an editorial in the WSJ minimizing the dangers of global warming. 

The editorial drew quite a few negative reviews because of its bad science.  Economist William Nordhaus publicly complained that the Gang of 16 had misrepresented his work, and subsequently wrote an article setting the record straight that his research shows the opposite of what the WSJ "skeptics" claimd (climate mitigation actually saves money).  And at least two negative letters to the editor appeared in WSJ's own pages: one by Robert Bryer of the American Physical Society, and one by Kevin Trenberth and 37 other noted climatologists. The original editorial ran about 1200 words, while the two letters to the editor were about 700 words combined.

On February 21, the WSJ doubled down with another 1900 words from the Gang of 16. One would think that a reputable newspaper, having been accused of misrepresentation in the first instance, would exercise great caution when publishing a second go-round by the same authors. Alas, this was not the case. The WSJ and its Gang of 16 have simply dug the hole deeper, this time by misrepresenting the FAR. Here's the graph that appeared in the WSJ:

WSJ FAR misrepresentation

Figure 2: The WSJ figure (misrepresentation), intended to show how bad climate models are

The eye is immediately drawn to the high-slope line labelled "IPCC 1990."  This line shows a temperature increase of 0.32°C per decade, far outside of most climate projections. Looking back at Table 1, only one projection is anywhere close to the 0.32°C per decade increase that the WSJ graph shows: the business-as-usual (BaU) scenario coupled with a sensitivity of 4.5°C. This raises two important questions.

1. When the IPCC report shows three possibilities for climate sensitivity, is it fair to claim (or to imply) that the highest of those three is more preferred by the IPCC than the other two?

I think any fair-minded person would say the answer is no.  In fact, most people would say that if any were preferred, it would be the middle of the three, not either extreme.  And since the IPCC itself labels the middle of these estimates as "best," they have answered the question themselves. Using the "high" estimate alone, as the WSJ has done, is misleading at best.

Beyond that, current science has narrowed the range of possibilities for equilibrium climate sensitivity considerably. Both the 1.5°C and 4.5°C sensitivities now seem unlikely. The best estimte from the most recent IPCC report is about 3°C, while Royer et. al. (2007) puts it at 2.8°C based on 500 million years of climate data. So the middle of the three possibilities in 1990 has indeed turned out to be the most likely.  The IPCC's label of "best" was correct at the time.

2. Of the four emissions scenarios in these graphs, which has been closest to the emissions we have actually experienced during the past 20 years?

Figure 3 shows the FAR's projections of radiative forcing for the four emissions scenarios they considered.

FAR scenarios

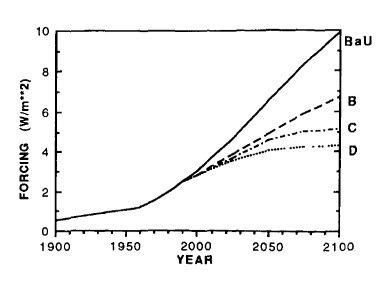
Figure 3: FAR Figure A.6, radiative forcing under different emissions scenarios

Once again the figure from the pdf scan was skewed and was corrected before analysis.  Table 2 summarizes those forcing estimates.

Table 2: FAR Figure A.6 radiative forcing projections from 1990 to 2010

ScenarioChange in forcing, 1990-2010
BaU +1.23 W/m²
B +0.78 W/m²
C +0.70 W/m²
D +0.63 W/m²
Actual +0.63 W/m²

 The actual forcing increase of +0.63 W/m² is from NOAA's Annual Greenhouse Gas Index. The FAR projections were based on four emission scenarios, and we now know that Scenario D was virtually identical to what we have actually experienced, and about half that of the BaU scenario. The BaU scenario of 1990 did not actually happen.

The collapse of the former Soviet Union led to a decimation of Soviet Block industry which nearly halved Eastern European emissions.  In addition, the Montreal Protocol put an end to manufacturing of some of the most potent chlorofluorocarbons (CFCs, which are greenhouse gases), and its effect has been swift.  Also, growing global recognition of the threat of climate change has rapidly increased the adoption of renewable energy, both in the US and especially in Europe; government subsidies such as feed-in tarrifs have encouraged this trend. Meanwhile, the rising price of fossil fuels has led to slower economic growth than most would have predicted in 1990.

If we look again at the temperature predictions for Scenario D, the FAR predictions were increases of 0.25, 0.17, and 0.11°C per decade, based on sensitivities of 4.5, 2.5, and 1.5°C for CO2 doubling, respectively.  The central figure of 0.17°C, based on the best sensitivity estimate, is virtually identical to the actual observed temperature increase over the past 30 years (Figure 4).  Foster & Ramstorf (2011) puts the increase at 0.16 +/- .02°C per decade.

FAR projection comparison

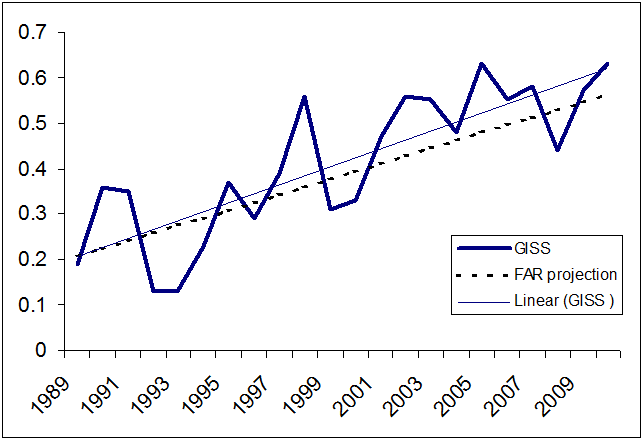
Figure 4: Actual IPCC FAR projections under observed emissions (Scenario D) compared to observed temperatures from NASA GISS

To summarize, the IPCC's First Assesment report of 1990 hit the bullseye in terms of climate modeling. It was a remarkably accurate projection, especially considering that the climate models available in 1990 were crude by modern standards.

As it happened, world events took an unpredictable turn in the 1990s which limited emissions growth to the low end of IPCC FAR predictions.  The work of the IPCC, such as FAR, has been a spur to these collective actions, and is the reason IPCC was awarded the 2007 Nobel Peace Prize.

The Wall Street Journal's misrepresentation of the IPCC's work does a disservice to its audience, to the public, and to mankind as a whole.

0 0

Printable Version  |  Link to this page

Comments

1  2  Next

Comments 1 to 50 out of 96:

  1. It may help those following Anteros' link from real climate to "Lessons from Past Climate Predictions: IPCC FAR" if the older post had an update linking it to this post.
    0 0
  2. I've been testing the water over at Dr. Curry's site. Some commentators are more rational than others. Anteros is currently in my bucket of those who fail the are-we-having-a-rationale-discussion test, for refuting the evidence I could reference with his, apparently, personal conviction.
    0 0
  3. The take-away that I took from that RC thread was that Anteros is trying to assert that the IPCC did not know what they were talking in 1990 about because they were not able predict the future GHG emissions with high accuracy.
    0 0
  4. Good post. Is there any indication that FAR took account of aerosols? I see from your source where the actual forcing was +0.63W/m^2, but the source doesn't include the impact of aerosols. NASA has its estimates in below link. The 1990-2010 impact of aerosols (tropospheric+stratospheric+Black Carbon+Aerosol indirect effect), is -0.38 W/m^2 for 1990-2010, which offsets their estimate of GHGs, which they calculated at +0.71 W/m^2. That nets out to +0.33 W/m^2. Could also add in snow albedo at +0.05 W/m^2 and solar at -0.12 W/m^2. Given that, one might expect even less warming than you calculated assuming +0.63W/m^2. http://data.giss.nasa.gov/modelforce/RadF.txt
    0 0
  5. "Skeptics" sometimes jump on this sort of thing as equivalent to cherry picking, in that you've fed the observed (known in hindsight) values of model inputs into the original model to yield new predictions or select which predictions to consider. However, this exercise actually confirms the validity of the conceptual understanding that the model embodies, because the structure of a model and the particular values of its inputs are completely separate things. Consider: I my conceptual understanding of accounting is embodied by this model of the growth rate of my bank account: rate of balance increase = salary - expenses + interest - fees Based on this model, I predict that if my salary increases by $100 per month and everything else stays the same, my bank account balance will increase by $100 per month. (Note: this prediction is not the same as saying that my bank account is ONLY affected by salary and not at all by interest, fees, or expenses). Now, suppose that my salary actually increased by $80 per month and the bank added a new fee of $10 per month, so that my bank account only grows by $70 per month. Does this discrepancy between predicted and realized rates of increase invalidate the model, or my conceptual understanding of the system? NO! The only thing it indicates is that predictions about future changes in model input values were not quite right right. The conceptual understanding is intact, because when I use the observed input values, the model accurately predicts the observed change in the state variable.
    0 0
  6. Todd F - no, the FAR did not account for aerosols. See the link provided by mdenison in comment #1 for details. As that post discusses, accounting for aerosols would reduce the net forcing, which would thus suggest the actual climate sensitivity is somewhat larger than 2.5°C for 2xCO2 (as sensitivity = dT/dF).
    0 0
  7. Mammal_E - indeed, all the denialists get out of any model prediction or projection is "the model is wrong." This includes "skeptics" like John Christy, coincidentally. They never seem interested in examining why the model projections were "wrong", which is usually either because the model sensitivity was high (as in Hansen 1988) and/or because the emissions scenarios were not perfect.
    0 0
  8. Climate pseudoskeptics also have no problem appealing to models if they think the model results will agree with them (e.g. Spencer's simple model which Barry Brickmore has critiqued on several occasions).
    0 0
  9. Thanks Dana for pointing me in the right direction. I found the article about the growth of sulphur emissions in East Asia to be interesting. I hadn't realized that sulphur emissions in that region would have more than the normal effect. In my toy climate model, I haven't been projecting much [negative] increase in the rf for aerosols (past 2000), due to stabilizing global sulphur emissions. It appears that GISS thinks that the net radiative impact for aerosols is still growing in influence, even though it seems that global sulphur emissions are declining somewhat. If sulphur emissions continue to grow in East Asia, it may continue to mask much of the radiative impact of GHGs for some time ahead. But, due to higher climate sensitivity than previously assumed, this is going to end up spelling much higher growth of global temperatures later in the century. This is also problematic in that it may delay the perceived urgency of addressing the problem.
    0 0
  10. I'm a little disappointed that you didn't actually address any of my criticisms from the Realclimate thread. This is somewhat ironic, because one of my criticisms is that SkS didn't address the predictions of the FAR. I use "predictions" because that is what the FAR used, although it is nowhere in your original article. You do not even mention what the fundamental FAR predictions given to policymakers of the world was, which was this: "BASED ON CURRENT MODEL RESULTS, WE PREDICT: AN AVERAGE RATE OF INCREASE OF GLOBAL MEAN TEMPERATURE DURING THE NEXT CENTURY OF 0.3C PER DECADE (WITH AN UNCERTAINTY RANGE OF 0.2-0.5C). That 0.3C [Which they specified would lead to 2C above pre-industrial by 2025] was with a BAU emissions scenario which they told the leaders of the world (and on which the UNFCCC 1992 was signed) would occur "if few or no steps are taken to limit GHG emissions." The upper and lower uncertainty limits were, of course, model results from runs with 1.5 and 4.5 degC/2xCo2. Now, my point was that you never mentioned ANY of this in your article. You never mentioned the word "prediction" once. On the Realclimate thread Professor Barry Bickmore called the predictions "way off" and Gavin said they were "wrong". My comment on the thread was to agree with them and contrast this to your praise for their accuracy. Finally, in your post above, you say of the graph in the WSJ article - "This line shows a temperature increase of 0.32°C per decade, far outside of most climate projections. Far outside most of most climate projections? This is simply not true - the 0.3 degrees which the graph represents is EXACTLY the central prediction of the whole 1990 IPCC FAR. It is the headline number and one that was impressed upon every leader of every country in the world. Perhaps many of your readers were too young to remember. Please do not mistake me for someone who has any gripe against the IPCC. The prediction that was "way off" was made in good faith and of course we are learning all the time. However, it is impossible to learn from a prediction that is "way off" unless it is admitted that the prediction was badly wrong in the first place.
    0 0
    Response:

    [DB] Please take the time to acquaint yourself with this site's Comments Policy.  Note especially the section barring the use of All-Caps, such as you have done here.  Future comments constructed thusly will be deleted or snipped at the moderator's discretion.

    All-Caps portion struck out.

  11. Apologies for using capitals. I'll re-write in lower case letters the fundamental prediction of the FAR. "Based on current model results, We predict: An average rate of increase of global mean temperature during the next century of 0.3C per decade (with an uncertainty range of 0.2-0.5C per decade)" Dana1981 @ 7 You say that climate predictions are wrong usually either because the climate sensitivity is too high or because the emissions scenarios were not perfect. There isn't very much else to get wrong is there? But I think you do most sceptics a disservice by saying they are not interested in why predictions are wrong. I don't think that's true. But I think what is crucial, before beginning to understand why the predictions were wrong, is to actually admit the fact that they are wrong in the first place.
    0 0
  12. Anteros @10: The average rate of temperature change would have been 0.32˚C/decade, but that does not mean that each decade would see a 0.32˚C increase. The change over 1990-2010 was not 0.64˚C in the BAU scenario, it was closer to 0.5˚C.
    0 0
  13. Anteros @ 10: 1) You have egregiously misquoted the IPCC FAR. The actual text from the quoted section reads as follows:
    "Based on current model results, we predict: • under the IPCC Business-as-Usual (Scenario A) emissions of greenhouse gases, a rate of increase of global mean temperature during the next century of about 0.3°C per decade (with an uncertainty range of 0.2°C to 0.5°C per decade), this is greater than that seen over the past 10,000 years. This will result in a likely increase in global mean temperature of about 1°C above the present value by 2025 and 3oC before the end of the next century The rise will not be steady because of the influence of other factors. • under the other IPCC emission scenarios which assume progressively increasing levels of controls rates of increase in global mean temperature of about 0.2°C per decade (Scenario B), just above 0.1°C per decade (Scenario C) and about 0.1 °C per decade (Scenario D)"
    (Periods where left out of the PDF, and have been reinserted by me in what I believe to be the appropriate positions.) Clearly, the IPCC FAR prediction is relative to different possible forcing scenarios. It does not, as you misrepresent it as doing, make an absolute prediction independent of future concentrations of GHG in the atmosphere. That also means there is no justification for comparing their "prediction" to observations without first determining how GHG forcings actually changes over time, and which of scenarios A, B, C and D best describe that change. 2) The central prediction for BAU of 3 degrees C is less than that in graph B. In other words, the IPCC FAR prediction assumes a climate sensitivity of less than 2.5 degrees C per doubling of CO2. There is therefore no possible justification for using the high climate sensitivity from Graph A, and even using the Graph B (Best Estimate) predictions will overstate the predictions made in the summary for policy makers. 3) The prediction quoted by you is for the trend per decade averaged over the full century. It is common knowledge, and can be verified by laying a straight line against the graph that temperature changes are expected to be more rapid at the end of the century than at the beginning. Therefore using the prediction of average full century trends necessarily overstates the predicted trend for the first two decades of the 21st century. Given that, there can be no justification for using the full century trend predictions for determining the IPCC FAR predictions under different scenarios for the first 20 years after the prediction. Rather, you must determine the prediction over those decades seperately as was done above. To summarize, there is no merit to your accusations which are based on misrepresentation, misquotation and flawed analysis at best.
    0 0
  14. If I recall correctly too, the forcing/concentration relationship for CO2 was higher during AR1 than for subsequent reports (later reports adopted the ∆F = 5.35ln(C/C0) equation developed in Myhre et al 1998, and that is still used today). The old scaling factor was closer to 6.3(?) I think, so any predicted increase in CO2, and likely other GHGs for that matter, would have resulted in an estimate of radiative forcing that was higher than the actual forcing, thus a higher prediction of temperature. The point made in #2 in the post above is a very important one. It's not legitimate to compare scenarios to the real world result just because they share the same name or are labeled "best."
    0 0
  15. Anteros: Business As Usual did not happen. The Montreal Protocol significantly reduced CFC greenhouse gas emissions and methane rise slowed down to a stop.
    0 0
  16. Update to my previous: yes, 6.3 was the scaling factor, from Hansen et al 1988. This can be found in Table 2.2 below: http://www.ipcc.ch/ipccreports/far/wg_I/ipcc_far_wg_I_chapter_02.pdf
    0 0
  17. If I could reword a previous statement: "It's not legitimate to compare scenarios to the real world result just because they share the same name or are labeled "best."" to: "It's not legitimate to compare scenarios to the real world result just because they are called "BAU" or "best.""
    0 0
  18. I would like to add that, using the data in that graph, you can easily show that the 1995 IPCC "predictions" were right on the money (.15 ºC / decade) http://i.imgur.com/OF2dr.gif (in spanish, sorry)
    0 0
  19. The point about the forcing/concentration equation being different might have some implications for how correct Figure 4 is, though not much. Comparing forcing figures is fine, since the relationship between forcing and temperature change has always been handled the same way, but if you want to compare true apples to apples, then concentration data between real world and the FAR models should be compared, not forcing. Comparing concentrations, and using the same forcing/concentration equation, the observed forcing should be slightly lower in Figure 4 above (or the model result slightly higher). By how much for either, I don't know.
    0 0
  20. Anteros - I find it curious that you fail to recognize the conditional in the FAR. Namely, the statement: If this emission pattern, then this result You then criticize the rather old projections based upon emissions patterns that simply did not occur. In other words, you criticize the consequent while ignoring the influence of the antecedent. That's a failure of logic on your part. Until you acknowledge that, you are simply playing semantic games. You are certainly not invalidating the rather primitive FAR projections, which are still holding up well. At best, you are mistaken, at worst, you are misrepresenting the IPCC to insult it. I leave it up to your response to see which is the case here.
    0 0
  21. Well, I was going to say something intelligent, but it looks like everyone else said it already. Thanks Alex C, Tom Curtis, and Wingding.
    0 0
  22. I don't know quite what to make of the fact that no-one has addressed my criticisms. It seems you would all rather take the word of a sketchy, hand-drawn impressionistic graph than the specific written predictions of the FAR. And if anyone is playing at semantics, it is those people [like the original article] that substitute the word 'projection' for 'prediction'. Tom Curtis @ 13 You say there is no justification for using the high sensitivity of graph A. Indeed - neither the WSJ article, or myself, did that. We used the 0.3 degrees per decade from the prediction of the FAR BAU. As I pointed out in my first comment, the error was in the SkS post above, suggesting that the [estimated from a graph] 0.32C was closest to the high climate sensitivity. It isn't - it is the 2.5C/2xCo2 best estimate. The idea that 0.3C per decade was implied to only average out later in the century is firmly rebutted by the prediction that temperatures would rise one degree by 2025 (if steps were not taken etc etc) To cut to the chase, this whole defence of a very poor prediction is that climate sensitivity is believed to be roughly what it was believed to be 20 years ago - and that this is the only way to judge whether the IPCC FAR prediction was accurate. Professor Bickmore, Gavin Schmidt and many others (including myself, obviously) disagree. The FAR predicted, specifically that the BAU scenario would eventuate if few or no steps were taken to limit emissions of GHG's. And for those people clutching at straws with the Montreal protocol, that was signed and sealed 3 years before the IPCC FAR. 194 countries signed the 1992 UNFCCC, on the basis of the predictions of the FAR. To even begin to learn lessons from the failed predictions, it is essential to accept and admit that the predictions were wrong. It isn't complicated, and the first step is to use the words used in the FAR, particularly the word 'prediction'.
    0 0
  23. Well done Keith! This is yet another shameless example of Dick Lindzen and his fellow fake skeptics willfully (they do know better, or they can claim ignorance if they choose)distorting and cherry picking in order to confuse and mislead the public. They could only create their illusion by choosing the very high end of the climate sensitivity range and the most pessimistic emssion scenario. Worse yet, now in 2012 they try and claim that the prediction was wrong when they obvioulsy used the most pessimistic scenario possible. It is bemusing and uncompelling when certain vocal fake skeptics demosntrate their one-sided skepticism by nit picking and arguing strawmen, whilst giving Lindzen et al. free pass on their egregious errors. Lastly, it never ceases to amaze me how fake skeptics somehow manage to get stuck in the past (McIntyre is still obsessing about a seminal paper published in 1998), Lindzen and his fellow fake skeptics are infatuated with the first IPCC assessment report from 1990 (that was 22 years ago folks!), and Michaels is obsessed with a Hansen et al. paper written back in 1988. So much for their claims about advancing the science ;)
    0 0
  24. Err @22, " We used the 0.3 degrees per decade from the prediction of the FAR BAU" Is that the royal "we" or is the fake skeptic on this thread claiming to be a co-author of the diatribe written by Lindzen et al.? Otherwise, the onus is on Lindzen at al. to demonstrate and justify exactly how they arrived at that trend-- not their self-designated apologists. And said fake skeptic also has a rather inflated sense of entitlement as to which grievances of theirs must be addressed.
    0 0
  25. Thanks keith, tom, dana, wingding, Uncle Tom Cobbley and all. I am constantly amazed at people unable to take advantage of a menu. The FAR offers a range of 12 choices without knowing which of them will turn out to be applicable. . 20 years later, it's perfectly obvious which of the original 12 are and are not still on the table. To make comparisons, we look for the best match with the inputs, then compare with the data for outcomes. What's so hard about that? Or am I missing something.
    0 0
  26. Albatross @ 23 You make the same mistake as Keith Pickering by saying the authors of the WSJ article use the "very high end of the climate sensitivity range" They don't - as I pointed out. I'm sorry that I couldn't see anything else through your rather insulting rhetoric. Keith Pickering - I'm surprised you used a 'corrected' graph to try to work out the predicted temperature rises from the FAR. They are spelled out in words (and the graphs constructed subsequently). The FAR is very clear in its predictions. As I noted, it means the WSJ line is closest to the 'best' estimate, not the highest. It's worth pointing out the caveat noted by the IPCC [because for some reason or other, nobody here has seen fit to mention it..] which is that WG3 estimates of what the BAU emissions would be were 20% higher than the estimates used for the model predictions. The message being, of course, that the IPCC FAR predictions could actually be quite conservative.
    0 0
  27. The indignant claim is made @10 that: "The upper and lower uncertainty limits were, of course, model results from runs with 1.5 and 4.5 degC/2xCo2. Now, my point was that you never mentioned ANY of this in your article. You never mentioned the word "prediction" once." Someone clearly failed to read the OP. The emission scenarios and sensitivities (and various cominations) are listed in Table 1. The word "prediction" or "predictions" appears five times in the post. The fake skeptic also claims @10 that: "On the Realclimate thread Professor Barry Bickmore called the predictions "way off" and Gavin said they were "wrong"." This is what Gavin Schmidt actually said: "[Response: Note that projections are a function of two things - the scenario and the model. What was wrong in FAR was the scenario (too fast growth rate of GHGs, no aerosols, no ozone, no BC etc.), not the model (though the projections were with simple emulators not GCMs). Indeed, models today have similar sensitivities and with the same scenario will give the same temperature rise. - gavin]" So the claim in the WSJ made by Lindzen et al. that their graph demonstrates "that the projections exaggerate, substantially, the response of the earth's temperature to CO2" is pure and utter nonsense, and Gavin Schmidt does not buy it either. Someone here is being disingenuous and it is not SkS. Also, Lindzen et al. claim that "when one examines the historical temperature record throughout the 20th century and into the 21st, the data strongly suggest a much lower CO2 effect than almost all models calculate" is demonstrably false. See, for example, Hegerl et al. (2006). More recently Huber and Knutti (2011) who found looking by the conservation of energy over the instrumental record that: "The resulting distribution of climate sensitivity (1.7-6.5 C, 5-95%, mean 3.6 C) is also consistent with independent evidence derived from palaeoclimate archives." Lindzen et al. are wrong, so it is perhaps understandable why the fake skeptics continue to try and distract everyone from that inconvenient fact.
    0 0
  28. Adelady @25, No you are not missing anything.
    0 0
  29. Albatross I'm sorry to see that you're not interested in discussing this issue - apart from ad hom sneers, you have steadfastly refused to engage with my criticism. Why would that be? You also make the false assumption that my purpose is to defend Lindzen et al - you are very much mistaken. If you read my comments, you will see that I was agreeing with Professor Bickmore that the FAR predictions were "way off" and in doing so, made a comparison the the rather different (and unjustified) claims by SkS. I found one example of the word prediction in the OP, and it didn't refer to the FAR predictions!! Perhaps you're counting the title and the SkS logo? Still, you haven't made an attempt to justify changing the language of the FAR and its central prediction - which has been expunged from the above post.
    0 0
  30. Anteros, "You make the same mistake as Keith Pickering by saying the authors of the WSJ article use the "very high end of the climate sensitivity range" They don't - as I pointed out." Are you one of the signatories? Where in the WSJ article did they spell it out how they arrived at that slope? If it makes you feel any better, I find your condescending tone and recalcitrant attitude both here and at RC equally insulting. Regardless, the entire premise of Lindzen et al's graphic is false as I showed at 27 above. Any reasonable person will be able to recognize that. You continue to undermine your credibility and claim of being a true skeptic when you continue to give the disinformers who signed the WSJ article a free pass, and also when you attempt to distract everyone from their multitude of errors and distortions and misrepresentations. Do whatever your belief system compels you to do, but it will not and cannot change the facts or the physics. The climate system will continue to accumulate energy (at varying rates) in response to the positive planetary imbalance initiated by humans increasing GHGs and triggering positive feedbacks. Good night.
    0 0
  31. Anteros 29, For the record I do not happen to agree with Dr. Bickmore's characterization of the FAR prediction. You clàim "You also make the false assumption that my purpose is to defend Lindzen et al - you are very much mistaken" That is not an assumption at all, it is based on your obsession with semantics while completely ignoring the multitude of errors, distortions and half truths made in the WSJ by Lindzen et al. I have yet to you on this thread take issue with the egregious errors made by Lindzen. How about you demonstrate for us that you are a true skeptic. Please list for us all here a list of the errors, distortions and problems in the two WSJ articles written by Lindzen et al. There are many to choose from so it should be fairly easy for you to spot them. Go for it. This thread is about Keith's OP and Lindzen et al's failed attmept to claim that the models exaggerate climate sensitivity-- again the entire premise of their argument is false. Also, you originally claimed that Keith never used the word "prediction" in the above OP, when you were shown that was wrong instead of conceding error you go ahead to make another false claim, "I found one example of the word prediction in the OP, and it didn't refer to the FAR predictions!!". Actually, it appears five times above, three times in relation to FAR. So far you have misrepresented Gavin Schmidt's position on this issue, accused Keith of erasing/removing text from FAR, and have demonstrated that you are not amendable to reason. You are kidding yourself at this point if you still believe that you have any credibility or that you are behaving as a true skeptic would.
    0 0
  32. Keith Pickering - Can I enquire how you got your figure of 0.35C per decade for the 'high' sensitivity and the BAU scenario? I ask because the FAR states that it is 0.5C per decade. This is obviously behind the disagreement about which sensitivity the WSJ authors used to derive their graph.
    0 0
  33. Anteros @31: >>>The reason this is obviously incorrect is that the slope most closely matches the BAU prediction of 0.3C per decade. No it doesn't. You have not sufficiently addressed what I stated at 12, and Tom at 13, that the 0.3/decade trend is the average over the whole period, and is not the rate at the beginning of the time period - your point about 1˚C by 2025 brings the rate down to 0.286˚C/decade, NOT your 0.32˚C/decade, and what more you're still committing the same fallacy by averaging over a time period longer than the one you're trying to observe (i.e., the trend is less than 0.28 for the first two decades). Even more importantly, you have yet to respond to the points that AR1 BAU did not happen, and that their forcing relationship was overstated in AR1.
    0 0
  34. Pardon the all caps NOT at my previous post mods, if you could either cross it out or fix it that would be appreciated. I had started to write several of those in, but caught myself - obviously not fully though.
    0 0
  35. Albatross - You misrepresent me by saying I claimed Keith never used the word 'prediction'. I referred to the original post, as you did, and which was discussed at RC - which you have referred to yourself. Keith's post wasn't even written then. As I said, I found no references to the FAR predictions - the word appeared not to exist. If you're giving people free passes this is what you're letting through. I'm sorry you feel the need to descend to a list of accusations. And it's a pity you insist on making false assumptions about what I am or what I believe.
    0 0
  36. Alex C - So is the slope in the WSJ article closer to the 0.5C of the 'high' sensitivity? To your apparently substantive point - of course, the BAU predictions were wrong. That is the main reason the FAR prediction was wrong. My point is that it is important to admit it was wrong, before learning the relevant lessons.
    0 0
  37. Anteros @37: I'm not of the opinion that the original WSJ article was referring to the high-end scenario. I think that your explanation of how the trend was obtained is understandable to reject that notion; however, I think that the means by which the 0.32 figure was obtained is incorrect. I also do agree that the AR1 prediction was wrong. It was based off of an incorrect projection of emissions (which is rather independent of the model, but anyways...), and used a slightly overestimating relationship between CO2 concentration and forcing (and maybe with other gases? I haven't looked into that). I think that the more recent models are much more reliable, being more sophisticated in both variable inclusion and also in resolution.
    0 0
  38. I too am interested in how the 0.24 figure was obtained. I myself just did rough pixel-counting to get 0.5˚C over the time period in question (1990-2010), though that's not nearly as substantive as having the decadal means. I unfortunately cannot download the data, it's available here: http://cera-www.dkrz.de/WDCC/ui/Compact.jsp?acronym=IPCC-DDC_FAR_GISS_SCA but one needs to have a login to obtain it. Unless someone else knows of where this is available on the web...?
    0 0
  39. Anteros @31, "You say I "claim to be a true skeptic". This is totally false - I have never made such a claim, and it seems you have made many other incorrect assumptions too." I'm really not sure how to interpret this, I was giving you the benefit of the doubt when I stated that you claim to be a true skeptic-- that is the deafult position, at least for a good scientist. But by your own admission you now state that you are not a true skeptic. That is a rather odd assertion for you to make. How Lindzen et al. arrived at that slope is actually not immediately obvious, because they failed to provide specifics. But this is actually all moot-- because what you keep failing to recognize is that the entire premise for their claim that the models are wrong relied on that figure, when the figure in fact does not support their claim. BAU did not happen as expected, as was explained to readers in the above OP, but Lindzen et al. did not share that with their audience. Now I am open to the possibility that Keith erred in his calculations in Table 1. Right now, however, it appears the only way of obtaining a slope of 0.3 C or more for 1990-2010 is to use BAU and a CS of 4.5 C.
    0 0
  40. Anteros, "You misrepresent me by saying I claimed Keith never used the word 'prediction'. I referred to the original post, as you did, and which was discussed at RC - which you have referred to yourself." I find it ironic you taking exxception to people (accidentally) misprepresenting you when you misrepresented Gavin Schmidt. However, that I misrepresented you was unintentional (it really was), and I apologise for that. Here we tend to speak to the thread at hand, so I naturally assumed that you were discussing Keith's post. Unfortunately, you seem determined to be hung up on semantics-- one needs to step back and look at the bigger picture and the topic of this thread-- Lindzen using a chart that does not support his claim that the models exaggerate the warming (i.e., climate sensitivity). Surely we can all agree on that point. Do you agree that their claim that the instrumental record supports a lower climate sensitivity is not supported by the literature, as I showed in my post 27 above. It is late here and I need to sign off. Alex makes some good points,and I hope that he can access the actual data instead of estimating trends off charts. Maybe we`ll get to the bottom of this yet. I look forward to seeing your list of errors made by Lindzen et al., whenever you get around to it of course.
    0 0
  41. Anteros @36, the original SkS post on the FAR contains the word "predictions" twice - once in the title and again when referring to "Broecker's 1975 prediction". Your original claim was,
    "Now, my point was that you never mentioned [any] of this in your article. You never mentioned the word "prediction" once."
    Clearly that claim is false. Grow a set and admit error.
    0 0
    Moderator Response: [Riccardo] unclosed tags fixed
  42. Anteros @22, I am happy to concede that you used whatever method you claimed, but unless you are one of the authors of the WSJ article, or have received private communication from them, your conjecture about the method they used has no more standing than does Keith Pickering's conjecture. Never-the-less, let us assume that you are right. So, suppose we examine the IPCC FAR to see what their prediction of temperature rise was for the first few decades of the 21st century. From the executive summary of Chapter 6, we read:
    "e) Based on the IPCC Business as Usual scenarios, the energy-balance upwelling diffusion model with best judgement parameters yields estimates of global warming from pre-industrial times (taken to be 1765) to the year 2030 between 1.3°C and 2.8"C, with a best estimate of 2.0°C. This corresponds to a predicted rise trom 1990 of 0.7-1.5°C with a best estimate of 1.1oC. Temperature rise from pre-industrial times to the year 2070 is estimated to be between 2.2°C and 4.8°C with a best estimate of 3.3°C This corresponds to a predicted rise from 1990 of 1.6°C to 3.5°C, with a best estimate of 2.4°C"
    You will notice that: 1) The best estimate temperature rise from 1990 to 2030 is 1.1 degrees C, or 0.275 degrees C per decade. That is 11.3% less than the trend shown by the WSJ article (estimated as 0.31 C per decade by pixel count on the graph), so on your terms they have over estimated the IPCC FAR prediction by 12.7%. That is the very best that can be said for your,and the WSJ 16's case, and it isn't much. 2) The best estimate temperature rise from 1990 to 2070 is 2.4 degrees C, or 0.3 degrees C per decade. That is 9% greater than the projected trend per decade from 1990 to 2030. Therefore your frequently made contention that the IPCC FAR "predicted" a constant rate of temperature increase over the full century is false. Therefore you are not justified in using the stated average trend over the full 110 year period from 1990 to 2100. 3) The prediction comes with an error range, the low end of which is a 0.7 degree C rise from 1990 to 2030. That corresponds to a decadal trend of 0.175 degrees C per decade. This compares to the 0.185 degrees C per decade from the instrumental record (GISTEMP) over the period 1990-2011 (0.16 HadCRUT3, trends from woodfortrees.org). The IPCC FAR clearly indicated that short term variability would prevent a monotonic increase, saying:
    "Because of other factors which influence climate, we would not expect the rise to be a steady one."
    Therefore to show that their "predictions" had failed, you would need to show that temperature increases had fallen outside error range on all temperature series. Clearly, neither you nor the WSJ 16 have done so. What is more, purporting that "... the projections exaggerate, substantially, the response of the earth's temperature to CO2 ..." while not showing the error bars on the prediction, when those error bars show the prediction has not yet been falsified is deceptive conduct. So much can be said using your, and (as you claim) the WSJ 16's standard. That is, even if their approach was correct, they have significantly overstated the predicted trend, failed to acknowledge that the trend increases over time during the century, and failed to show error bars which would refute their primary claim in relation to the graph. But their standard is not correct. It amounts to interpreting a conditional as a direct statement. In every location that the IPCC FAR makes a temperature "prediction", they actually make three or four, specifying a prediction under BAU, and then specifying the prediction for other forcing scenarios. Therefore they do not predict that temperatures will rise by 1.1 degree C by 2030. Rather,they predict the temperature increase on the assumption of one forcing scenario, and then specify it for other forcing scenarios. Therefore it is not true to say they predicted a given temperature increase without specifying the forcing scenario used. There predictions have the logical form of: If forcing scenario A, temperature range A. As is shown above, the actual forcing scenario followed was scenario D, and therefore the IPCC FAR prediction for events as they turned out is their prediction for scenario D. A case can be argued that we should adjust the IPCC FAR predictions to account for their overestimate of the forcing of a doubling of CO2, which they overestimate by 110%. In that way you would make their "predictions" conditional on changes in GHG concentrations rather than on changes in forcings. Based on that, an actual forcing of +0.63 W/m^2 should be treated as a forcing of 0.7 W/m^2 in assessing their predictions. On that basis we should use their scenario C predictions (0.18 C/ decade) rather than their scenario D predictions. But there is no basis for using their scenario A predictions, because the projected changes in GHG concentrations did not come to pass. This insistence that conditionals be treated as direct statements is bizarre. Done consistently, it literally allows you to infer anything you want, and hence is the sign of a fool. Done strategically it is the sign of a scoundrel who has no compunction in ignoring rational reasoning for rhetorical purposes. It is of a piece with your still unacknowledged, and still unapologetic misquotation of the IPCC FAR.
    0 0
  43. Anteros, I am really confused by your "predictions" "projections" issue. I have looked through the IPCC FAR chapter 6, the modelling chapter, and the title of sub chapter 6.6, containing the modelling results, clearly states - 6.6 Projections of Future Global Climate Change. The chapter itself contains the word predictions twice. Both occasions in the introduction when discussing types of climate models. The word prediction never occurs in the sub chapter 6.6.
    0 0
  44. Maybe we need to include some definitions taken from the TAR. Unfortunately they didn't seem to do a glossary for the FAR. Climate prediction A climate prediction or climate forecast is the result of an attempt to produce a most likely description or estimate of the actual evolution of the climate in the future, e.g. at seasonal, interannual or long-term time scales. See also: Climate projection and Climate (change) scenario. Climate projection A projection of the response of the climate system to emission or concentration scenarios of greenhouse gases and aerosols, or radiative forcing scenarios, often based upon simulations by climate models. Climate projections are distinguished from climate predictions in order to emphasise that climate projections depend upon the emission/concentration/ radiative forcing scenario used, which are based on assumptions, concerning, e.g., future socio-economic and technological developments, that may or may not be realised, and are therefore subject to substantial uncertainty.
    0 0
  45. Apologies, It seems I failed in reading the executive summary. The word predicted appears in point e) in relation to the BAU scenario. However the BAU scenario assumes a certain emission trajectory and radiative forcing and therefore can be seen as a prediction. I feel like I am quibbling over semantics. For me the important point I am taking from this article is that a large proportion of the uncertainty in climate models lies with the assumptions made in the scenarios. This for me increase my confidence in the actual models.
    0 0
  46. Tom Curtis - I'm a bit baffled. You state that the word prediction is in the title of the SkS article. Indeed - that would lead one to believe there was going to be some reference to the IPCC FAR prediction. There isn't - at all. It is indeed true that the word is allowed in reference to a 1975 paper. This seems to me to prove my point - and I apologise for not anticipating some astonishing pedantry. It is true, then, that the word 'prediction' occurs once in the article, having nothing whatsoever to do with the IPCC FAR. Do you have any concern about why the predictions of the FAR vanished completely in an article about the FAR predictions. If the WSJ authors had done that, what might you have (legitimately) said? You claim that the FAR prediction comes with an error range. Again, indeed it does, but the limits of that error range (the specified uncertainty) are merely the two other CS's considered - 1.5 & 4.5C/2xCo2. For the BAU scenario and the best estimate of 2.5C/2xCo2 there is only one prediction - 0.3C per decade. Whatever quibbles there are about hundredths of a degree, the claim that the WSJ line is nearest the 'high' sensitivity is false. It is nearest the best estimate. I should repeat, again, that from the very beginning of this thread (and the thread at RC which prompted this one) I have made the point that I agree with Professor Bickmore's view which drastically disagrees with the original SkS article. That was - and is - the motive for my commentry. Hyperactive Hydrologist - the predictions of the FAR given to the relevant world leaders by the IPCC were specified in both the SPM and the Overview of the FAR. Tom Curtis quotes them @ 13. As I have mentioned previously the 1992 UNFCCC was constructed and signed on the basis of the FAR predictions. The fact that, as Barry Bickmore says, they were "way off" is not something to sweep under the carpet or to pretend never happened. Before moving forward with better predictions (as happened by SAR '95) it is surely important to admit that the predictions were, in fact, "way off". To hide from that fact is disingenuous.
    0 0
    Response:

    [DB] To be clear, the individual perpetuating "astonishing pedantry" is you.  You entered this thread with a straw-man mis-quote and have been tearing at that house of cards you erected since.

    To hide from that fact is indeed disingenuous.

  47. HH @ 47 To confirm that we're not disagreeing about obvious things. The CS of 2.5 is certainly close to the current best estimate. The predictions indeed have two fundamentally different components - the emissions scenario and the CS. Either (or both) can be the reason a prediction fails to match subsequent events. The emissions scenario was the big error in 1990.
    0 0
  48. I'm sorry, but why are we indulging Anteros's increasingly convoluted semantic 'justifications'? Sirrah. You entered this thread with a false quotation; "Based on current model results, We predict: An average rate of increase of global mean temperature during the next century of 0.3C per decade (with an uncertainty range of 0.2-0.5C per decade)" So far as I can see you have never acknowledged or explained this. So long as that remains the case I see no reason to believe that you are willing or able to discuss matters in good faith. You also seem unable to acknowledge that the BAU emissions scenario did not come to pass. As you say, it assumed that no steps would be taken to mitigate GHG emissions. Instead, we have seen the successful implementation of the Montreal Protocol (hardly a given when the research papers upon which FAR was based were written), the spotty implementation of the Kyoto Protocol, numerous smaller efforts at GHG reduction, and the collapse of the Soviet Union... all resulting in emissions measurably lower than those specified for the BAU scenario. Yet you continue to insist that this BAU scenario, rather than observed emissions, is the 'right' scenario to use for comparison to observed temperatures. Again, why should we take anything you say seriously when you are insisting that we should ignore observed reality? If we take the 2.5C 'most likely' sensitivity range from IPCC FAR, actual observed emissions, and the fact that the IPCC stated warming is expected to be lower in early decades and higher in later (rather than the straight line the WSJ 16 used) then we find the results are consistent with observed warming. The only way you get the IPCC FAR being 'way off' is by insisting on using the BAU Scenario A emissions... which are 'way off' from what actually happened. Thus, your sole objection would appear to be that the IPCC presented an emissions scenario which did not come to pass. In fact, they presented several. Because there was no way they could possibly know what mitigation efforts and economic conditions would exist in the future. Your insistence on focusing only on the highest of those possible scenarios as 'their prediction' is thus perverse.
    0 0
  49. Anteros:
    The emissions scenario was the big error in 1990
    Don't be ridiculous - and don't fallaciously pretend that there was only one scenario. They provided four, precisely because they couldn't predict what the world would do. It's horrendously illogical and deeply disingenuous to complain that predictions predicated on a scenario that did not eventuate are wrong - especially when other scenarios were provided that were much closer to realised emissions. Speaking of which:
    For the BAU scenario ...
    How many times do people have to point out that the BAU scenario never eventuated, and therefore it is invalid to compare BAU scenario projections/predictions with observations before you understand that insisting on such an invalid comparison is utterly fallacious? Every single claim anyone makes about FAR temperature predictions that presume a BAU scenario is moot. Every single one. (Which doesn't leave many of yours in play.) For example, acknowledging that point entirely collapses your argument that the WSJ "FAR" trend line is somehow a valid and non-misleading choice because it is based on BAU/best sensitivity. If that's how they chose it, they are engaging in deliberate deception or deep incompetence. Clearly the only predictions/projections from FAR that can be validly compared directly to subsequent observations are those for scenarios that are reasonably close to the forcings that actually transpired - i.e. Scenario D, or for reasons explored above possibly Scenario C. And that in that case, even the high estimate in the table given in the OP was about 0.25 C per decade averaged over the century (and even less in initial decades), which is already well below the "FAR" trend line drawn by the WSJ. And the best estimate was somewhere between 0.17 and 0.18 C per decade - which is way below the WSJ trend line. The WSJ clearly did not choose the "best" estimate for anything approaching the actual forcings, which means they did indeed exaggerate the FAR projections. What part of this do you disagree with? And if you absolutely insist (although thus far without any supporting evidence) that the written text about predictions/projections is more authoritative than the graphs, then under the only valid scenarios for comparison with observations we have (from the IPCC quote given above):
    "...just above 0.1°C per decade (Scenario C) and about 0.1 °C per decade (Scenario D)"
    (noting that those estimates did not provide uncertainty ranges in the quoted text). That comparison makes the WSJ "FAR" trend line egregiously overstated (i.e. by a factor of more than 3x), wouldn't you agree?
    0 0
  50. Lotharson - I'm not sure you understand actually what a prediction is If the only thing the IPCC was offering up to the world was an estimation of climate sensitivity, the FAR would have been a very short document. It baffles me that you don't understand the comment "the emissions scenario was the big error". Unless you want to backtrack and say it was the climate sensitivity? When you say "the BAU scenario never eventuated you are absolutely right. But you fail to see that it was defined in a specific manner - that did eventuate. In other words "few or no steps were taken to limit the emission of GHG's". So this is why Barry Bickmore said the predictions were "way off" and Gavin Schmidt said they were "wrong" - because they were What is so hard to understand/admit about that? Of the two constituents of the prediction, one of them was very wrong. See Gavin's original comment for clarification if you're still confused.
    0 0

1  2  Next

You need to be logged in to post a comment. Login via the left margin or if you're new, register here.


The Consensus Project Website

THE ESCALATOR

(free to republish)


© Copyright 2024 John Cook
Home | Translations | About Us | Privacy | Contact Us