Climate Science Glossary

Term Lookup

Enter a term in the search box to find its definition.

Settings

Use the controls in the far right panel to increase or decrease the number of terms automatically displayed (or to completely turn that feature off).

Term Lookup

Settings


All IPCC definitions taken from Climate Change 2007: The Physical Science Basis. Working Group I Contribution to the Fourth Assessment Report of the Intergovernmental Panel on Climate Change, Annex I, Glossary, pp. 941-954. Cambridge University Press.

Home Arguments Software Resources Comments The Consensus Project Translations About Support

Twitter Facebook YouTube Mastodon MeWe

RSS Posts RSS Comments Email Subscribe


Climate's changed before
It's the sun
It's not bad
There is no consensus
It's cooling
Models are unreliable
Temp record is unreliable
Animals and plants can adapt
It hasn't warmed since 1998
Antarctica is gaining ice
View All Arguments...


Username
Password
New? Register here
Forgot your password?

Latest Posts

Archives

Could climate shifts be causing global warming?

Posted on 7 February 2010 by John Cook

The work of Tsonis and Swanson are often cited as evidence against man-made global warming. Their research suggests our climate is subject to dramatic regime shifts. At key moments, the climate shifts from a warm regime to a cool regime, or vica versa. They claim climate shifts occured around 1910, 1940, 1976 and 2001. Some have interpreted this work to say climate shifts can explain the last few decades of global warming. Richard Lindzen's take is that 'this variability is enough to account for all climate change since the 19th Century'. Is this what Tsonis and Swanson's research shows? The best people to answer this question are the authors themselves as they address this very question in their peer-reviewed work.

The initial paper by Tsonis, Swanson and Kravtsov proposed that climate is subject to a phenomenon called synchronised chaos (Tsonis et al 2007). When examining a number of ocean cycles such as the El Nino Southern Oscillation and North Atlantic Oscillation, it was observed that the various ocean cycles synchronised at certain moments after which climate seemed to shift to a new regime. In 1910, the synchronisation was followed by a warmer regime and several decades of warming. Another synchronisation occured in 1940, switching to a cooler regime. This coincided with mid-century cooling from 1940 to 1970. In the 1970s, the planet began warming again.

Global temperature (HadCRUT) with periods of synchronised chaos
Figure 1: HadCRUT3 global mean temperature over the 20th century, with approximate breaks in temperature indicated. The cross-hatched areas indicated time periods when synchronization is accompanied by increasing coupling (Swanson & Tsonis 2009).

Conventional understanding for the switch to warming in the 1970s is that warming from CO2 overcame cooling from forcings such as sulfate aerosols. Tsonis and Swanson suggest an 'alternative hypothesis, namely that the climate shifted after the 1970s event to a different state of a warmer climate, which may be superimposed on an anthropogenic warming trend'. It's this final phrase, 'superimposed on an anthropogenic warming trend', that Swanson and Tsonis explore further in a subsequent research.

In 2009, they continue to examine the coupling of ocean cycles, stressing 'caution that the shifts described here are presumably superimposed upon a long term warming trend due to anthropogenic forcing' (Swanson & Tsonis 2009). They extend their analysis further in a paper that uses climate modelling to separate man-made and natural variability (Swanson et al 2009). When internal variability is filtered from the smoothed observed temperature (solid black line), the cleaned signal (dashed line) shows nearly monotonic warming throughout the 20th Century. In fact, the cleaned signal fits a quadratic shape which indicates the warming is accelerating.


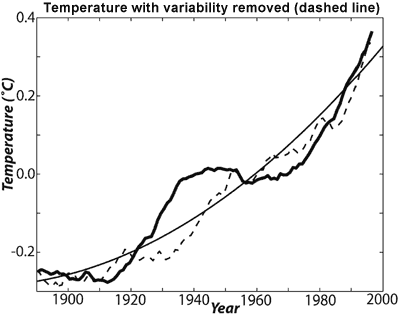
Figure 2: Observed GISS 21-year running mean global mean surface temperature (heavy solid) along with that temperature cleaned of the internal signal (dashed). The cleaned global mean temperature warms monotonically, and closely resembles a quadratic fit to the observed 20th century global mean temperature (thin solid) (Swanson 2009).

If climate shifts do actually occur, Tsonis and Swanson's research finds they are not responsible for the warming found over the 20th Century. Instead, they superimpose variability over the long-term trend which is that of steadily accelerating warming. This is consistent with observations which find the planet has been accumulating heat since 1950 (Murphy 2009). Climate shifts do not stop the planet's energy imbalance. They merely cause temporary slow downs or speeding up of surface temperature warming.

Nevertheless, the theory of climate shifts has some unresolved issues. A key result of Tsonis and Swanson's work is that a shift to a cooler regime occured around 2001/2002. This shift is more marked in the HadCRUT record which is not a global temperature record. When Arctic regions are included, the global warming trend is greater in recent years and hence the 2001/2002 shift is not so pronounced. Hence the theory is dependent somewhat on an incomplete global record.

Another issue discussed in Swanson 2009 is that if climate is more sensitive to internal variability than currently thought, this would also mean climate is more sensitive to imposed forcings. This includes radiative forcings such as a warming sun, cooling from sulfate aerosols or warming from CO2. This leads to a crucial question that the authors themselves raise but don't answer. Conventional thought is that the warming sun and reduced volcanic activity caused much of the early 20th Century warming. Similarly, cooling from increased sulfate aerosols was a major contributor to mid-century cooling. In suggesting climate shifts as the cause, the authors offer no physical explanation as to why the warming sun and cooling aerosols didn't have their expected effect?

Nevertheless, if these issues are resolved and Tsonis and Swanson's theory is found to be valid, it's clear that climate shifts do not invalidate the human influence on climate. On the contrary, they show that underneath internal variability is a long-term trend. Tsonis and Swanson's analysis finds that imposed forcings have exerted a monotonic and accelerating warming trend throughout the 20th Century.

0 0

Printable Version  |  Link to this page

Comments

1  2  Next

Comments 1 to 50 out of 52:

  1. It seems likely that there is some truth to both the sulfate and oceanic heat balance theories. Each has a clear impact on temperatures, but we don't really have sufficient data to determine the magnitudes. We're talking about pre-1970s after all. There were no satellites to measure the sulfate aerosol levels in the atmosphere or the severity of a particular oceanic oscillation... instead we've got estimates. Ditto for the impacts of even earlier volcanic and solar activity. Take different estimates of these factors and you get different results on which has driven temperature shifts over the past century. The article notes that when the Arctic is included the current 'cool' phase is not very pronounced at all. If you look back it can be seen that this actually fits another pattern in the data. Assuming these climate shifts run for about 30 years we can see (as reflected in figure 1); to 1910: Steep cooling to 1940: Steep warming to 1970: Moderate cooling to 2000: Steep warming to 2010: Essentially flat The magnitude of the cooling phases is decreasing... which is consistent with a relatively fixed amplitude up and down oscillation overlaid with an accelerating warming trend. Basically, if Tsonis and Swanson's findings are correct then it looks as if we have reached a point where we no longer have alternating 'warming and cooling' climate shifts, but rather 'warming and flat'... and logically in the next iteration it would vary between 'warming and less warming'. This is why we sometimes hear suggestions that warming could be 'on hold' for another two decades... based on the assumption of this playing out as a 30 year 'flat' phase. Of course, even if Tsonis and Swanson are correct, positive feedbacks which have passed a certain threshold (e.g. Arctic sea ice) could shift the balance and result in resumed warming even during this 'cool' phase.
    0 0
  2. Good and timely post; i bet we'll need point people here a lot in the near future. Indeed, my impression is that this is one of the hardest point to grasp, (multi) decadal cyclical variability, or climate shifts. I noticed a lot of interest in the scientific community on this topic and Trenberth's words, so grossly misinterpreted, every so often come to my mind, it's a travesty that we can not yet account for this variability.
    0 0
  3. A quibble. "Another issue discussed in Swanson 2009 is that if climate is more sensitive to internal variability than currently thought, this would also mean climate is more sensitive to imposed forcings" I don't see how this statement is logically valid. Just because A is sensitive to variability, doesn't mean B is sensitive to variability. 'Variability', whether internal or imposed, must include, by definition, non-variability (ie a subset of variability). Or, in other words, climate can be less sensitive to imposed forcings, because logically, such an effect comes under the definition of 'variable'. It's much like the self-contradictory statement 'everything is possible', which is of course self-contradictory because it would also mean that the impossible is possible.
    0 0
  4. A newly discovered cause of Climate change other than man and potentially more impactful? Wonder if there are other undiscovered causes of Climate change? And perhaps these causes could have more impact than man. Hmmm?
    0 0
  5. thingadonta, while some feedback effects may vary based on the type of forcing, most of the major factors would not. That is, regardless of whether the atmospheric temperature goes up due to CO2 accumulation, increased solar radiation, oceanic heat transfer, or a martian death beam slowly cooking the planet... we know that increased air temperatures will lead to increased atmospheric water vapor, and a significant positive temperature feedback effect from that. The ice albedo feedback is evidently more sensitive to shifts in northern insolation and water temperature, but even so if minor variations in ocean heat distribution were causing significant feedback in arctic sea ice coverage (supportive of high sensitivity for Tsonis and Swanson's results) then an overall increase in ocean heat would perforce show similarly high sensitivity. Ergo, the SOURCE of the forcing is often irrelevant to the imposed feedbacks and overall climate sensitivity. Heat is heat... where it came from doesn't change the effects it is going to have.
    0 0
  6. What caused the warming when the Vikings settled England? What caused the Earth to cool again? What about co2 produced by uncontrolled wildfires for milliana? The earth will cool. The Sun has no effect on the Temps of the inner planets?
    0 0
  7. Karl_from_Wylie, oceanic oscillations are neither newly discovered nor potentially more impactful on climate change than humans. If you read the article above carefully you will see that the issue at hand is whether they are responsible for the comparatively minor fluctuations observed around the ongoing long term human induced warming. Ranger, science has come a long way since the industrial revolution (let alone the middle ages). The fact that past generations could not determine the extent and cause of temperature changes in their time does not mean we cannot do so in ours. Measured variances in wavelengths of infrared radiation clearly show that the wavelengths associated with the CO2 greenhouse effect are responsible for recent warming. We're even making headway in figuring out the causes of those past climate shifts, but without direct observation (which would require a time machine) those are still in question. Also, CO2 from wildfires is insignificant compared to human industry... and the Sun plays an enormous (indeed the primary) role in determining the temperatures of the inner planets. However, the energy put out by the Sun isn't changing in any significant way. Indeed, it went down a minuscule amount while we experienced the steepest warming on record.
    0 0
  8. re#5 The point is, is that you can't infer that because internal variables are climate-sensitive, then 'imposed' forcings are. This is a classic case of 'lumping'. 'Lumping' versus 'splitting' is a classic problem that plagues many disciplines , and I can see now it plagues climate science as well, and, as usual, the 'lumpers' don't even realise that they are making such (invalid) inferences, or probably even that they are 'lumpers'. (Most skeptics I would also suggest, tend to be 'splitters'). The discussion in Swanson 2009 that if internal variables are climate sensitive, then imposed forcings are climate sensitive, is an invalid inferance. John Cook sees no issue with this, so both he, and Swanson 2009, (and also probably the peers who reviewed the paper) are 'lumpers' as well (like most academics and public servants I have come across- ?a case of failure of peer review). To repeat: -automatically inferring that because internal climate variables may be climate sensitive, it means overall the climate is sensitive and/or all climate variables are sensitive, is an invalid inferance. Another example of invalid 'lumping' is eg: -inferring that because the climate has changed significantly in the past from other variables than c02(eg Medieval Warm Period), then climate must be also sensitive to C02-exactly the same case, as above, of invalid lumping. This is a completely invalid inferance. The climate can be sensitive to some internal and/or imposed variables, and not others. We know, from the past, that climate is sensitive to solar variation, orbital changes, oceanic circulation and continental configuration. It may be sensitive to various internal variables, which may also include climate shifts, as discussed in Swanson 2009. All of this does not mean it is sensitive to trace greenhouse gas changes (<0.1% by volume), such as c02.
    0 0
  9. In figure 2, it looks like you could take the portion of the curve between 1910 and 1950, cut, paste and align to about 1970 and things would match up. So over a similar period, roughly the same temperature increase is seen, and yet we are talking about two periods in human history where in the second, the volume of CO2 far exceeds the first, ergo...
    0 0
  10. While Swanson et.al. is at the surface interesting, their hypothesis should be seen as a part of the modeling process and not a competing hypothesis to anthropogenic factors. Swanson wrote a guest article on RealClimate.org (Jul 2009) shortly after his GRL article publication in which he helps clarify the the contribution of his hypothesis to the greater area of study. "What do our results have to do with Global Warming, i.e., the century-scale response to greenhouse gas emissions? VERY LITTLE, contrary to claims that others have made on our behalf."
    0 0
  11. thingadonta at 05:03 AM on 8 February, 2010 "All of this does not mean [climate] is sensitive to trace greenhouse gas changes (<0.1% by volume), such as c02." Well, from that it looks as though you are rejecting what is known about thermal radiation physics, or at least how it applies to C02. If you hypothesize that thermal radiation physics are selectively wrong for the example of C02, you need to show how, don't you? Assuming you don't think our basic understanding of thermal radiation physics is incorrect and/or that our theoretical and empirical observations of what happens when C02 molecules are illuminated at various thermal wavelengths are incorrect, in order to dismiss C02's impact on climate you really need to explain how the climate could be insensitive to the outcome of C02's basic physical behaviors. Unless you're able to demonstrate how we have very fundamental misunderstandings about some very fundamental physics, you inevitably have to accept that net effect of C02 in the atmosphere is to retard the emission of thermal radiation from the top of the atmosphere at a staggeringly large power level. The numerical outcome of additional C02 in a single cm2 column of air reaching the top of the atmosphere may not seem impressive, but take the entire surface of the planet into consideration and it's a whole different ballgame. Knowing the behaviors of C02 with regard to thermal radiation, we can with a pleasingly high degree of confidence predict what will happen when the proportion of C02 in the atmosphere is changed. If C02 in the atmosphere is increased, it will more efficiently retard emission of thermal radiation at the top of the atmosphere. This is not controversial in the slightest. We have no indication that this top-of-atmosphere retardation of thermal emission by C02 is highly variable; unlike other effects having to so with ocean heat transport, solar variation, etc. it is a forcing that is constantly present. The amount of power involved here is beyond our intuitive numeracy to describe. Given sufficient time, there is really no conceivable way it will not affect the climate. If you say otherwise, you're not really credible unless you start at the beginning and show otherwise, in reasonable detail.
    0 0
  12. Doesn't this article still beg the question - wouldn't there have to be something to cause the climate shift? So isn't it likely the other way around... is climate change causing climate shifts?
    0 0
  13. "We know, from the past, that climate is sensitive to solar variation, orbital changes, oceanic circulation and continental configuration. It may be sensitive to various internal variables, which may also include climate shifts, as discussed in Swanson 2009. All of this does not mean it is sensitive to trace greenhouse gas changes (<0.1% by volume), such as c02. " You are right in saying that the reasons you listed dont necessarily mean that CO2 causes climate changes. But that's a strawman argument, as those arent the reasons that CO2 is known to cause climate changes in the first place.
    0 0
  14. RSVP writes: "In figure 2, it looks like you could take the portion of the curve between 1910 and 1950, cut, paste and align to about 1970 and things would match up. So over a similar period, roughly the same temperature increase is seen, and yet we are talking about two periods in human history where in the second, the volume of CO2 far exceeds the first, ergo... " ... ergo, you have trouble reading graphs? Just kidding. 1910 to 1950 is a 40-year period, during which the dashed line goes up by about 0.20C and the quadratic line goes up by a bit less than that. 1970 to 2000 is a 30-year period, during which the dashed line goes up by about 0.25C and the quadratic line goes up by a bit less than that. (In fact, the dashed line stops before 2000, so the 0.25C rise is in less than 30 years). In other words, the recent warming was both greater and more rapid. I hope that helps. Enjoy the rest of the weekend...
    0 0
  15. thingadonta writes: "All of this does not mean it is sensitive to trace greenhouse gas changes (<0.1% by volume), such as c02." I'd like to second Doug Bostrom's surprise at your inclusion of this. Is the small absolute magnitude of the concentration of CO2 in the atmosphere somehow relevant? That factoid is a common staple of unscientific denialist propaganda ("CO2 is only a tiny fraction of the atmosphere, so how can it cause warming?"). It's a bit surprising and disappointing to see it popping up here. If you are seriously uncertain about whether a trace gas could be responsible for a large radiative forcing, please consider the case of halocarbons (e.g., CFCs) which have a substantial radiative forcing from concentrations that are measured in parts per trillion: http://www.esrl.noaa.gov/research/themes/forcing/
    0 0
  16. thingadota, others have addressed most of your points as I would have, but there is one remaining I'd like to answer; "The point is, is that you can't infer that because internal variables are climate-sensitive, then 'imposed' forcings are." Please read my prior response again. This is not an inference. People are saying that climate sensitivity applies to both internal and external forcings because that is DEMONSTRABLY true. AIRS satellite data shows that over many years temperature shifts from many sources (El Nino, La Nina, volcanic dimming, GHG warming, et cetera) were consistently accompanied by shifts in atmospheric water vapor in line with climate models. The source of the warming is irrelevant to the climate sensitivity of the feedback effect. Ditto arctic sea ice albedo feedback. Ditto ocean CO2 absorption temperature feedback. Et cetera. In your own terminology, you are attempting to 'split' the 'effects of atmospheric heat from GHG forcing' from the 'effects of atmospheric heat from ocean heat transfer'... and that's just nonsense. Once the extra heat is in the atmosphere its effects are identical regardless of where it came from.
    0 0
  17. Here's the point, as I see it. 30 years of solar irradiance, volcanic activity & ocean circulation data all point to conditions which should have brought on a modest, long-term *cooling* of the planet, yet instead we experienced a period of the most rapid warming since temperature records were first taken. Also, from what little study I've done on these matters, most natural climate shifts usually take place over centuries (like the Medieval Warm Period & Little Ice Age, which both occurred over multi-century time frames), & yet here we are, today, with the largest magnitude & rate of change we've seen in all of human history. Yet still there are those who are desperate to blame *anything* but the burning of fossil fuels for this situation!
    0 0
  18. Just as I think I am starting to get a handle on global climate change something new comes along. However it does fit. This paper fills the gap between sudden changes observed and gradual increases scientists like to show. If I understand correctly (always doubtful), we have about ten years before it hits the fan again.
    0 0
  19. Tony O'Brien at : It might be 10 years, it might be 15 or 20, or, as suggested earlier, arctic ice melt might be reaching a tipping point (or have already passed it) and it might happen a whole lot sooner. Either way, this research helps our understanding of how the Earth's climate behaves, and will improve future model predictions. In terms of seeing actual impacts from warming, I noticed this story on the ABC News site this morning, suggesting that increased snowfall in East Antarctica is tied to a prolonged and severe drought in the south-west corner of Australia, and that this change is driven by global warming.
    0 0
  20. Tony O'Brien, If we're lucky we have that much time. I have yet to see a real analysis of the impact of the oxidation of methane gas on the rise of CO 2 in the atmosphere. Nor have I seen credible anaysis of the methane hydrate dissociation effect around Lake Baikal, The Beaufort Sea, and other areas where extensive oil and gas drilling have deposited millions of gallons of steam and fresh water under the crust to pressurize wells and bore holes. These hydrates by definition can only form in the presence of fresh water. The oil folks found that out during WWII when their pipes would clog with ch4, and later in the last century when rigs would be destroyed by "mysterious explsions." It may well be CO 2 that does us in in the long run, but it may also be anthropomorphic CH 4 that triggers the short term disaster.
    0 0
  21. I'm sorry I meant anthropogenic
    0 0
    Response: You're not the first to make that mistake and you won't be the last :-)
  22. "but it may also be anthropomorphic CH 4 that triggers the short term disaster" Haha! That brought to mind visions of cheesy 70s Dr Who man-in-a-rubber-suit monsters made of methane-hydrate crystals... :-)
    0 0
  23. Actually, at least on the methane-hydrate side of things, it seems we might have more time than we first thought. According to CSIRO research, the temperature rise needed to melt the methane-hydrate crystals is higher than first thought. That's cold comfort for me though!
    0 0
  24. John, One passage that comes to mind for me in the context of Tsonis and Swanson is the following, "A crucial question in the global-warming debate concerns the extent to which recent climate change is caused by anthropogenic forcing or is a manifestation of natural climate variability. It is commonly thought that the climate response to anthropogenic forcing should be distinct from the patterns of natural climate variability. But, on the basis of studies of nonlinear chaotic models with preferred states or 'regimes', it has been argued, that the spatial patterns of the response to anthropogenic forcing may in fact project principally onto modes of natural climate variability." Signature of recent climate change in frequencies of natural atmospheric circulation regimes S. Corti, F. Molteni, and T. N. Palmer Nature 398, 799-802 (29 April 1999) http://www.nature.com/nature/journal/v398/n6730/abs/398799a0.html Why is it that Tsonis and Swanson believe that shifts in climate regimes happen independently of the net forcing? If what we are dealing with is a chaotic system that is especially sensitive to boundary conditions, which in this case would be to a first approximation the net forcing being imposed upon the climate system, wouldn't it make sense that when the forcing changes the climate regimes change as well? I always think of the reflective sulfates from fossil fuel combustion. Of course the clean air laws that reduced aerosols and their effects during the 1970s didn't change emissions overnight. However, chaotic systems are subject to step -like behavior -- and I would presume that the suddenness of the shift from one climate regime could simply be a result of that. After all, one of the characteristics of chaotic systems is their extreme sensitivity to their environment. But at the level of the attractor (or "regime") this needn't be a mere function of internal variability but may be a more or less predictable response to the environment. If this were the case, I would presume that the same sort of reorganization in the climate mode network would be observed in the shift from one climate regime to another that Tsonis and Swanson see, but the reorganization would itself be a result of the change in the forcing -- natural or anthropogenic.
    0 0
  25. John, you stated in your essay, "Another issue discussed in Swanson 2009 is that if climate is more sensitive to internal variability than currently thought, this would also mean climate is more sensitive to imposed forcings. This includes radiative forcings such as a warming sun, cooling from sulfate aerosols or warming from CO2. This leads to a crucial question that the authors themselves raise but don't answer..." Obviously this is a serious problem for their explanation of twentieth century climate change -- as they understand it. However, if the reorganization of the climate mode network that results in the shift from one climate regime (attractor) to another is to a first approximation a predictable response to a change in radiative forcing, then the sensitivity to internal variability need not be at the expense of a sensitivity to external forcing. Rather, the sensitivity to internal variability might very well be part of the mechanism through which sensitivity to external forcing is expressed.
    0 0
  26. guys, I would like to have a straightforward answer to a simple question. If the climate system is in energetic imbalance indeed, that is OLR (Outgoing Longwave Radiation) is less than ASR (Absorbed Shortwave radiation) as a consecquence of increasing carbon dioxid contents of the atmosphere, it can happen in two ways. Either effective temperature or albedo of Earth (as seen from space) is decreasing. Which one?
    0 0
  27. Berenyi, your starting premise is redundant and incorrect. effective temperature = [(luminosity of star * (1 - albedo)) / (16 * pi * Stefan's constant * distance from star^2)]^(1/4) That is, effective temperature is the black body absorption temperature of the planet adjusted by its albedo and differing from ACTUAL temperature in that it ignores emissivity (from atmosphere and internal heat). Thus, changing albedo changes effective temperature... making your either/or scenario inaccurate, not to mention incomplete since it leaves out the actual primary driver in this case, the changing emissivity of the Earth's atmosphere. Analysis of the decrease in OLR shows that it is heavily focused within the wavelengths of radiation which are absorbed by water vapor and carbon dioxide... in short, the emissivity of the Earth's atmosphere has decreased due primarily to the increase in carbon dioxide and the positive feedback effect that has with water vapor. That said, the albedo of the planet is also decreasing (and thus the effective temperature increasing) as ice melts... another positive feedback impact from the increased temperatures driven by the CO2 increase.
    0 0
  28. 1. In the context of the Swanson’s paper, is interesting this work: "Persistent Positive North Atlantic Oscillation Mode Dominated the Medieval Climate Anomaly", Trouet V. et al., 2009. "According to Trouet, a Pacific La Niña mode and a positive NAO mode could have reinforced each other in a positive feedback loop – and this could explain the stability of the medieval climate anomaly." - says one comment. La Niña ... = cool ocean = Emiliana huxleyi less and less DMS = less clouds = more heat of summer, for example as in 2003 and 2006 year (Europe)... ? 2. Human development - AGW - positive feedback in response on a natural warming? Very interesting theory ... but it has already had formerly Pielke senior. 3. Marcus say: "today, with the largest magnitude & rate of change we've seen in all of human history." This is not true. I recall once again the work of a Al Gore friend’s - L. Thompson's: "Abrupt tropical climate change: Past and Present". (proxies f. e.: delta 18O until 2003, Quelccaya). The current temperature increase is maybe unprecedented, but the former changes were violent. P.S. In Poland, the loading (abnormally long) very cold winter ...
    0 0
  29. CBDunkerson at 22:24 PM on 8 February, 2010: "the emissivity of the Earth's atmosphere has decreased due primarily to the increase in carbon dioxide" Wait a minute. Albedo is supposed to be connected to short wave absorptivity while the emissivity you are talking about is in thermal infrared. They are very different beasts (5778 K vs. 255 K). So. Are you telling us that overall IR emissivity of Earth is decreasing due to GHGs? It would be interesting, since atmosphere below 50 km (30 miles) is in LTE (Local Thermodynamic Equilibrium). In LTE emissivity is equal to absorptivity, according to Kirchhoff's law. If emissivity is decreasing, absorptivity should do the same. It leads us to the conclusion, that GHGs make atmospheric absorptivity LESS, a contradiction in terms. Think again, please.
    0 0
  30. This isn't exactly much of an argument against man-made global warming. Folks need to move on to the more robust ones.
    0 0
  31. There seems to be two separate experiments expressed in the three papers and I'm not sure they are related. Tsonis et al 2007 and Swanson & Tsonis 2009 develop the idea of syncronised NH climate. (Source for fig 1) While Swanson & Tsonis 2009 uses preexisting climate models to extract the 'natural variability" in the climate (source for fig 2) Strangley Swanson & Tsonis 2009 doesn't reference any of the science in either of the other two papers, only picking out a comment about policy implications. In what way does the finding in Swanson & Tsonis 2009 (i.e. Fig 2) rely on the identification of syncronisation in the other two papers? It looks to me not at all. All Swanson & Tsonis 2009 does is pick apart natural and anthropogenic temperature change based on older climate models. While the synchronisation theory suggests that climate over the whole of teh NH are at times linked. The paper trying to tease out the natural variability signal could only identify this in two regions (tropical Pacific and the North Atlantic). John could you explain why you link the work in Fig1 directly to Fig 2 when the original authors make no attempt to do this?
    0 0
  32. Berenyi wrote: "Albedo is supposed to be connected to short wave absorptivity while the emissivity you are talking about is in thermal infrared. They are very different beasts (5778 K vs. 255 K)." First, 5778 K and 255 K are the effective temperatures of the Sun and Earth, as determined by the wavelengths of radiation which they emit. The short wave radiation (aka 'visible light') from the Sun which is not reflected (based on the albedo of the Earth) is instead absorbed, heats the absorbing material, and is thus re-emitted as the thermal infrared radiation you describe as a 'very different beast'. The incoming and outgoing radiation are intrinsically linked regardless of the shift in wavelength... and I'm not sure why you are suggesting otherwise. The changing composition of the Earth's atmosphere is obviously causing changes in its emissivity... indeed, this effect has been measured down to the level of being able to determine the specific wavelengths impacted. Your argument that it is impossible for atmospheric emissivity to change given the LTE of the lower atmosphere is incorrect because LTE refers to equilibrium of the actual MASS of the atmosphere... photons absorbed and re-emitted by the electromagnetic fields of the greenhouse gases may pass through the LTE without impacting it at all.
    0 0
  33. CBDunkerson at 04:34 AM on 9 February, 2010: "and I'm not sure why you are suggesting otherwise" I tell you. Emissivity/absorptivity of materials depend on wavelength. Snow is white in the visible while pitch black (has high absorptivity) in IR. If you put more "greenhouse gases" (the ones having some absorptivity in IR, being transparent otherwise) above an IR-bright surface (which has low absorptivity in the infrared, like quartz sand), the scene starts to look "darker" from above in IR, i.e. the absorptivity is increased. So does emissivity, according to Kirchoff. Well. Your statement "the emissivity of the Earth's atmosphere has decreased due primarily to the increase in carbon dioxide" is not true. Carbon dioxide, as any other "greenhouse gas" increases emissivity. If global effective temperature is constant, average photosphere temperature should decrease. It has to decrease even more to achieve an imbalance between ASR & OLR, provided shortwave albedo (1-absorptivity) does not change.
    0 0
  34. CBDunkerson wrote in 27:
    "... in short, the emissivity of the Earth's atmosphere has decreased due primarily to the increase in carbon dioxide and the positive feedback effect that has with water vapor."
    I think part of the problem here is that people may be equating emission and absorption with emissivity and absorptivity. Emission is the actual rate at which radiation is emitted, either independently of the frequency or in the case of spectral emissivity and spectral absorptivity as a function of the frequency of the radiation. In contrast, emissivity and absorptivity consist of the capacity to emit or absorb radiation, and particularly in the case of greenhouse gases it is important to speak not simply of emissivity or absorptivity, but of spectral emissivity and absorptivity -- as these are very much a function of the frequency -- as indicated by the specific absorption spectra of greenhouse gases. Emissivity and absorptivity are equal under local thermodynamic equilibrium, and as higher levels greenhouse gases increase absorptivity they also increase emissivity -- in the bands in which they act. However, the emission and absorption will typically not be equal. And as a matter of fact, local thermodynamic equlibrium means essentially that emission is independent of absorption as emission is simply a function of the intrinsic properties of matter and the temperature of matter. Please see:
    "local thermodynamic equilibrium – (Abbreviated LTE.) A condition under which matter emits radiation based on its intrinsic properties and its temperature, uninfluenced by the magnitude of any incident radiation. "LTE occurs when the radiant energy absorbed by a molecule is distributed across other molecules by collisions before it is reradiated by emission. LTE is needed for Planck's law and Kirchhoff's law to apply, and is typically satisfied at atmospheric pressures higher than about 0.05 mb. Laser radiation is an example of non-LTE emission." Glossary of Meteorology, American Meteorological Society http://amsglossary.allenpress.com/glossary/search?p=1&query=local+thermodynamic+equilibrium
    The reason why emitted radiation is independent of incident radiation is because absorbed incident radiation is thermalized. Photons are absorbed by molecules that enter a quantized state of of excitation (e.g., bending or stretching which are jointly referred to as "vibrational," rotational, or rovibrational), but then the energy is lost due to collisions with the surrounding molecules before the molecule that absorbed the photon has a chance to spontaneously decay. At 20 mb, a molecule may already be undergoing perhaps a million collisions during the half-life of a given state of excitation. So the wavelength, intensity and angle of the incident radiation is more or less irrelevant. Typically, local thermodynamic equilibrium conditions remain in place until 70 km or above. At lower altitudes the high frequency of collisions will insure the equipartition of thermal energy, resulting in the brightness temperatures associated with different degrees of freedom (e.g., translational motion and a given mode of vibrational excitation) being equal and will be equal to the temperature associated with translational motion. However, at certain wavelengths it may begin to break down as low as 40 km -- at which point non-local thermodynamic equilibrium conditions may then apply. Under local thermodynamic equilibrium conditions, given the equipartition of energy, for each quantized state of excitation a certain number of molecules will always be in that of excitation at any given time. The spontaneous decay of such states of excitation are independent of the length of time that a given molecule has been in that state of excitation. As such a certain percentage of molecules will decay due to spontaneous radiation over any given period of time. Thus the thermalization of absorbed radiation -- in which almost all molecules that absorb photons lose energy through collisions rather than by emitting photons, collisions do not prevent photons from being emitted as such. * But what then are emissivity and absorptivity? Absorptivity is the easiest to define. It is the ratio of incident radiation that is absorbed by a given body, and in the case of spectral absorptivity refers to the ratio of incident radiation at a given frequency that is absorbed by the body. Thus the absorptivity of a true black body would be 1 at any given frequency as it would absorb all radiation. And it is in the context of this last statement that it is easiest to understand the definition of emissivity:
    "emissivity – The ratio of the power emitted by a body at a temperature T to the power emitted if the body obeyed Planck's radiation law." Glossary of Meteorology, American Meteorological Society http://amsglossary.allenpress.com/glossary/search?p=1&query=emissivity
    Likewise, spectral emissivity is the ratio of radiation emitted at a given frequency by the body relative to the amount of radiation that would be emitted by a black body at that frequency. Anyway, for those who are interested, here is a derivation of Kirchoff's law for spectral emissivity and absorptivity: Radiative Transfer http://www.cv.nrao.edu/course/astr534/Radxfer.html The author shows why Kirchoff's law applies under thermodynamic equilibrium and then shows how this can easily be extended to local thermodynamic equilibrium conditions.
    0 0
  35. Continuing with the above comment... Now a little bit about absorption spectra may be in order. First, absorption occurs in bands and bands consist of lines, but the lines themselves are not infinitely thin. They have a wavelike shape to them -- and this helps to understand why even at the surface increasing the partial pressure of a given greenhouse gas generally has the capacity to increase the optical thickness of the atmosphere. At sufficiently low partial pressures of a given greenhouse gas, increasing the partial pressure of the gas will result in a linear increase in the absorption. This will occur right around the center of a sharp peak of absorption. However, as one increases the partial pressure of the greenhouse gas the central peak becomes saturated, but increasing the partial pressure causes the peak to broaden. The range over which absorptivity is nearly 1 broadens, but there are the slopes over which absorptivity gradually drops towards zero. Thus at moderate levels of saturation absorption increases as the square root of the partial pressure. At the surface, methane's central peaks are only moderately saturated, so absorption increases as the square root of the partial pressure -- and consequently so does radiative forcing. At still higher levels saturation more of the additional absorption takes place in the "wings" of the spectral "line." At this point absorption increases as the logarithm of the concentration. This is where both carbon dioxide and water vapor are at, and as a consequence forcing is a logarithmic function of their partial pressures. Please see for example:
    For gases such as halocarbons, where the naturally occurring concentrations are zero or very small, their forcing is close to linear for present-day concentrations. Gases such as methane and nitrous oxide are present in such quantities that significant absorption is already occurring, and it is found that their forcing is approximately proportional to the square root of their concentration. For carbon dioxide, parts of the spectrum are already so opaque that additional molecules are almost ineffective; the forcing is found to be only logarithmic in concentration. http://www.global-climate-change.org.uk/6-5-1.php
    Here are some posts over at Eli's which show how the spectral absorption of carbon dioxide varies according to temperature and pressure — and which point you to an online tool where you can create your own graphs: Temperature Wednesday, July 04, 2007 http://rabett.blogspot.com/2007/07/temperature-anonymice-gave-eli-new.html Pressure broadening Thursday, July 05, 2007 http://rabett.blogspot.com/2007/07/pressure-broadening-eli-has-been-happy.html High Pressure Limit. . . . Sunday, July 08, 2007 http://rabett.blogspot.com/2007/07/high-pressure-limit.html However, what matters most in terms of the enhanced greenhouse effect under current anthropogenic global warming isn't increased absorption near the surface but rather how the effective radiating altitude rises with the increasing partial pressure of carbon dioxide. Most of the relevant spectra in which carbon dioxide acts is already saturated by water vapor at the surface, thus if one were to only increase the partial pressure of carbon dioxide at the surface it would have very little effect. However, water vapor tends to stay much closer to the surface than other gases. It has a scale (or "e-folding") height of roughly 2 km as opposed to 8 km which would be more typical of other gases, including carbon dioxide. It is at the higher altitudes that raising the level of carbon dioxide will really matter. The effective radiating temperature of the earth is roughly -17°C. This corresponds to an effective radiating altitude of roughly 5 km. But by raising increasing the partial pressure of carbon dioxide at the surface, one increases the partial pressure of carbon dioxide at higher altitudes, increasing its absorptivity and therefore raising the altitude where of the atmosphere to thermal radiation one increases the altitude where a photon is radiated without being reabsorbed, that is, where its energy is radiated for the last time and finally escapes to space. However, the higher the altitude the colder it gets -- reducing the emission. Consequently the we have a radiation imbalance in which more radiation is absorbed by the earth's climate system than is emitted to space as thermal radiation. The apparent (or "brightness") temperature of the earth -- as it is viewed at a distance -- decreases because less radiation is able to escape to space. But by the principle of the conservation of energy this implies that the actual amount of energy in the earth's climate system is increasing. For a new thermodynamic equilibrium to be achieved the temperature of the effective radiating layer must increase. But what this implies is that the rate at which radiation is emitted at the surface must increase. How much? Interestingly enough, the temperature drops roughly as a linear function of altitude, and the rate at which temperature drops with altitude. As altitude increases, the atmospheric pressure decreases. Consequently a parcel of air will expand and in expanding it will lose potential energy and cool. And assuming a constant relative humidity, the rate at which temperature decreases with increasing altitude - known as the lapse rate - will remain roughly constant under an enhanced greenhouse effect. So if the effective radiating altitude rises by a certain distance, one can divide that distance by the lapse rate to arrive at the temperature. Tamino goes into this in more depth here: Lapse Rate, July 16, 2007 http://tamino.wordpress.com/2007/07/16/lapse-rate/ Prior to any feedbacks the warming of the surface turns out to be about 1°C per doubling of carbon dioxide. But of course at higher temperatures ice melts -- decreasing the albedo of the earth and increasing the absorption of sunlight. Likewise, water evaporates, with the absolute humidity at the earth's surface increasing by roughly 8% for each additional degree Celsius and roughly doubling for every ten degrees Celsius. Once one takes into account all the feedbacks doubling the partial pressure of carbon dioxide is more likely to raise the temperature by roughly three degrees Celsius. Incidentally, I would recommend checking out: A Saturated Gassy Argument 26 June 2007 http://www.realclimate.org/index.php/archives/2007/06/a-saturated-gassy-argument/ ... and: Part II: What Ångström didn't know 26 June 2007 http://www.realclimate.org/index.php/archives/2007/06/a-saturated-gassy-argument-part-ii/ Anyway, I hope this helps...
    0 0
  36. PS I figure seeing is believing, so I am including a link that may be of interest. The dark redder patches in the following satellite image are where there are higher levels of carbon dioxide at 8 km, and consequently the radiation that escapes to space gets emitted at higher, cooler altitude, decreasing the amount of thermal radiation that makes it to space at a wavelength of 15 ?m: Measuring Carbon Dioxide from Space with the Atmospheric Infrared Sounder http://airs.jpl.nasa.gov/story_archive/Measuring_CO2_from_Space/ And as you can see, the levels of carbon dioxide are highest where the winds would carry the gas away from more heavily populated areas (e.g., the east and west coasts of the United States) prior to dispersing it throughout the atmosphere. On this page you have an image of the distribution of carbon dioxide from July 2003 and July 2007: PIA11186: AIRS Global Distribution of Mid-Tropospheric Carbon Dioxide at 18-13 km Altitudes http://photojournal.jpl.nasa.gov/catalog/PIA11186 As you can see from either image, higher levels of carbon dioxide reduce the rate at which thermal radiation escapes to space -- and as you can see when the two images are side-by-side, there are higher levels of carbon dioxide in 2007 than in 2003.
    0 0
    Response: Thanks for the links, here for the especially lazy reader are the images (but I recommend you click the links anyway):

    Global Carbon Dioxide Concentration
  37. What's amazing about that 2003 image is the pattern over the US and downwind western Atlantic. CO2 concentrations are very high in this area ... but note the slight decrease over the eastern US. I assume this is due to sequestration of CO2 by regrowing forests in formerly cleared agricultural land. If we weren't regrowing all those trees, the eastern US would be as red as the West and the adjacent parts of the Atlantic.
    0 0
  38. Timothy Chase at 16:49 PM on 9 February, 2010: "assuming a constant relative humidity" Timothy, thank you for the thorough discussion of radiation issues. I would never have the patience. Then let me have my question. Why do you _assume_ constant RH?
    0 0
  39. Just a technicians point of view. Climate shifts would just be the earth trying to reach an equalibrium. Seems rational to me, but the very first post describes what looks like is happening. So it seems to me they cannot account for global warming in the long run.
    0 0
  40. Thank you for putting the graphics up John. But I wouldn't necessarily recommend it with what is below... I found something else that may be of interest: a movie showing monthly global carbon dioxide distribution for the months September 2002 to July 2008. Please see:
    The AIRS data show the average concentration (parts per million) over an altitude range of 3 km to 13 km, whereas the Mauna Loa data show the concentration at an altitude of 3.4 km and its annual increase at a rate of approximately 2 parts per million (ppmv) per year. Aqua/AIRS Carbon Dioxide with Mauna Loa Carbon Dioxide Overlaid http://svs.gsfc.nasa.gov/vis/a000000/a003500/a003562/
    Given the fact that measurements are being taken from 3 km to 13 km, at any given time a great deal depends upon the path of the jetstream -- the influence of which you can see in the movie. Likewise you can see the seasonal variation as plants in the northern hemisphere take up carbon dioxide in the spring and summer months and release it in the fall and winter months. They have also overlaid the daily counts an Mauna Loa.
    0 0
    Response: That animation of CO2 distribution from 2002 to 2008 is an even clearer visual depiction of what's happening with CO2 levels, thanks again! I figured this would surely be on YouTube and sure enough, it is. I've embedded it below and also tweeted the YouTube URL.

    " althtml=" ">
  41. I had written in 35:
    Consequently a parcel of air will expand and in expanding it will lose potential energy and cool. And assuming a constant relative humidity, the rate at which temperature decreases with increasing altitude - known as the lapse rate - will remain roughly constant under an enhanced greenhouse effect.
    Bereni Peter wrote in 38:
    thank you for the thorough discussion of radiation issues. I would never have the patience. Then let me have my question. Why do you _assume_ constant RH?
    Thank you for the compliment. As for the "assumption," it is a fairly good approximation of what we actually observe -- and while both dry and moist adiabatic lapse rate are roughly constant, the rate at which temperature changes with altitude is slower with moist air than dry air, so presumably if you had moist air below and dry air above the lapse rate might vary more with altitude. But as I've said, constant relative humidity with respect to altitude is a fairly good approximation.
    0 0
  42. Timothy Chase at 03:31 AM on 10 February, 2010: "it [constant RH] is a fairly good approximation of what we actually observe" How is this observation done? What is the operational definition of "constant" in this context? As far as I can see, relative humidity varies wildly in upper troposphere and lower stratosphere on all spatio-temporal scales. Even fractal-like structures are apparent.
    0 0
  43. Constant Relative Humidity? part I of II Bereni Peter wrote in 38:
    Then let me have my question. Why do you _assume_ constant RH?
    I responded in 41:
    As for the "assumption," it is a fairly good approximation of what we actually observe -- and while both dry and moist adiabatic lapse rate are roughly constant, the rate at which temperature changes with altitude is slower with moist air than dry air, so presumably if you had moist air below and dry air above the lapse rate might vary more with altitude. But as I've said, constant relative humidity with respect to altitude is a fairly good approximation.
    *Bereni Peter now asks in 42:
    How is this observation done?
    Nowadays? I would presume along these lines: Nasa JPL CIT AIRS: Water Vapor Multimedia Satellite imaging using multiple channels. Actually I just had to check:
    In this work we will use profile data for humidity and temperature from the Atmospheric Infrared Sounder (AIRS) to analyze how the atmosphere (mostly the upper troposphere) responds to changes in the underlying surface temperature. We equate this variation with a measure of the first part of the water vapor feedback: a change in climate state changes water vapor and its greenhouse effect. pg.3283, A. Gettelman, Q. Fu (1 Jul 2008) Observed and Simulated Upper-Tropospheric Water Vapor Feedback, Journal of Climate, Vol. 21, pp. 3282-9
    AIRS is an impressive machine:
    The 2378 independent channels on AIRS permit retrieval of an entire profile in the presence of up to 70% cloud fraction over the AIRS footprint. ibid.
    Their results?:
    These results from AIRS and CAM simulations indicate that as surface temperatures increase, water vapor in the upper troposphere increases in observations to maintain nearly constant relative humidity. Thus the water vapor feedback is positive, and yields near constant upper-tropospheric RH. Note that RH can decrease even if specific humidity increases as a result of the nonlinear change of saturation vapor mixing ratio with temperature. The result is consistent with analysis by Soden et al. (2005) using a different model and satellite observations of humidity (from the Special Sensor Microwave Imager) and temperature (from the Microwave Sounding Unit and the High Resolution Infrared Radiometer Sensor), indicating that simulated upper tropospheric temperature response over the observed record was similar to observations and to a constant RH assumption. The result is also consistent with the results of Minschwaner and Dessler (2004). The increase in temperature scales is like a moist adiabat, with increases larger at higher altitudes, similar to Santer et al. (2005). ibid.
    * Bereni Peter continues:
    What is the operational definition of "constant" in this context?
    I am afraid I am not much for operationism.
    0 0
  44. Constant Relative Humidity? part II of II Actually it might help to ask what the "assumption" of constant relative humidity is being used for. In a dry adiabat the lapse rate is roughly 9.8 °C per km. In a moist adiabat we might be speaking of 5 °C per km. But in either case the temperature drops with altitude. And what we are concerned with is what happens to the average temperature at the surface as the partial pressure of carbon dioxide increases. As the partial pressure of carbon dioxide increases, the altitude at which a given wavelength of thermal radiation is saturated will likewise increase. As the average altitude at which the spectrum most affected by carbon dioxide is saturated rises so will the effective radiating altitude. Given a positive lapse rate -- whether it happens to be 9.8 °C or 5 °C -- the temperature at the surface must necessarily rise. Generally, it is estimated simply based upon atmospheric column calculations that the temperature will rise by 1.1-1.2 °C per doubling simply as the result of the forcing of carbon dioxide by itself -- with perhaps a 10% margin of error. Now in terms of estimating the effects of the increasing partial pressure of carbon dioxide upon global average temperature not a great deal is going to be riding on whether a specific column of air has a dry or moist adiabat. It is what is happening to the climate system as a whole which matters most -- and somewhat well-behaved global averages will probably be more than enough. And as a matter of fact this is what Soden (2005) was concerned with. Near constancy not with respect to a given atmospheric column or the tropics, but globally over a 20 year period. Please see:
    Although substantial trends in T12 do occur regionally (31, 32), the globally averaged radiance record from HIRS shows little trend over the 20-year period. This lack of trend has been noted in previous studies (21, 33-36) and is insensitive to the intercalibration of the radiance records from individual satellites (21). The model simulations also yield little trend in global mean T12, implying that there is little change in global mean relative humidity over this period. In fact, the modelsimulated anomalies are nearly identical to those obtained if one repeats the calculation of T12 under the assumption of a constant relative humidity change in the model's water vapor field (21). This confirms that both the observations and GCM simulations are, to first order, consistent with a constant relative humidity behavior. pg. 842, Soden et al (4 Nove 2005) The Radiative Signature of Upper Tropospheric Moistening, Science, Vol. 310. no. 5749, pp. 841 - 844
    If you are looking for uncertainties you probably shouldn't be looking at the forcing but rather the feedbacks. Water vapor? For the most part, probably not. This is a large part of what both Soden (2005) and Gettelman (2008) is about. Aerosols? Perhaps. Clouds? Maybe. But that have come out suggest that clouds are a positive feedback. Meanwhile, we probably aren't really that interested in whether a given feedback is positive or negative, but more the climate sensitivity itself. Climate models based upon physical principles are all converging on a value of about 3 °C. A meta-study sythesizing the results of a fair number of studies for the past 420 million years centers on a value of about 2.8 °C. Please see: Dana L. Royer et al. (24 Mar 2007) Climate sensitivity constrained by CO2 concentrations over the past 420 million years, Nature 446, 530-532 A meta-study from the year before synthesizing still other evidence gives us a range of between 1.5-4.5 °C centering on roughly 3 °C. Please see: J. D. Annan, J. C. Hargreaves (2006), Using multiple observationally-based constraints to estimate climate sensitivity, Geophys. Res. Lett., 33, L06704, doi:10.1029/2005GL025259. When a given conclusion is supported by multiple, largely independent lines of argument, the justification for the conclusion is often far greater than what it would receive from any one line of argument considered in isolation from the rest. No one is able to propose a realistic model with a climate sensitivity of less than 1.5 °C -- not even with all the money at Exxon's disposal. Any such model would be incapable of explaining the swings that we see in the paleoclimate record from the glacials to the interglacials. And to a first approximation, forcing is forcing. If the climate system is more sensitive to solar radiation it will be more sensitive to carbon dioxide -- with the surface being warmed by its backradiation. * Bereni Peter states in 42:
    As far as I can see, relative humidity varies wildly in upper troposphere and lower stratosphere on all spatio-temporal scales. Even fractal-like structures are apparent.
    Not so much on a global scale, apparently -- and that is what matters in terms of the argument. Besides, air pressure certainly varies from day to day -- but no hurricane as of yet has been observed that had an air pressure of less than 850 millibars. Not yet, anyway. And the fractal structures that I am aware of in weather are usually the result of self-organized criticality. Turbulence, perhaps. Not some sort of unbounded fractal structures. However, we should actually expect relative humidity to drop over time -- at least in the continental interiors. Oceans have greater thermal inertia than land. Consequently land has been warming more rapidly than ocean. The water vapor content of the atmosphere is primarily the result of evaporation, and as partial pressure at the surface of water increases by roughly 8% for every degree Celsius and roughly doubles for every 10 °C it is the tropical oceans which are most important in determining the water vapor content of the atmosphere. However, as moist air over is carried over land that is warming more rapidly than ocean the relative humidity will drop since the moisture content remains the same. The result? Less precipitation, more droughts and more severe droughts in the continental interiors.
    0 0
  45. Timothy, thank you for the long elaboration. However, it raises more questions than it answers. I would rather not overrun you with all of them in a sigle batch. If you would bear with me, I am going to serialize them. As a first remark. I am not stressing the ontological bases of operationism, in fact I am a realist (in medieval sense). However, an exact description of operations to get values for certain quanities is indispensable for quality assurance & debugging purposes, especially in calibration and remote sensing. http://en.wikipedia.org/wiki/Operational_definition For example remote sensing of atmospheric water vapor by satellites at first sight requires the solution of the unsolvable. Given the spatio-temporal distribution of pressure, temperature, humidity, trace gases and all the other ingredients of some relevance, it is a straightforward(?) process to calculate radiance spectra at TOA. However, in practice it should be done the other way around. You first measure radiation, then look for a distribution of state variables that would produce the same radiation signature. Unfortunately the transformation is not reversible, that is, a multitude of distributions can produce the very same radiation. The tricky part is to restrict the definition domain so as to make the transform invertible. It is done by constructing a model that does not allow for just any combination of state variables, but only a tiny subset, and if you are lucky, all states conforming to model would generate different radiation output. As you can see, a plethora of a priori assumptions go into choosing the particular model used to calculate atmospheric state backwards from radiance measurements. The question is what are the most important hidden assumptions behind model building for remote sensing purposes? How uniqueness is secured? To what extent "measured" (actually: calculated) values are dependent on model?
    0 0
  46. Different Visions, Part I of II Berényi Péter wrote in 45:
    As a first remark. I am not stressing the ontological bases of operationism, in fact I am a realist (in medieval sense). However, an exact description of operations to get values for certain quanities is indispensable for quality assurance & debugging purposes, especially in calibration and remote sensing.
    Might help if you were to say which quantities. Don't you think? I mean, if you are interested in that some extremely detailed specificity it might help to be specific in terms of what you are looking for, eh? Then again, it might help me to see whether what you are proposing escapes my criticisms of Bridgman. * Berényi Péter continued:
    For example remote sensing of atmospheric water vapor by satellites at first sight requires the solution of the unsolvable. Given the spatio-temporal distribution of pressure, temperature, humidity, trace gases and all the other ingredients of some relevance, it is a straightforward(?) process to calculate radiance spectra at TOA. However, in practice it should be done the other way around. You first measure radiation, then look for a distribution of state variables that would produce the same radiation signature. Unfortunately the transformation is not reversible, that is, a multitude of distributions can produce the very same radiation.
    Well, lets step back for a moment. This morning I went to the coffee shop. I could see where the sidwalk had been made wet by the drizzle in the air. I followed along the sidewalk just fine, turned the corners when I needed to, and recognized when the lights would permit me to cross the street. I was able to recognize all the items of food the coffee shop had available so that I could tell my wife on the cellphone, exhange money, then carry everything home -- navigating the stairs all the way up to the fifth floor. But I can only see three "channels" -- red, green and blue. Birds can see four "channels" - red, green, blue and another color in the ultraviolet range, although the exact wavelength differs from species to species. That color is visible to members of their own species but typically invisible to the birds of prey that hunt them. Rather than seeing a color wheel they see a color sphere. Mammals lost their color vision during the time of the dinosaurs. This was the result of living underground or coming out only at night -- and we only gradually reacquired it. Cats perhaps seeing red. All primates see no more than two -- other than humans which see three, -- well, most of us. But birds? Their ancestors typically remained above ground in broad daylight along with the rest of the dinosaurs. I have heard of a mantis shrimp as well. It is a crustacean, not actually a shrimp, but more closely related to crayfish I believe. They are the only animal that we know of that has hyperspectral vision -- with overlapping channels. They can see 11 or 12 different channels, depending upon the species -- with an additional four narrower channels due to filtering. Polarization? Horizontal, vertical, diagonal, anti-diagonal, clockwise and counterclockwise. Shallow-water hunters in an environment with reflected light and semitransparent prey. Beautiful animals. The AIRS instrument can see 2378 channels. It can see nearly 150 times as many channels as that of even the best mantis shrimp, 600 times that of birds and 800 times that of humans. Polarization? To within 5°, although maybe not as rich a world as what the mantis shrimp sees. Now when you state as I quoted above:
    You first measure radiation, then look for a distribution of state variables that would produce the same radiation signature. Unfortunately the transformation is not reversible, that is, a multitude of distributions can produce the very same radiation.
    ... this problem is as applicable to the vision of a human, bird or mantis shrimp as it is to the Atmospheric InfraRed Sounder -- only more so the fewer the channels that a given animal sees. And as such when you start speaking of all possible combinations of state variables (that is, in one sense or another, all possible physical worlds) that would produce a given radiation signature you are no longer dealing in science but philosophy, and if this is what interests you then I have two other papers that may be down your alley that we might discuss elsewhere: Doubting Descartes and, Something Revolutionary: On The Critique of Pure Reason
    0 0
  47. Different Visions, Part II of II But somehow I don't think that is quite what you are interested in but rather science and the world we know. First of all, it isn't like AIRS is the only instrument we have for examining the world. We have been able to test the principles of radiation transfer in laboratories for over a century - including how they apply to carbon dioxide. We understand the physics underlying blackbody radiation, and that most substances absorb continuously, whereas for certain crystals, alloys, fine dusts and of course greenhouse gases will have well-defined absorption lines. This is what permits us to "fingerprint" them. Furthermore, the exact spectra of such substances have been extensively studied. The HiTran database contains over a million spectral lines. And as I pointed out earlier, we know that as you increase the partial pressure of greenhouse gases the spectral lines broaden -- so assuming you are able to identify a given spectral line as belonging to a particular gas you could presumably identify the partial pressure. Actually I believe temperature would complicate this, but only slightly. Might need one more spectral line. * Berényi Péter continued:
    The tricky part is to restrict the definition domain so as to make the transform invertible. It is done by constructing a model that does not allow for just any combination of state variables, but only a tiny subset, and if you are lucky, all states conforming to model would generate different radiation output.
    Initially sounds like it could be a reasonable approach. Reminds me of a problem in the design of artificial intelligence -- specifically with respect to building a three dimensional model of the world based upon two or more two dimensional "representations." But in this context I believe it is mistaken. By Kirchoff's law we know that what radiation emit they will also absorb, so if the radiation escapes to space along a given absorption line that is saturated below a given altitude, then it must be escaping where saturation gives way to transparency, that is, where the gas ceases to be "opaque" to radiation at that particular frequency. This should be independent of the radiation being transmitted at that frequency in the lower layers of the atmosphere as all radiation will be absorbed at saturation, and the emission of radiation, assuming conditions of local thermodynamic equilibrium -- will be strictly dependent upon the intrinsic properties of the matter -- including its temperature. Consequently, given enough channels and enough unique absorption lines one could peel back the layers of the atmosphere like an onion. Given my analysis it would seem that there is no need for some sort of all-purpose model for computing one unique physical state that would produce the specific full spectrum. All you need are a certain set of well-chosen frequencies for the particular problem at hand. Not the ability to arrive at some unique distribution of all atmospheric constituents in an atmospheric column -- or more widely -- the atmosphere directly above the visible part of the globe itself. But as the atmosphere reaches atmospheric pressures of 20 mb or below non-local thermodynamic equilibrium conditions will begin to take over, and then the intensity of incident light, the angle of incidence and so on will begin to matter -- and it will be time to get out one's Einstein coefficients. And at that point I would presume it is a different ballgame. Advanced climate models incorporate non-local thermodynamic equilibrium radiation transfer theory, but that will be in terms of computing the spectra that a given physical situation gives rise to, not the physical cause of a given radiation signature. But once you start dealing with non-local thermodynamic equilibrium conditions the air is thin enought that it probably won't have that much of an effect upon the climate system. * Anyway, it might help to know that the Nasa JPL AIRS website doesn't simply have pretty pictures and movies. It explains in some detail what the AIRS instrument is and what it is capable of. Please see for example:
    AIRS uses cutting-edge infrared technology to create 3-dimensional maps of air and surface temperature, water vapor, and cloud properties. With 2378 spectral channels, AIRS has a spectral resolution more than 100 times greater than previous IR sounders and provides more accurate information on the vertical profiles of atmospheric temperature and moisture. AIRS can also measure trace greenhouse gases such as ozone, carbon monoxide, carbon dioxide, and methane. http://airs.jpl.nasa.gov/overview/overview/
    It explains how AIRS works, calibrated and gives the specifications and the spectral ranges of the channels. It explains how it is used to improve weather forecasts, test and improve climate models (1, 2, 3, 4 and 5). It provides a portal for requesting data which is free and available to all, access to a database of the peer-reviewed papers that have made use of its products and a selection of those papers. However, if you want the data or documentation, you should probably try: Goddard Earth Sciences Data and Information Services Center http://disc.gsfc.nasa.gov/AIRS/ The data includes quality assurance sets. All data and documentation is free and open to the public. Incidentally, there are limits to what I can do. As should be clear at this point, my idea of aiming high was critiquing The Critique -- and nowadays I am a computer programmer. However, I am sure that they would appreciate someone taking a detailed look at their work. Particularly if they were to point out the flaws and offering suggestions on how things could be improved in a peer-reviewed paper. It is the only way things will improve, you know. Then again the scientists seem pretty happy with it at present.
    0 0
  48. #47 Timothy Chase at 17:58 PM on 11 February, 2010: "Initially sounds like it could be a reasonable approach" It is _actually_ the approach they are using to reconstruct upper/mid troposphere relative humidity distributions using AIRS spectra. The algorithm IS dependent on the (rather complicated) ECMWF global atmospheric model. European Centre for Medium-Range Weather Forecasts ECMWF general circulation model (TL799L91) It is not just philosophy, but a hard fact of life. Have a look at this recent presentation: Applications of Satellite Water Vapor Retrievals to Climate Studies Ming-Dah Chou Department of Atmospheric Sciences National Central University Presentation at the Research Center for Environmental Changes, Academia Sinica, February 3, 2010. http://www.rcec.sinica.edu.tw/Seminar%20files/Presentation%20files/100203(Dr.%20Edward%20Cook)Satellite%20Water%20Vapor%20Retrievals.pdf From "Concluding Remarks": - Global distributions of water vapor can be best derived from Satellite observations. - However, satellite retrievals of water vapor in the upper and lower troposphere encounter inherent difficulties, and the satellite-retrieved water vapor in these important regions is not reliable. So. The question still stands. To what extent "measured" (actually: calculated) values are dependent on model? For the general idea, still used in AIRS reconstructions see: High resolution observations of free tropospheric humidity from METEOSAT over the Indian Ocean. R´emy Roca, H´el`ene Brogniez, Laurence Picon and Michel Desbois Laboratoire de M´et´eorologie Dynamique, CNRS, Palaiseau, France MEGHA-TROPIQUES 2nd Scientific Workshop, 2-6 July 2001, Paris, France. --- At another site, another time I would happily discuss the intricacies of phylosophy. However, it looks a bit off-topic here. As for the multitude of spectral channels. Some women are tetrachromats. I don't think they can grasp reality more accurately than anyone else. Myopic girls could do worse. Anyway, image processing skills of the soul are not understood. On the other hand, things in science are supposed to be understandable. As for doubting Descartes, consider the following tiny piece: 1. If a subphrase of a phrase does not make sense, the entire phrase is senseless. 2. Senselessness is preserved by negation. 3. The negation of "I think (therefore) I am" is "I am not (therefore) I don't think". 4. The phrase "I am not" does not make sense Therefore: Chartesian philosophy is based on nonsense. Google for it. http://www.google.com/#hl=en&q=%22I+am+not%22 --- AIRS fact sheet
    0 0
  49. ... Looks like a very interesting discussion, I look forward to reading some of the comments above. Just to mention a few things: 1. I thought the AMO might account for some of the unforced multidecadal variability in the record, but so far as I know, Tsonis et al did not look at AMO ... did I miss something? Supposing AMO turns out to be the big contributor, why would other modes synchonize specifically at the extrema of AMO or value ranges of the AMO index? Would AMO be the driver or would there be a more complex interplay? If it isn't AMO, how would synchronization at one time cause a temperature trend afterward and not just during? Where is the hysterisis/whatever mechanism? Is the idea that when in a cooling phase, the climate system has been reorganized such that equilibrium has dropped and it is approaching a cooler equilibrium (defined by short-term conditions, whereas the longer-term effects disrupt such an equilibrium but still allow a longer-term equilibrium state that encompasses the internal variability), but then at some point on this approach some negative feedback starts up that shifts the climate system so that the equilibrium is warmer, etc.? I recall once-upon-a-time reading something like the AMO might be caused by variations in salinity in the North Atlantic related to water exchanges with the Mediterranean; I don't remember the proposed mechanism, but trying to put something coherent together right now: perhaps faster flow through the Atlantic would reduce the salinity by diluting the Mediterranean contribution, which would slow the flow through the Atlantic, which would increase the salinity, etc, on a time scale characteristic of the residence time of water within the North Atlantic surface water??? ----- Question loosely related to water vapor feedbacks: I had been under the impression that with greenhouse-forced global warming in general, the tropopause level would tend to cool (the increased height would over-compensate for the surface warming + lapse rate change. Conceivably, this could cause (if the cooling is enough relative to the pressure change, because it is the mixing ratio and not the vapor pressure that actually matters here) some introduction of dryer air (lower specific humidity) into the troposphere (PS more severe thunderstorms?). I hasten to add that this could still be overwhelmed by the greater water vapor mixing ratios from lower level outflows from moist convection, etc, depending on the math... then again, the effect of warming at a given pressure level would be somewhat reduced by an increase in the height of the distribution of inflow and outflow from moist convection following (in proportion or not?) the thickenning of the troposphere. Of course, the thicker troposphere and the cooler tropopause level would both add positive feedbacks (including via cloud tops) - would they balance out the reduction in water vapor concentration they MIGHT cause? Well I wouldn't know enough of the input paramers, etc, to do the calculation, and sense this is purely hypothetical on my part, might as well go with the model output and the observations, and you know how those go... BUT I recently got the impression that am/was wrong about the tropopause level temperature trend, as I saw a paper abstract which suggested that ozone depletion would cause tropopause-level cooling but greenhouse forcing in general would leave the tropopause level isothermal (as stratospheric cooling is more pronounced at higher levels, but this still surprises me a little because I thought at least some nonzero stratospheric cooling was expected down to the tropopause level) (following equilibrium, presumably - disequilibrium might be otherwise)... So I'm wondering, what is actually expected for tropopause level (pressure) and temperature changes for 1. a doubling of CO2, 2. equivalent solar forcing? Berényi Péter Some women are tetrachromats. I assume this alludes to the two different kinds of red cones, and that some people have both types. I've wondered if they could tell, though, or if the two types are too similar in their spectrums and responses? Interestingly, many animals outside of mammals have tetrachromatic vision, while most mammals have less than (numerically) trichromatic vision.
    0 0
  50. Parallel Lines, Part I of II Berényi Péter wrote in 45:
    The tricky part is to restrict the definition domain so as to make the transform invertible. It is done by constructing a model that does not allow for just any combination of state variables, but only a tiny subset, and if you are lucky, all states conforming to model would generate different radiation output.
    In 47, I responded in part:
    By Kirchoff's law we know that what radiation emit they will also absorb, so if the radiation escapes to space along a given absorption line that is saturated below a given altitude, then it must be escaping where saturation gives way to transparency, that is, where the gas ceases to be "opaque" to radiation at that particular frequency. This should be independent of the radiation being transmitted at that frequency in the lower layers of the atmosphere as all radiation will be absorbed at saturation, and the emission of radiation, assuming conditions of local thermodynamic equilibrium -- will be strictly dependent upon the intrinsic properties of the matter -- including its temperature. Consequently, given enough channels and enough unique absorption lines one could peel back the layers of the atmosphere like an onion.
    * Berényi Péter wrote in 45:
    It is _actually_ the approach they are using to reconstruct upper/mid troposphere relative humidity distributions using AIRS spectra. The algorithm IS dependent on the (rather complicated) ECMWF global atmospheric model. European Centre for Medium-Range Weather Forecasts ECMWF general circulation model (TL799L91) Other than the hyperlinks to material on the weather model itself, the webpage you just referred us to states:
    The ECMWF global atmospheric model The ECMWF general circulation model, TL799L91, consists of a dynamical component, a physical component and a coupled ocean wave component. The model formulation can be summarised by six basic physical equations, the way the numerical computations are carried out and the resolution in time and space.
    I am not seeing anything on AIRS Atmospheric InfraRed Sounder or its "use" of a weather model in order to make sense of it sensory data. Nor does it make any sense whatsoever to expect such material. * Berényi Péter wrote in 45:
    It is not just philosophy, but a hard fact of life. Have a look at this recent presentation: Ming-Dah Chou(3 February 2010) Applications of Satellite Water Vapor Retrievals to Climate Studies, Presentation at the Research Center for Environmental Changes, Academia Sinica, February 3, 2010. http://www.rcec.sinica.edu.tw/Seminar%20files/Presentation%20files/100203(Dr.%20Edward%20Cook)Satellite%20Water%20Vapor%20Retrievals.pdf
    This would be Ming-Dah Chou, one of Richard Lindzen's coauthors in: Lindzen, R.S., M.-D. Chou, and A.Y. Hou (2001) Does the Earth have an adaptive infrared iris? Bull. Amer. Met. Soc., 82, 417-432 ... I take it. * Berényi Péter wrote in 45:
    From "Concluding Remarks": - Global distributions of water vapor can be best derived from Satellite observations. - However, satellite retrievals of water vapor in the upper and lower troposphere encounter inherent difficulties, and the satellite-retrieved water vapor in these important regions is not reliable.
    One of the coauthors of the adapted infrared iris? This conclusion doesn't seem that surprising -- given the unfavorable light that satellite observation has cast on the hypothesis. Please see for example:
    [23] The existence of a strong and positive water-vapor feedback means that projected business-as-usual greenhouse gas emissions over the next century are virtually guaranteed to produce warming of several degrees Celsius. The only way that will not happen is if a strong, negative, and currently unknown feedback is discovered somewhere in our climate system. A. E. Dessler, et al. (23 Oct 2008) Water-vapor climate feedback inferred from climate fluctuations, 2003–2008, Geophysical Research Letters, Vol 35, L20704, pp. 1-4 http://geotest.tamu.edu/userfiles/216/Dessler2008b.pdf
    However, did you look into the reasoning that went into the conclusions you quote?
    0 0

1  2  Next

You need to be logged in to post a comment. Login via the left margin or if you're new, register here.


The Consensus Project Website

THE ESCALATOR

(free to republish)


© Copyright 2024 John Cook
Home | Translations | About Us | Privacy | Contact Us