Climate Science Glossary

Term Lookup

Enter a term in the search box to find its definition.

Settings

Use the controls in the far right panel to increase or decrease the number of terms automatically displayed (or to completely turn that feature off).

Term Lookup

Settings


All IPCC definitions taken from Climate Change 2007: The Physical Science Basis. Working Group I Contribution to the Fourth Assessment Report of the Intergovernmental Panel on Climate Change, Annex I, Glossary, pp. 941-954. Cambridge University Press.

Home Arguments Software Resources Comments The Consensus Project Translations About Support

Twitter Facebook YouTube Mastodon MeWe

RSS Posts RSS Comments Email Subscribe


Climate's changed before
It's the sun
It's not bad
There is no consensus
It's cooling
Models are unreliable
Temp record is unreliable
Animals and plants can adapt
It hasn't warmed since 1998
Antarctica is gaining ice
View All Arguments...


Username
Password
New? Register here
Forgot your password?

Latest Posts

Archives

Does ocean cooling disprove global warming?

Posted on 18 May 2009 by John Cook

Last week's post on sea level rise yielded some interesting comments on ocean heat including some new papers I reference below (h/t to Chris). However, I confess my interest waned when the discussion turned to the relative merits of Energy and Environment. While the validity of editor reviewed literature versus peer review is an important issue, such topics yield no actual understanding on the latest developments with ocean heat content. So what does the science say?

The discussion revolves around a paper Cooling of the global ocean since 2003 (Loehles 2009) which looks at ocean heat content as measured by Argo. Argo is a network of over 3000 floats scattered across the globe that measure temperature and salinity of the upper ocean. Loehles finds a cooling trend from 2003 to 2008.


Figure 1: Heat content smoothed with 1-2-1 filter and overlaid with linear trend portion of best-fit model (slope = -0.35 x 10²² J/yr)

As oceans contain around 80% of the climate's total energy, ocean heat is a good measure of what's happening with our climate. So recent ocean cooling has led some to conclude that global warming has stopped. Probably the most articulate article is The Global Warming Hypothesis and Ocean Heat by William DiPuccio. His logic is as follows:

  1. The anthropogenic global warming hypothesis says ocean heat should increase fairly steadily and uninterrupted (monotonic), barring any volcanic eruptions
  2. The ocean has been cooling since 2003
  3. Therefore, the anthropogenic global warming hypothesis is either false or fundamentally inadequate

I might point out that ocean heat should rise whether global warming is natural or anthropogenic (they single out anthropogenic). But that's a minor nitpick. Let's examine points 1 and 2 in more detail.

1. Does ocean heat monotically increase from year to year?

If the climate is steadily accumulating heat, does this mean the ocean heat content will also show a monotonic steady trend? To answer this, we need to view observations of ocean heat content over the past 40 years.


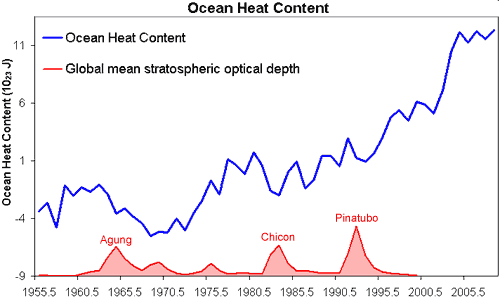
Figure 2: global ocean heat from 1955 to 2008. Blue line is yearly ocean heat content for the 0–700 m layer (Levitus 2008). Red line is the global mean stratospheric optical depth, indicating the timing of major volcanic eruptions (NASA GISS, data ends in 1999).

The longer record reveals short term variability amidst the long term warming trend. Volcanic eruptions (indicated in red by the stratospheric optical depth) impose a short term cooling influence of several years. But there is also variability due to cyclic effects such as El Nino. It's not unusual for the warming trend to slow or even show cooling over several years. It's also worth noting that the Levitus reconstruction doesn't show cooling in recent years - instead a slight warming trend (albeit less than the long term trend). Which leads us to the next point.

2. Has the ocean been cooling since 2003?

Ocean heat is directly measured by buoys that sink through the ocean, measuring water temperature at different depths. The most comprehensive system is the Argo network which was gradually deployed from 2003 through to 2007, with 3388 floats now spread throughout the globe.

There have been early difficulties in measuring ocean heat. Expendable bathythermographs, or XBT's, measured ocean temperatures before the Argo network was deployed. XBT's have been found to introduce a warming bias so when the warmer XBT data was combined with the later Argo data, the most recent trend showed exagerated cooling (more on that here). In addition, some Argo floats have had pressure sensor issues which impose a further cooling bias.

Loehles 2009 uses a reconstruction of Argo data by Josh Willis (Willis 2008). Another analysis of the same raw Argo data was performed by Leuliette 2009 - a comparison of Willis 2008 and Leuliette 2009 can be found in Figure 3:


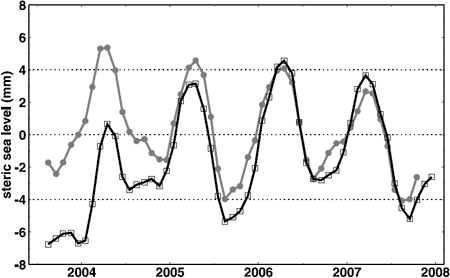
Figure 3: Monthly variations in global mean steric sea level computed by Willis 2008 (gray line) and Leuliette 2009 (black line).

Willis 2008 shows a cooling trend since 2004, while Leuliette shows a warming trend. The primary difference between the two is found early in the Argo record, when there were fewer Argo buoys deployed. Leuliette 2009 suggests the discrepancy between the two seems to be due to poor sampling and differences in how the data was handled. But which dataset is more accurate?

When confronted with two papers offering different results, a useful referree is an independently determined dataset. As well as using Argo data, Cazenave 2009 creates two independent estimates of ocean heat. Sea level rise is comprised of two components: mass change due to melting ice and steric sea level rise due to changes in ocean density. Thermal expansion is the main driver of steric changes (salinity is also a minor factor) so steric sea level rise is another measure of total ocean heat.

The first reconstruction uses satellite gravity measurements to calculate the change in ocean mass. They then subtract ocean mass sea level rise from total sea level rise to calculate the steric sea level rise. The second reconstruction uses satellite gravity measurements to calculate the change in mass of land ice and land water. The sea level rise from this contribution is subtracted from the total sea level rise to obtain another estimate of steric sea level rise. Both reconstructions show a statistically significant warming trend.

Argo offer two data streams - real time where the data is available almost instantaneously and delayed which undergoes more rigorous checks. Cazenave uses only measurements with the highest quality control settings (an approach the folk at Surfacestations would surely approve of). The Argo trend closely matches the other two reconstructions.


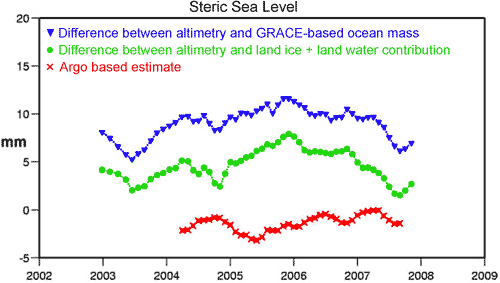
Figure 4: Three reconstructions of steric sea level, with seasonal element removed. Blue curve estimated from the difference between altimetry and GRACE-based ocean mass. Green curve estimated from the difference between satellite altimetry and total land ice plus land waters contribution. Red curve: ARGO-based estimate (Cazenave 2009).

In climate discussions, the most common error is focusing on a single piece of the puzzle while ignoring the big picture. The ocean cooling meme commits this error twofold. Firstly, it scrutinises 6 years worth of data while ignoring the last 40 years of ocean warming. Secondly, it hangs its hat on one particular reconstruction that shows cooling, while other results and independent analyses indicate slight warming.

The bottom line is there is still uncertainty over the reconstruction of ocean heat. Generally, the various reconstructions show the same long term trends but don't always agree when it comes to inter-decadal variability. The uncertainty means one cannot conclude with confidence that the ocean is cooling. Independent analysis seem to indicate that over last half dozen years, the ocean has shown less warming than the long term trend but nevertheless, a statistically significant warming trend.

UPDATE 20 May: John Cross (note that: Cross, not Cook) has emailed me an overview of the Argo system (PDF, 5Mb). It was published on Feb 2006 and answers many of the questions floating around in the comments - worth a read!

0 0

Printable Version  |  Link to this page

Comments

1  2  Next

Comments 1 to 50 out of 55:

  1. Nice overview John. I still don't see where the logic is to say that oceans should be warming uniformly, without any kind of noise.
    0 0
  2. Just trying to understand both points of view and to make up my mind..... for starters why was the argo system deployed ? was it more accurate than XBT ? Did it have more extensive coverage than XBT ? was xpt just running out of steam and needed replacement?
    0 0
    Response: I believe Argo is designed to have more extensive coverage. The Argo homepage talks about how sparse measurements were before the Argo network was deployed (although they might be talking themselves up a bit on this page).
  3. There is a good discussion on this on Physics Forums: http://www.physicsforums.com/showthread.php?t=311982 Just skip over the posts by Saul. The missing piece in this jigsaw is the amount of heat which is transferred into the deeper ocean. ARGO mostly measure up to about 700 meters. Some floats do go deeper but they are a small percentage of total. I think that most people have a hard time understanding that warm water can sink because simple physics tells them that warm water is less dense than colder water and should float. However, there is another contributing factor to density and that is salinity. As the surface waters warm and evaporate the water that is left becomes slightly more saline. As this keeps on recurring the increased density from evaporation causes an inversion (similar to what happens in lakes) and the surface water sinks to deeper depths carrying heat with it. This would occur on a cyclic basis but I have no idea how long it will take for the water to increase in salinity till it is dense enough to sink. Anyone have any thought on this?
    0 0
  4. I feel woefully undereducated on this and should read the papers. But ... why tell you when I can show you?: The most striking feature of Figs 1 & 3, to me, are the seasonal pattern of ocean head content. The peak occurs in Autumn (southern hemisphere) every year. I imagine this is because most of the ocean is in the southern hemisphere and so has completed the half year in which it receives most of its solar energy. Two lazily considered ideas relevant to the discussion of the previous post: (1) measurement has to be pretty good for both Argo and XBT to resolve this signal (the signal is much stronger than noise on a seasonal scale), but it looks like Willis reconstructs this feature better than Leuliette in Fig 3; (2) if the total ocean heat content (estimated from the upper layer) can fluctuate this greatly among seasons, then surely it should be able to deviate from a monotonic annual increase. Both aspects of the first lazy idea argue for recent global cooling, I guess; the second lazy idea, if valid, would argue against it. Sorry for being so lazy! The other thing, though, that might be worth mentioning, is that steric sea level (Fig 4) doesn't seem to resolve any seasonal cycle. Does this suggest that resolution of the seasonal cycle is a poor criterion for evaluating this stuff or does it mean that Cazenave's method is less reliable?
    0 0
    Response: I should've clarified in the figures but Figure 4 shows the steric sea level with the seasonal element removed. This enables you to more clearly determine the trend. Figure 3 does not have the seasonal signal removed. Steric sea level does have a strong seasonal cycle.

    In fact, Leuliette 2009 has an interesting discussion on the seasonal signal. They find that there is a strong seasonal signal of 8mm per year due to ocean mass change, peaking in the Northern Hemisphere summer. Eg - ice melt in the north. The steric sea level peaks in the Southern Hemisphere summer as most of the ocean is in the south, with an amplitude of 3.9mm. Both signals cancel each other out somewhat with the resultant global signal being around 4.2mm.
  5. #2 response [ Response: I believe Argo is designed to have more extensive coverage. The Argo homepage talks about how sparse measurements were before the Argo network was deployed (although they might be talking themselves up a bit on this page). ] So argo is at least designed to be a more accurate and extensive mesurement. So if argo dat is not coinciding with XBT data wouldnt it make sense to more rigorously question XBT data, rasther than the other way around ??? look i know nothing about argo or XBT or any of this- just trying to apply Popper and socrates a bit and see where it leads us
    0 0
  6. Reply to #5: I think the total amount of historical experience is also smaller with Argo than with XBT so, from a rhetorical standpoint, one may be able to argue that Argo isn't as reliable (still getting the kinks out) or wasn't as reliable early on. I work for an agency that uses hydroacoustics to estimate salmon runs -- the agency sometimes switches to newer technology. Of course, it does so to improve accuracy and precision, but early on in the transitional overlap period it would be a mistake to assume the new method is better, even though the agency expects that to eventually be the case.
    0 0
  7. Does argo probe deeper as well??
    0 0
  8. #1 Philippe - I guess the logic would be that the ocean mass is so great that changes in temperature will be very slow, damping out the kind of fluctuations you can get in air. But as Ian points out, this ignores salinity change and mixing of levels. It also ignores changes in the movement of water masses. I may well be misunderstanding something about the logic, but don't such phenomena as La Nina/El Nino argue for at times quite rapid changes in ocean temperature regionally? And wouldn't this be potentially reflected in the movement of other streams in the ocean? But above all, the 5 year sequence shows the same cherry picking that has become so familiar over the last couple of years. I guess the only difference here is that they are arguing that this is a general reflection of global changes because of the energy inertia of the ocean system.
    0 0
  9. A couple of comment about ARGOS vs. XBT. An ARGOS buoy is a full CTD capable instrument as opposed to an XBT which is just temperature. This means that the CTD is recording temperature at a depth calculated from pressure. The XBT is transmitting temperature at a depth that is essentially preset, in other words the depth is found from the rate of sinking of the XBT which has been previously calculated. So it is using an estimated depth. While I have some experience with CTDs I have little with XBTs. however, my gut feeling is that the instrumentation in the CTD is of better quality than the BXTs. Ian, great link to the physics form. Interesting read. One comment, I think that most ARGOs go deeper than 700 meters. I thought that prior to sending out the data most would sink to about 2km than do a full CTD cast all the way up. Regards, John
    0 0
  10. John the information on the depth of ARGO bouys was obtained from this document: ftp://ftp.gfdl.gov/pub/ysc/Global_OA/REV1/replies.pdf I haven't a clue who any of the participants in the discussion are.
    0 0
  11. In an ideal world subject to ideal monitoring, the oceans shouldn’t lose heat while the climate system is in positive radiative imbalance. That seems to be the ideal to which DiPiccuo and Pielke are staking their claims on. That differs somewhat from the surface temperature record where year on year variation can incorporate true temperature decreases since year on year variation in the climate system can “overpower” the very marginal yearly temperature increase due to greenhouse forcing, and the surface temperature isn’t a measure of total heat content in the Earth system. So 2008 with a strong La Nina, and a solar minimum gives a real (and not unexpected) reduced surface temperature compared to the preceding years. However the expectation is that the radiative balance in 2008 is still in positive dis-equilibrium even if the excess radiative forcing is reduced somewhat. So the oceans should continue to absorb heat in 2008, but less strongly. Does that make sense? That’s how I see it… The question then is whether we occupy an ideal world, ideally monitored. In my opinion the latter is the origin of the uncertainties upon which DiPiccuo and Pielke play fast and loose! 1. There does seem to be uncertainties in the monitoring systems. I read the Levitus paper [*] (see fig 2 in John Cooks great summary above) last night, and this analysis, ‘though not the last world probably, does support the conclusion that ocean heat has continued to accumulate during the period from 2003, consistent with the analyses of steric (warming) and mass (glacial melt) contributions to sea level rise in recent papers. 2. The variation in the Levitus data (e.g. the very large jumps in ocean heat content from 2002-2004) is odd and may or may not be real. However if one considers the long term trend, that’s more likely a reasonable measure of the ocean heat uptake. Levitus annotate their Fig 1 (equivalent to John’s figure 2 above) with a trend (1970-2008) of 0.4 x 10^22 J per year. I worked out the trend from 1985-2008 is 0.6 x 10^22 J per year. 3. If the jumps in the data are real, then the most likely explanation might be the redistribution of ocean heat in the way that Dave Horton indicates (e.g. El Nino years excess warmth in the surface waters of large regions of the Pacific; La Nina years more surface heat taken down to the deeper oceans at the expense of more upwelling cold waters). The question then becomes whether these ocean currents take pools of cold or warm water outside the monitoring system, or the measuring of these pools becomes somehow biased as they redistribute in the oceans… 4. So there is some uncertainty over these issues. That’s obviously why we shouldn’t attempt fundamental conclusions on the basis of a few years worth of data! 5. Incidentally, it’s interesting to consider Pielke’s analysis of these issues, which I looked at in response to Ron Cram’s assertions on the preceding thread (see the link to Pielke’s web blog in his first post there). Pielke considers that the ocean cooling (which we now know very likely isn’t cooling at all!) casts grave doubts on our understanding of the greenhouse effect and the consequences of enhancing atmospheric greenhouse gas levels. He asserts that for “a requirement to NOT reject the IPCC claim for global warming“, various criteria of heat content should be satisfied. Thus, for example, the added upper ocean heat content must be (according to Pielke) at least 13 x 10^22 J by the end of 2008, and he asserts elsewhere that the upper oceans should have acumulated 5.88 x 10^22 J in the period end 2002 to end 2008 (if Hansens radiative imbalance GISS model projections are to be satisfied). He then proceeds to ridicule the modelling with a list of years 2003, 2004, 2005, 2006, 2007, 2008 each with “~ 0“ as their accumulated heat content! However if we compare Pielke’s proscriptions with the Levitus data, we find that the accumulated heat in the upper oceans is around 14.5 x 10^22 J at end 2008, and the accumulated heat in the upper oceans between end 2002 and end 2008 is close to 5.8 x 10^22 J. O.K. so we can quibble with this sort of “numerology“, and we accept that these data cannot be treated as being rock certain measures of reality. However the data actually conform to Pielke’s proscriptions, even though he was raising them in an attempt to trash the modelling.....which is interesting....
    0 0
  12. Roger Pielke, the ISI highly cited climatologist referred to above, has blogged on a recent paper by Levitus regarding recent Argo instrumentation problems. He references a number of key papers. The biggest problem with the Levitus paper is that it does not even address the recent lack of warming. http://climatesci.org/2009/05/18/comments-on-a-new-paper... Pielke writes: "Thus, according to the GISS model predictions, there should be approximately 5.88 * 10**22 Joules more heat in the upper 700 meters of the global ocean at the end of 2008 than were present at the beginning of 2003. "For the observations to come into agreement with the GISS model prediction by the end of 2012, for example, there would have to be an accumulation 9.8 * 10** 22 Joules of heat over just the next four years. This requires a heating rate over the next 4 years into the upper 700 meters of the ocean of 2.45 * 10**22 Joules per year, which corresponds to a radiative imbalance of ~1.50 Watts per square meter. "This rate of heating would have to be about 2 1/2 times higher than the 0.60 Watts per meter squared that Jim Hansen reported for the period 1993 to 2003. "While the time period for this discrepancy with the GISS model is relatively short, the question should be asked as to the number of years required to reject this model as having global warming predictive skill, if this large difference between the observations and the GISS model persists.” Also, I contacted Craig Loehle to tell him his paper on ocean cooling was being discussed here. Perhaps he will comment. Also, his paper explaining why tree rings are not valid thermometers has been published. http://www.springerlink.com/content/45u6287u37x5566n/ Loehle and McCulloch also published a corrected 2,000 year temperature reconstruction correlated to temperature without using any tree rings. Interestingly, it did not confirm Michael Mann's Hockey Stick. http://scienceandpublicpolicy.org/images/stories...
    0 0
  13. re #12 Ron, you're not really addressing the subject, but just dumping stuff (what's the relevance of tree rings to ocean heat content?). Let's take Pielke's assertion at face value: "Thus, according to the GISS model predictions, there should be approximately 5.88 * 10**22 Joules more heat in the upper 700 meters of the global ocean at the end of 2008 than were present at the beginning of 2003." O.K. fine. According to Levitus the end 2002 accumulated heat content was around 8.7 x 10^22 J and by the end 2008 it was around 14.5 x 10^22 J. That's around 5.8 x 10^22 J more heat in the upper 700 meters of the global ocean at the end of 2008 than were present at the beginning of 2003. So what's the problem? The accumulated heat seems to be right on the button in relation to Pielke's assertion of what the accumulated heat should be if the GISS model projection is required to be absolutely correct Of course like many measurements in the real world the data are somewhat noisy, and we are all aware of the problems (and the temptation!) of making interpretations based on observations over short periods of time. However one can hardly assert that there are problems with measurements compared to predictions when the measurements are almost exactly the same as the prediction.
    0 0
  14. Chris, Regarding relevance, these papers were also written by Loehle. If Craig comes and comments, I thought others here might want to know about some of this other published work. He has a fairly notable and growing publication record. Where are you getting Levitus's joules numbers from? Pielke writes: "Secondly, the authors did not covert their heat accumulation into Watts per meter squared. This can straightforwardly be completed for each year. Since 2004 in the Levitus et al analysis given above, the global average radiative imbalance is close to zero..." If a conversion would lead to zero radiative imbalance then there is roughly zero heat accumulation in joules. It looks to me like there is a mistake somewhere. It is either yours or Pielke's and given Pielke's remarkable record and reputation as a scientist, I think the mistake must be yours.
    0 0
  15. Chris, Pielke also writes: "The new Levitus et al. 2009 paper, while not discussing this issue, further confirms that global warming, using upper ocean heat content as the metric, has stopped, at least for now. Moreover, the rate of heating in the last 5 years falls significantly below the amount of heating predicted by the IPCC models, as shown in the above figure." http://climatesci.org/2009/05/18/comments-on-a-new-paper-global-ocean-heat-content-1955%E2%80%932008-in-light-of-recently-revealed-instrumentation-problems-by-levitus-et-al-2009/
    0 0
    Response: I find Pielke's line of reasoning very peculiar. He has somehow become firmly convinced that ocean heat is not subject to any internal variability, despite the long term record showing otherwise.
  16. re #14/15 Ron, it would help if you took a considered look at the data rather than just cutting and pasting what someone else says! I'm looking directly at Figure 1 of Levitus (2009): S. Levitus et al. (2009) Global ocean heat content 1955–2008 in light of recently revealed instrumentation problems Geophys. Res. Lett. 36, L07608 which is similar to Figure 2 in John Cook's top article on this thread. That's where the Joules come from! Pielke asserts that the end 2002/start 2003 to end 2008 heat accumulation must be 5.88 x 10^22 J...correct? That's what you wrote in your post #12. Levitus (2009) indicates that the upper ocean heat accumulation is almost exactly that. So there really isn't a problem is there. The observation matches the prediction. Of course the problem lies in Pielke's insinuation that our understanding of the greenhouse effect and the consequences of radiative imbalance is fundamentally flawed, by basing his analysis on an extremely short period of time in which the analysis of ocean heat content is being continually reassessed in the light of problems with the monitoring technology, and implying that (as John has just indicated), the real world must correspond in an idealised noise-free fashion, else the IPCC and climate science has got it all wrong!
    0 0
  17. Chris, I did not realize the full paper was available online. For others who wish to see it, it can be found at ftp://ftp.nodc.noaa.gov/pub/data.nodc/woa/PUBLICATIONS/grlheat08.pdf It appears to me the numbers used by Levitus are slightly different than those reported by Willis and Loehle. However, Levitus still shows no warming from 2004 to 2008. 2004 is about 14 x 10^22J and 2008 is about 14 x 10^22J. I do not understand your point at all, Chris. If there was a radiative imbalance, and in the absence of any other powerful impacts such as a major volcano, ocean heat content should have increased dramatically during those years. This concept is not difficult to understand.
    0 0
    Response: This is precisely why I included volcanic eruptions in Figure 2. To show that even during periods where there are no volcanic eruptions, ocean heat shows natural variability. There are several periods in the long term warming trend where the trend flattens for several years, without volcanic influence. Ocean heat does not rise monotonically, it's a noisy signal.

    Which leads to my second point - when you are looking for a trend in a noisy signal, you do not compare one data point to another. It's a meaningless comparison. You need to statistically include all data points in that period to calculate a trend - simple examples of this are a least square linear fit or a moving average.
  18. Ron Cram, what you say is false since we don't know how much of the heat has been transferred to greater ocean depths.
    0 0
  19. Ian, not true. The Argo floats typically go down to 700m depth. There is no indication heat is being pushed down there. More rarely, even lower depths are sampled. Again, there is no indication heat is being pushed to the lower depths. If lower depths were warming, the ocean heat content estimates would calculate it.
    0 0
  20. The Cazenave paper linked in the article concludes thermal expansion averaged 0.3 mm/year for 2003-2008. That implies an annual OHC change of 0.3E22 J/year or 2.4E22 J total. While not zero, that's still a lot less than 5.8E22 Joules. So the question still is, why is the radiative imbalance lower than expected? Invoking natural variation is dodging the question. All variations have causes.
    0 0
  21. Ron: just as a point of clarification, the typical depth for the ARGO is deeper than 700. In 2006 (before the system was fully operations) 66% went to 1500m and about 1/2 went to 2000m. I would expect that this number has only increased. There are locations where shallower depths are used (the Mediterranean being one), but in general 2,000 is the standard. John
    0 0
  22. re #17 and #20 1. The trend in upper ocean heat content is around 0.4 x 10^22 J per year during the period 1970-2008, and 0.6 x 10^22 J per year from 1985 to 2008 in the Levitus data. According to Levitus the oceans have absorbed ~ 5.8 x 10^22 J of heat in the period end-2002 to end-2008 (I only bring this up since Pielke made a big issue of the ocean heat content increase expected in that period - 5.88 x 10^22 J!). 2. The recent evidence indicates a small continuing steric (warming) contribution to sea level rise during the last few years. This is likely (but not certainly) smaller than the long term trends (see 1) 3. However we know that it's generally unhelpful to make fundamental conclusions from a few years of measurements of parameters (e.g. surface temperature or ocean heart content) in the complex climate system. For example, inspection of the record of ocean heat content (see Figure 1 in Levitus 2009 or Figure 2 in John Cook's top article) shows other periods on the long rising trend of enhanced ocean heat content where the ocean heat content has been static or gone down a tad (the entire period between 1985-1993, for example). 4. What does that mean? Is it real...or due to measurement/sampling error .....or natural variation in the climate system (in this case perhaps involving significant redistribution of heat within the ocean)? Answer: we probably don't know. That's exactly why we prefer to inspect trends over rather longer periods where random error/variation (as opposed to systematic measurement bias) tends to average out.
    0 0
  23. Ron and John Cross, I found a report which gives the following percentages for depth of ARGO floats: (as of 2008) 4000 (11%) could go to 1500 m 6000 (17%) could go to 900 m 13000 (38%) could go to 500 m 12000 (34%) could go to 10 m ftp://ftp.gfdl.gov/pub/ysc/Global_OA/REV1/replies.pdf It looks like the response to reviewers comments for a budget or grant application. If these numbers are true then they are much less than what is commonly believed for deep diving buoys.
    0 0
  24. re: #22, But in a system with long term persistence, which is not an unreasonable assumption for climate, there is no reason to believe longer term trends are any more or less significant than shorter term trends. Measurement error has a random component. The climate at whatever time scale doesn't. It is completely deterministic even if it isn't predictable. There is no evidence I know of that there is a bright line between climate and weather. Thirty years is completely arbitrary. Even then it only means something if you restrict yourself to looking at separate thirty year blocks. Invoking natural variation is a double edged sword. The more you allow, the less certain are projections of future climate.
    0 0
  25. re #24 Certainly the climate is completely deterministic. The question is whether we can "measure" its parameters absolutely. The answer is usually no. After all 2 years ago the evidence indicated that the oceans were cooling quite significantly in the period 2003 to mid 2006. Shortly afterwards it was discovered this measure was an error due to bias in a section of the Argo floats. A reassessment indicated that oceans weren't cooling at all, but that there was still an incompatibility in the direct ocean heat measure and the ocean heat budget determined from a fuller analysis of heat and sea level rise. More recently these incompatibilities seem to have been resolved: the oceans are still continuing to take up heat. So there is obviously some uncertainty in the assessment of ocean heat content. If this is a consequence of random error in the measurement, we’ll certainly have more confidence in long term trends compared to short term trends. 30 years may be arbitrary. But I gave trends during the period 1970-2008 (Levitus et al. specified this long term trend), 1985-2008 and 2002 to 2008. These all show ocean heat uptake at a rate consistent with projections from models. And if we are going to assert absolute confidence in our measures of the deterministic climate and the changes in its parameters, we should ask not only why the oceans haven’t taken up much heat in the period 2003-2008, but why they took up so much heat (2.3 x 10^22 J per year – nearly 6 times the long term trend) during the period 2001-2004…..and essentially no heat in the period 1997-2001…or 1985-1990…. Either that’s all a true measure of the deterministic climate (in which case please explain!), or the long term trend in response to enhanced radiative forcing is overlaid by noise due to a level of inaccuracies in the measurements (or inadequate sampling). I think there has to be quite a bit of the latter....
    0 0
  26. Re:#25, I have no responsibility to explain. It's not my job. However, since 2.3E22 J/year would correspond to a sea level rise of about 2.5 mm/year by itself, and I have seen no evidence of an acceleration in sea level during the 2001-2004 period it is likely that the OHC measurements are incorrect. That would seem to mean the Argo numbers are too high or the earlier XBT numbers are too low. Either way the overall rate of increase in OHC and corresponding radiative imbalance is reduced unless you postulate that there was an increasing cool bias over time in the XBT numbers, which seems rather strained. Smaller thermal expansion and greater ocean mass increase pre-2003 would also be more in line with the Cazenave et al 2009 numbers rather than the IPCC FAR estimates.
    0 0
  27. Ian: Humm, I don't know why the difference in the depth of the ARGOs unless in the paper they are using a subset of the whole dataset. This link shows the data from the buoys around Australia. If you look as the data for each, it would appear that most are getting close to 2,000 m. Regards, John
    0 0
  28. Re: Top post and your response to my #17. John Cook, During the period where you say a flattening has occurred, Argo floats were not the main observation network. OHC estimates were based mainly on SST measurements and these have a number of problems, including inadequate sampling. During this period of time when we have the best data, the data does not fit the theory.
    0 0
  29. John Cook, You are correct that Argo floats typically sample to 2000m. The floats drift at 1000m depth and sample from 1500-2000m depth. I believe some floats go as low as 3500m. Most papers analyzing OHC using Argo data only look at the top 700m. Again, there is no evidence heat is being forced to lower depths.
    0 0
  30. Sorry. My last post was supposed to be directed to John Cross.
    0 0
    Response: Don't worry, you're not the first to make this mistake and you won't be the last.
  31. Chris, Re: #22 You keep repeating the fiction "According to Levitus the oceans have absorbed ~ 5.8 x 10^22 J of heat in the period end-2002 to end-2008 (I only bring this up since Pielke made a big issue of the ocean heat content increase expected in that period - 5.88 x 10^22 J!)." This is not correct. The Levitus paper never uses these numbers. Figure 1 that you pointed to shows flat from 2004 to 2008. Contrary to others, Levitus does show a gain in 2003 but not nearly the level you are claiming. As Dewitt Payne pointed out in comment #20, the Cazenave paper shows heat uptake by the oceans was minimal from 2003-2008. In the abstract, Cazenave writes: "Inferred steric sea level rate from (1) (~ 0.3 mm/yr over 2003-2008) agrees well with the Argo-based value also estimated here (0.37 mm/yr over 2004-2008)." This is not significant warming but it is significantly less than the warming projected by Hansen. OHC estimates showing consecutive flat years in earlier (pre-Argo) periods are much more likely to be the result of instrument error or inadequate sampling than during the Argo years.
    0 0
  32. Ron Cram: Gotta keep your Johns straight. Yes, as I said I am somewhat familiar with the Argo system. However I am not familiar with the 3500 deep ones you mention. The typical Argos instrument is not designed for anything deeper than about 2,500 m. You also say that there is no evidence for warming below 700 meters. So I assume that someone has found problems with Johnson's paper. Do you have a reference for it? I don't remember reading it, but I easily could have missed it. Thanks, John
    0 0
  33. John Cross, My memory seems to have failed me. If you had asked me which floats could reach 3500m, I would have said the Solo floats, but I would have been wrong. The Solo floats typically drift lower at about 1500m but stop at 2000m just like the Apex floats. I am almost positive some sampling is happening down to 3500m but it must not be from Argo. Regarding warming below 700m, again I am relying on my memory. I believe it was Josh Willis who said there was no significant warming below 700m. I could be wrong. I have not read the Johnson paper. Can you provide a link?
    0 0
    Response: The paper John Cross is refering to is Recent Bottom Water Warming in the Pacific Ocean (Johnson 2007). It's quite an interesting paper, thanks for bringing it up John. It finds warming below 3000m and discusses mechanisms to transport heat that deep. Interesting stuff.
  34. Re #31 The Levitus 2009 upper ocean heat content updated by year is very clearly indicated in their Figure 1. This is the Figure with the legend: "Figure 1. Time series of yearly ocean heat content (10^22J) for the 0–700 m layer from this study (solid and from Levitus et al. [2005a] (dashed). Each yearly estimate is plotted at the midpoint of the year. Reference period is 1957–1990." The value for 2002 is near 8.7 x 10^22 J The value for 2008 is near 14.5 x 10^22 J In other words the added upper ocean heat content in the period end-2002 to end-2008 is 5.8 x 10^22 J It's not a fiction Ron. It's as clear as can be in their data. Of course it might not be completely correct. It's obvious that there is significant uncertainty in the measurement of the upper ocean heat content. In general when there is considerable uncertainty in measurements of parameters in the real world, we refrain from making fundamental interpretations and wait until the issues are better resolved. We're usually much safer in making interpretations based on longer term trends.
    0 0
  35. Re #33 There is increasing evidence for enhanced warming of many areas of the deep oceans in recent years. These include the S. Atlantic [*], Pacific [**], Indian Ocean[***], Ross sea [****] (over a longer period), Caribbean [*****]..... Recent evidence indicates a reduced Antarctic Meridonal Overturning circulation with significant Antarctic bottom water warming [******]. Is this a factor in the apparent reduction in the rate of ocean heat uptake in the upper oceans in recent years? I don't think we know yet. [*] Johnson GC et al. (2006) Recent western South Atlantic bottom water warming Geophys. Res. Lett. 33, L14614 [**] Johnson GC et al. (2007) Recent bottom water warming in the Pacific Ocean J. Climate 20, 5365-5375. [***] Johnson GC (2008) Warming and Freshening in the Abyssal Southeastern Indian Ocean J. Climate 21, 5351-5363. [****] Ozaki H et al. (2009) Long-term bottom water warming in the north Ross Sea J. Oceanograph. 65, 235-244. [*****] Johnson GC et al. (2009) Deep Caribbean Sea warming Deep Sea Research. 1 –Oceanograph. Res. 56, 827-834. [******] Johnson GC (2008) Reduced Antarctic meridional overturning circulation reaches the North Atlantic Ocean Geophys. Res. Lett. 35, L22601 abstracts below: ----------------------------------------------------- Johnson GC et al. (2006) Recent western South Atlantic bottom water warming Geophys. Res. Lett. 33, L14614 Abstract: Potential temperature differences are computed from hydrographic sections transiting the western basins of the South Atlantic Ocean from 60 degrees S to the equator in 2005/ 2003 and 1989/1995. While warming is observed throughout much of the water column, the most statistically significant warming is about + 0.04 degrees C in the bottom 1500 dbar of the Brazil Basin, with similar ( but less statistically significant) warming signals in the abyssal Argentine Basin and Scotia Sea. These abyssal waters of Antarctic origin spread northward in the South Atlantic. The observed abyssal Argentine Basin warming is of a similar magnitude to that previously reported between 1980 and 1989. The Brazil Basin abyssal warming is similar in size to and consistent in timing with previously reported changes in abyssal southern inflow and northern outflow. The temperature changes reported here, if they were to hold throughout the abyssal world ocean, would contribute substantially to global ocean heat budgets. Johnson GC et al. (2007) Recent bottom water warming in the Pacific Ocean J. Climate 20, 5365-5375. Abstract: Decadal changes of abyssal temperature in the Pacific Ocean are analyzed using high-quality, full-depth hydrographic sections, each occupied at least twice between 1984 and 2006. The deep warming found over this time period agrees with previous analyses. The analysis presented here suggests it may have occurred after 1991, at least in the North Pacific. Mean temperature changes for the three zonal and three meridional hydrographic sections analyzed here exhibit abyssal warming often significantly different from zero at 95% confidence limits for this time period. Warming rates are generally larger to the south, and smaller to the north. This pattern is consistent with changes being attenuated with distance from the source of bottom water for the Pacific Ocean, which enters the main deep basins of this ocean southeast of New Zealand. Rough estimates of the change in ocean heat content suggest that the abyssal warming may amount to a significant fraction of upper World Ocean heat gain over the past few decades. Johnson GC (2008) Warming and Freshening in the Abyssal Southeastern Indian Ocean J. Climate 21, 5351-5363. Abstract: Warming and freshening of abyssal waters in the eastern Indian Ocean between 1994/95 and 2007 are quantified using data from two closely sampled high-quality occupations of a hydrographic section extending from Antarctica northward to the equator. These changes are limited to abyssal waters in the Princess Elizabeth Trough and the Australian-Antarctic Basin, with little abyssal change evident north of the Southeast Indian Ridge. As in previous studies, significant cooling and freshening is observed in the bottom potential temperature-salinity relations in these two southern basins. In addition, analysis on pressure surfaces shows abyssal warming of about 0.05 degrees C and freshening of about 0.01 Practical Salinity Scale 1978 (PSS-78) in the Princess Elizabeth Trough, and warming of 0.1 degrees C with freshening of about 0.005 in the abyssal Australian-Antarctic Basin. These 12-yr differences are statistically significant from zero at 95% confidence intervals over the bottom few to several hundred decibars of the water column in both deep basins. Both warming and freshening reduce the density of seawater, contributing to the vertical expansion of the water column. The changes below 3000 dbar in these basins suggest local contributions approaching 1 and 4 cm of sea level rise, respectively. Transient tracer data from the 2007 occupation qualitatively suggest that the abyssal waters in the two southern basins exhibiting changes have significant components that have been exposed to the ocean surface within the last few decades, whereas north of the Southeast Indian Ridge, where changes are not found, the component of abyssal waters that have undergone such ventilation is much reduced. Ozaki H et al. (2009) Long-term bottom water warming in the north Ross Sea J. Oceanograph. 65, 235-244. Abstract: We measured potential temperature, salinity, and dissolved oxygen profiles from the surface to the bottom at two locations in the north Ross Sea (65.2A degrees S, 174.2A degrees E and 67.2A degrees S, 172.7A degrees W) in December 2004. Comparison of our data with previous results from the same region reveals an increase in potential temperature and decreases in salinity and dissolved oxygen concentration in the bottom layer (deeper than 3000 m) over the past four decades. The changes were significantly different from the analytical precisions. Detailed investigation of the temperature, salinity, dissolved oxygen and sigma (3) value distributions and the bottom water flow in the north Ross Sea suggests a long-term change in water mass mixing balance. That is to say, it is speculated that the influence of cool, saline, high-oxygen bottom water (high-salinity Ross Sea Bottom Water) formed in the southwestern Ross Sea has possibly been decreased, while the influences of relatively warmer and fresher bottom water (low-salinity Ross Sea Bottom Water) and the Ad,lie Land Bottom Water coming from the Australia-Antarctic Basin have increased. The possible impact of global warming on ocean circulation needs much more investigation. Johnson GC et al. (2009) Deep Caribbean Sea warming Deep Sea Research. 1 –Oceanograph. Res. 56, 827-834. Abstract: Data collected from hydrographic stations occupied within the Venezuelan and Columbian basins of the Caribbean Sea from 1922 through 2003 are analyzed to study the decadal variability of deep temperature in the region. The analysis focuses on waters below the 1815-m sill depth of the Anegada-Jungfern Passage. Relatively dense waters (compared to those in the deep Caribbean) from the North Atlantic spill over this sill to ventilate the deep Caribbean Sea. Deep warming at a rate of over 0.01 degrees C decade(-1) below this sill depth appears to have commenced in the 1970s after a period of relatively constant deep Caribbean Sea temperatures extending at least as far back as the 1920s. Conductivity-temperature-depth station data from World Ocean Circulation Experiment Section A22 along 66 degrees W taken in 1997 and again in 2003 provide an especially precise, albeit geographically limited, estimate of this warming over that 6-year period. They also suggest a small (0.001 PSS-78, about the size of expected measurement biases) deep freshening. The warming is about 10 times larger than the size of geothermal heating in the region, and is of the same magnitude as the average global upper-ocean heat uptake over a recent 50-year period. Together with the freshening, the warming contributes about 0.012 m decade(-1) of sea level rise in portions of the Caribbean Sea with bottom depths around 5000 m. Johnson GC (2008) Reduced Antarctic meridional overturning circulation reaches the North Atlantic Ocean Geophys. Res. Lett. 35, L22601 Abstract: Potential temperature differences are computed from hydrographic sections transiting the western basins of the South Atlantic Ocean from 60 degrees S to the equator in 2005/ 2003 and 1989/1995. While warming is observed throughout much of the water column, the most statistically significant warming is about + 0.04 degrees C in the bottom 1500 dbar of the Brazil Basin, with similar ( but less statistically significant) warming signals in the abyssal Argentine Basin and Scotia Sea. These abyssal waters of Antarctic origin spread northward in the South Atlantic. The observed abyssal Argentine Basin warming is of a similar magnitude to that previously reported between 1980 and 1989. The Brazil Basin abyssal warming is similar in size to and consistent in timing with previously reported changes in abyssal southern inflow and northern outflow. The temperature changes reported here, if they were to hold throughout the abyssal world ocean, would contribute substantially to global ocean heat budgets.
    0 0
  36. I'm confused. For the section titled is the ocean cooling is reference only made to steric sea level changes and none to actual temperatures or heat content? Further, in order for Leuliette to produce a warming trend(from the graph of sea level) you have to start at 2004. If you start in 2005, you have a cooling trend. Certainly, since 2005 the trend per both is cooling of about the same extent. Finally, your final graph seems to show both the green and blue lines below the 2003 level in 2008(just eyballing them) and the red line looks flat. How do you conclude that the last half-dozen years show a warming trend? Cheers, :)
    0 0
    Response: To determine a trend in a noisy signal, you don't compare one point to another. You need to include all the data, not just the start point and end point. This can be done by various means, the most common being a least squares line of best fit. Cazenave uses this method to find a trend of 0.31 ± 0.15 mm/yr to steric sea level rise (when subtracting ocean mass sea level rise from total sea level rise). The trend from the Argo data is 0.37 ± 0.1 mm/yr. Note: the uncertainty is less than the trend which means it's statistically significant.
  37. IIRC, I think Pielke's point vis a vis the deep ocean was that if we allow that heat that would otherwise stay in the upper ocean to get sucked down into the deep ocean, then we can no longer trust predictions of future global warming. How long does this heat stay in the deep ocean before it starts affecting the upper ocean again? If it is 500 years our projections for the next 100 years will be way off. If natural variation is much higher than we already assumed, our basis for concluding that average temperatures in 2100 will be 2.5C warming than today is correspondingly weakened. Cheers, :)
    0 0
  38. Yes, I understand about least squares - however, in this case, the conclusion is misleading at best, at least IMO. You have statistically created a situation where the "trend" is positive over the period, while the actual level of steric sea rise has fallen. What physical meaning does the trend have in this context?
    0 0
    Response: The physical meaning is that ocean heat is gradually building up more energy due to the planet's radiative imbalance and hence is gradually warming. However, upper ocean heat also undergo internal variations through processes like the El Nino Southern Oscillation. So you find these short term cycles imposed over the long term trend. Currently, we've been in moderately strong La Nina conditions which imposes a cooling influence on global ocean heat. I will be adding a new post that goes into more detail on this phenomenon later this week, time permitting.
  39. Ok, that makes sense, if one assumes that El Nino/La Nina etc... fluctuations are independent of the global heat imbalance. It seems to me though, that it is equally likely that EN/LN etc... are one way in which the global heat imbalance is moved closer to equilibrium. I will wait to see the followup. Cheers, :)
    0 0
  40. Sorry for putting in a late comment, but I was just happened to notice a reference to a thread I started on physicsforum. I don't know if you have also looked at: Domingues, C.D., (2008) Improved estimates of upper-ocean warming and multi-decadal sea-level rise, in Nature Vol 453, pp 1090-1093 (19 June 2008) doi:10.1038/nature07080 I found a free copy of the paper here http://www.astepback.com/GEP/Nature%...LR%20rates.pdf What I found interesting is that Domingues actually has 1 standard deviation error bars on his graph which indicate that the pre 1970 data is almost worthless. I wish everybody did their graphs that way. I'm pretty sure the spike from 2002 to 2003 in Leviticus is just an artifact of splicing in the pre-argo data. I'm a lukewarmer myself, so I wasn't upset when OHC flatlined for several years there. I expect warming to resume when the El Nino kicks in. BTW does anybody know why Argos doesn't collect PH data? I think it would be nice to have.
    0 0
  41. I believe that you have fundamentally misunderstood the physical processes of heat transfer between the ocean and atmosphere in ENSO events. The difference between El Niño and La Niña by definition involves higher sea surface temperatures during an El Niño. In an El Niño, the trade winds falter and warm water spreads eastward across the central Pacific. Higher sea surface temperatures across a vast pool result in a transfer of energy to the atmosphere resulting in a spike in global surface temperatures. Energy is transferred from the Ocean to the atmosphere resulting in a lower mean ocean heat content. In a La Niña, the reverse happens with heat transfer from the atmosphere to the ocean – global surface temperature falls. The correlation between surface temperature trends and ENSO events is 100%. The thermocline is located between 50 and 1000m – predominantly above the 200m depth. The thermocline should be thought of as a transition layer between the warm and turbulent surface and the cold oceanic depths. As you say, in a La Niña, cold subsurface water rises strongly in the eastern Pacific. This water mixes with warm surface water and increases the volume of water in the surface layer but may not change the heat content when the latter is integrated over a suitable depth. 700m is probably suitable. Ocean heat content increases in a La Niña and decreases in an El Niño. This not only makes physical sense but is, I believe, the correct interpretation of the graphs. The reverse cannot possibly happen without violating the 1st and 2nd Laws of Thermodynamics. ENSO needs to be seen in the context of both ocean and atmospheric temperatures but also in terms of decadal changes in surface incident short wave radiation (SISR). The total global heat content – declining or steady ocean heat content and declining atmospheric temperature (if you look at the monthly temperature record – there is no doubt when surface temperature peaked in the 97/98 El Niño) – certainly seems to imply that there is something else happening in the global climate system. See - ‘Shortwave forcing of the Earth's climate: modern and historical variations in the Sun's irradiance and the Earth's reflectance, P.R. Goode, E. Palle, J. Atm. and Sol.-Terr. Phys., 69,1556, 2007.’ PDF The clue is in decadal changes in ocean temperature – primarily the Pacific Decadal Oscillation and in decadal changes in the frequency and intensity of ENSO events – but also the in total ocean heat content. There are extrinsic causes dominated by changes in cloud cover and consequent changes in SISR – as revealed by the ISCCP. The world’s oceans must be cooling because SISR has decreased by about 4 W/m2 since 1998 – an order of magnitude greater than anthropogenic greenhouse gas forcing in the same period. The net direction of cloud climate forcing in the atmosphere is less certain – but the change in shortwave forcing is a direct input into ocean heat content. This result emphasises the importance of including cloud changes associated with changes in the Interplanetary Magnetic Field. That is, clouds are a climate forcing on 20 to 30 year and longer cycles, rather than simply a feedback as the IPCC insists. http://arxiv.org/abs/0804.1938
    0 0
  42. I seem to have somehow posted twice - for the Goode et al reference http://bbso.njit.edu/Research/EarthShine/literature/Goode_Palle_2007_JASTP.pdf
    0 0
  43. re #41 Robert, the Goode and Palle data you cited which shows an apparent continuing ("cooling") contribution from an apparent reduction in SISR reaching the surface (increasing albedo) from 1998 through 2005 has been reassessed by the same authors (abstract below [***]), and found to be inconsistent with new data and analysis. http://www.agu.org/pubs/crossref/2009/2008JD010734.shtml Goode and Palle now find a consistent interpretation with the CERES and ISCCP cloud analyses in which there has been no change in albedo from the period 2000 through 2007. In other words their previous large apparent negative forcing that you describe isn't actually correct. Although their new analysis suggests that there has been a small increased albedo in the period 1998-2000, there has been no detectable change since then. This reassessment is consistent with the data on ocean warming which shows large increases in upper ocean heat since 1998 (see John Cook's top post, for example), even if there is some question about the last few years. One shouldn't be fooled into thinking that the land-ocean surface warming under enhanced greenhouse forcing has "stopped" just because 1998 was a very anomalously warm year due to a large El Nino! It's likely that the very recent period of lower temperature anomalies are the result of the strong La Nina episode of 2008 and the fact that the sun is at the bottom of its solar cycle. Palle and Goode's reassessment of surface incident solar radiation indicates that that metric is unlikely to be very important outwith the small reduction in total solar irradiance at the solar minimum (and not forgetting the effects of aerosols on reduced surface insolation). Easterling and Wehner (2009) [*****] have recently highlighted (again) the fallacies in the assumption that the earth will not undergo significant periods of temperature statis or even cooling on a long term warming trajectory under the influence of an enhanced greenhouse radiative imbalance. Of course when this happens it should be possible to adress the significant causal elements in hindsight (solar metrics, volcanos, La Nina's etc.). In this case the change in albedo doesn't seem to be important at least according to Goode and Palle's reanalysis. Incidentally you said on another thread that sea levels haven't risen "in years". That's incorrect. http://www.agu.org/pubs/crossref/2009/2009GL037810.shtml [***]E. Pallé, P. R. Goode and P. Montañés-Rodríguez (2009) Interannual variations in Earth's reflectance 1999–2007 J. Geophys. Res. 114art #D00D03 abstract: The overall reflectance of sunlight from Earth is a fundamental parameter for climate studies. Recently, measurements of earthshine were used to find large decadal variability in Earth's reflectance of sunlight. However, the results did not seem consistent with contemporaneous independent albedo measurements from the low Earth orbit satellite, Clouds and the Earth's Radiant Energy System (CERES), which showed a weak, opposing trend. Now more data for both are available, all sets have been either reanalyzed (earthshine) or recalibrated (CERES), and they present consistent results. Albedo data are also available from the recently released International Satellite Cloud Climatology Project flux data (FD) product. Earthshine and FD analyses show contemporaneous and climatologically significant increases in the Earth's reflectance from the outset of our earthshine measurements beginning in late 1998 roughly until mid-2000. After that and to date, all three show a roughly constant terrestrial albedo, except for the FD data in the most recent years. Using satellite cloud data and Earth reflectance models, we also show that the decadal-scale changes in Earth's reflectance measured by earthshine are reliable and are caused by changes in the properties of clouds rather than any spurious signal, such as changes in the Sun-Earth-Moon geometry. [*****]D. R. Easterling and M. F. Wehner (2009) Is the climate warming or cooling? Geophys. Res. Lett., 36, L08706 abstract: Numerous websites, blogs and articles in the media have claimed that the climate is no longer warming, and is now cooling. Here we show that periods of no trend or even cooling of the globally averaged surface air temperature are found in the last 34 years of the observed record, and in climate model simulations of the 20th and 21st century forced with increasing greenhouse gases. We show that the climate over the 21st century can and likely will produce periods of a decade or two where the globally averaged surface air temperature shows no trend or even slight cooling in the presence of longer‐term warming.
    0 0
  44. Chris – I think you are misunderstanding the E. Pallé, P. R. Goode and P. Montañés-Rodríguez (2009) Interannual variations in Earth's reflectance 1999–2007 J. Geophys. Res. 114art #D00D03 Just between you and me - a copy is available at: http://bbso.njit.edu/Research/EarthShine/literature/Palle_etal_2008_JGR.pdf ‘Earth's global albedo, or reflectance, is a critical component of the global climate as this parameter, together with the solar constant, determines the amount of energy coming to Earth. Probably because of the lack of reliable data, traditionally the Earth's albedo has been considered to be roughly constant, or studied theoretically as a feedback mechanism in response to a change in climate. Recently, however, several studies have shown large decadal variability in Earth's reflectance.’ The ‘climatologically significant’ change in Earth Albedo since 1998 – reassessed downward from 4 to 2 W/m2 since 1998 in the Palle et al (2009) study - although the ISCCP-FD result is higher. The lower estimate is not a ‘small’ value. Compare it with the IPCC estimated net anthropogenic forcing of 1.5 W/m2 to 2005. The decrease in energy hitting the earth surface is not a one off event but represents an ongoing reduction in shortwave energy flux hitting the surface of the planet. The energy deficit is cumulative and this is the reason why you would expect a global decline in total heat content of the oceans and atmosphere and other minor components in the global energy reservoirs. The question is not whether one should expect a decadal decrease in global total heat content but how long it will last and what are the implications for anthropogenic global warming. The ‘robust’ estimate of decadal variation – 6 W/m2 between 1985 and 1998. The shortwave forcing of Earth’s climate between at least 1985 and 1998 must not continue to be ignored. This means that the IPCC estimate of the cloud albedo effect is wrong because; • the cloud albedo effect is not constant; and • it is simply wrong - the 2007 IPCC estimate of the cloud albedo effect is negative when it should be hugely positive between at least 1985 and 1998. The IPC has spent 20 years ignoring natural variation that is obvious to blind Freddy in the climate record. Now it is being said that there is natural variability of unknown causality that is masking global warming but which will soon return with a vengeance. Doh! The situation gets worse for the IPCC when you start to wonder what the drivers of decadal variation of global cloud cover are. Is it internally driven by decadal variation in sea surface temperature? This really just leads to seeking the underlying driver for the well known decadal variations in sea surface temperature and, indeed, in total ocean heat content. Inevitably, it seems to me, we are drawn to the solar system magnetic/cosmic ray/cloud theories of Svensmark and numerous other authors. Jasper Kirkby of CERN provides a terrific summary at: http://arxiv.org/abs/0804.1938 Solar system magnetism – as reflected in the annual series of the aa-index of Earth geomagnetic activity - was at 14.2 last year down from a peak of 37.1. It is expected to trend down for a couple of centuries.
    0 0
  45. Incidentally, have a look at the steric sea levels (I assume these are deltas) in Figure 4 above - none of these show much of a change. I can only reiterate that you need to look at total global heat content at any one time. That is the heat content of oceans and the atmosphere as well as other minor heat reservoirs. The bottom line is that the planet is not heating at all since at least 2004 - the revised ARGO data is certainly the best that we have. There is obviously something that has changed in the Earth energy budget.
    0 0
  46. The revised analysis of Palle et al (2009) is pretty straightforward, Robert, and I understand it quite well having read it carefully a couple of times. The original analysis on which you were basing your interpretations in post #41 has been rather fundamentally revised. The so-called "robust" estimate of 6 W/m2 variation based on an apparent decrease of albedo anomaly from around 9% in 1986 to around -2% in 1998 originally proposed by Goode and Palle in their 2007 paper, seems now to be [based on ISCCP FD data - see Figure 1a of Palle et al (2009)] an apparent decrease in albedo anomaly from around 0% in 1986 to around -0.5% in 1998. If the albedo anomaly change has been revised downwards by a factor of around 20-fold to 5% of the original estimate upon which you were basing your analysis in post #41 how can the original estimate by the same authors be "robust"?! Likewise if the original Goode and Palle estimate of an increase in albedo between 1998-2005 has been revised to a best estimate of zero change between 2000 through 2007, that should lend us to question the significance of these measured albedo contributions to climate parameters. Even if there is an apparent "cooling" forcing due to a small increase in albedo between 1998-2000, this is difficult to reconcile with the fact that all of the climate parameters associated with radiative imbalance from any source have been in the warming direction for many years since 2000. The ocean heat content has increased markedly since 2000 (at least up to 2004) as have sea levels (latest data still consistent with a trend near 3.2 mm/yr: http://sealevel.colorado.edu/current/sl_ib_ns_global.jpg); the air-sea surface temperatures for the decade 2000-present are significantly warmer than for the decade 1990-1999 and so on and this applies right through 2007. Why should these parameters have continued in a warming direction for many years after your apparently dominant cooling forcing has peaked in 2000? The IPCC certainly hasn’t “spent 20 years ignoring natural variation”. What leads to that odd conclusion? The IPCC analysis of the full surface temperature variation since the start of the 20th century has been made using the best (and evolving) measures of all contributions to variable radiative forcing whether natural or anthropogenic. One can hardly claim a contribution from variations in the cosmic ray flux when there has been no trend in this parameter (a slight cooling contribution if anything) during the period since the late 1980’s when the CRF has been measured in detail. Even the proponents of that theory recognize that variations in the CRF hasn’t contributed to marked late 20th century and contemporary warming.
    0 0
  47. whoops, that should be: "One can hardly claim a contribution from variations in the cosmic ray flux when there has been no trend in this parameter (a slight cooling contribution if anything) during the period since the late 1950’s when the CRF has been measured in detail."
    0 0
  48. Hi Chris - back again but on my laptop. Directly quoting from the Palle et al (2009) - 2 W/m2 change in shortwave forcing between 1999 and 2004 and constant (within the limits of error) thereafter based on Earthshine data. Compare this with the ISCCP-FD data. You are still not understanding the distinction between energy flux (W/m2) and energy (J). The latter accumulates as heat in the global system. When the energy flux declines on a sustained basis there is less energy accumulating in the system. Nothing peaked in 2000 - it just moved to a new state of energy flux. I must admit that I can't make head or tail of the difference between the 2006 and 2009 graphs. However, a 1% change in albedo is 3.4 W/m2 – the math is very easy. Figure 2 of the 2009 paper actually makes a lot more sense - a 1% decline in albedo from 1984 to 1998 - noting Mt Pinatobu in 1992. A total change in shortwave forcing of 3.4 W/m2. It is not 20 times less than the value of 6.8 given in the 2006 paper. I am not sure which solar system magnetic/cosmic ray/cloud proponents admit anything of the sort. See Svensmark and Marsh on the Nir Shiviv website – Figure 3. http://www.sciencebits.com/CosmicRaysClimate See this discussion. Neutron counts peaked in the late 1980’s – and I am not convinced that neutron counts are the ideal metric to see changes in magnetically modulated cosmic rays. The aa-index peaked in 2003 on an annual basis - but in the late 1980's on 11 year averages. http://hesperia.gsfc.nasa.gov/sspvse/oral/Ken_McCracken/wintergreen1.pdf The point about ENSO is that it involves an energy transfer between the ocean to the atmosphere. Inter-annual variation in the heat content of either doesn’t matter a damn. The moving averages of either are not terribly informative. All that matters is the total energy in both. The heat content of the atmosphere is quite a lot less than in 1998 – El Niño pumped a lot of heat into the atmosphere in 1998 and it is simply a function of a vast area of warm water across the Pacific. http://www.drroyspencer.com/latest-global-temperatures/ We get back to ocean cooling. The ARGO data – best available – doesn’t show any warming since commencing in 2004. Together with atmospheric cooling – the data seems to show less energy in the global system. The cloud and energy content data are consistent.
    0 0
  49. Robert, the cosmic flux-climate advocates I was referring to are Svensmark and Friis-Christensen. They stuck a (rather scientifically illiterate) report on their website concerning the solar contribution – climate link www.spacecenter.dk/publications/scientific-report.../Scient_No._3.pdf whatever the failings of the science in their report, they are pretty clear that the cosmic ray flux has been pretty flat (a slight cooling contribution) since the late 1950's. That's clear from their Figure 2B where they've stripped out the warming trend and shown that the cosmic ray flux (though it could well be total solar irradiance) "matches" the denuded temperature evolution over this period (note that their cosmic ray flux data is upside down). It's obvious that the cosmic ray flux data in their figure indicates a net cooling contribution if anything during the period of large late 20th century and contemporary warming. A similar conclusion could be made from the data presented in your Jasper Kirby article. The long term secular trends in the CRF are tiny (total variations of a few percent). A pretty fatal problem with attempting to link rather dodgy cloud-albedo effects to the CRF, is that the CRF variation through the solar cycle is much larger than the tiny scular variation throughout the last 60 years. However inspection of all of the ISPCC-albedo data in the Palle/Goode papers we've been discussing shows no relationship between albedo/cloud metrics and the solar cycle. That pretty much rules out significant CRF-albedo-cloud linkages. Two other problems: 1. There are clearly major problems in obtaining reliable cloud-albedo metrics. The two data sets presented in your original Goode-Palle paper and the recent one I found are wildly different. I prefer to wait until the issue are clarified objectively before drawing major conclusions. However it's worth pointing out that the apparent large forcings that you are taking from these papers are not necessarily nett forcings anyway. You can correct me if I'm wrong, but these forcings seem to be calculated from the observed "moonshine" (or cloud) albedo measurement. However these effects, if cloud related, are not pure albedo effects in the manner arising from (for example) surface land or sea ice. Clouds in the sky enhance earth albedo, but they also warm the surface by preventing convective and radiative heat loss. The actual nett effects of variations in clouds are not necessarily very significant. 2. I agree with you that one needs to consider forcing (W/m^2) and heat accumlation (Joules) properly. If one assesses the accumulated upper ocean heat in the period 2003-2008 inclusive, using the data of Levitus et al (2009) [see graph in John Cook's top article to this thread), this value (around 5.8 x 10^22 J) is rather similar to that predicted from the net forcing resulting from enhanced greenhouse and all other contributions. So there isn't really anything that is yet inconsistent with our understanding of the greenhouse effect and the consequences of enhancing this. Of course there is some uncertiainty about accumulated heat in the oceans during the last few years. You suggest that the ARGO data is "the best". Perhaps, but it's not yet terribly reliable yet. A couple of years ago the ARGO data was indicating marked upper ocean cooling. That was found to be the result of an artefact from malfunction in a subset of the devices. More recently two separate analysis using the same corrected data have resulted in two different interpretations of upper ocean heat. So rather like the cloud/albedo/CRF data there are serious issues of reliability. I prefer to wait til these are sorted before making/believing fundamental interpretations. Incidentally, I agree that the Jasper Kirby web article is well written. However it treats the subject with a vastly "one-eyed" interpretation. If I have time I might make a few points on this.
    0 0
  50. Not trying to hide - Rob or Robert is fine - my laptop was offline and I used a work email in registering and forgot my login details. My mates call me Robbo. The cloud reconstruction is, and I will quote Goode et el 2009, that using 'satellite cloud data and Earth reflectance models, we also show that the decadal scale changes in Earth's reflectance measured by earthshine are reliable, and caused by changes in the properties of clouds rather then any spurious signal, such as changes in the Sun-Earth-Moon geometry.’ It is not just one paper or source however – see Hatzianastassiou et al ‘Global distribution of Earth’s surface shortwave radiation budget’, the Global Energy Balance Archive, the International Satellite Cloud Climatology Project and the Baseline Surface Radiation Network. We saw an increase in surface incident shortwave radiation of 3 to 4 W/m2 between 1984 and 1998 and a decrease of 2-3 W/m2 between 1999 and 2008. These fluxes are climatologically significant. As I say, clouds have been treated as a climate feedback rather than a climate forcing and this is proving to be a questionable assumption. I have provided references. There is a link to a 42 page summary from CERN’s Jasper Kirkby. It appeared in Surveys in Geophysics 28, 335-375 (Nov 2007) – but is available on the CERN server. There are several references linked to on ScienceBits: http://www.sciencebits.com/CosmicRaysClimate Check out Figure 3 on the site – but of course never relying on a single source. Google Ilya Usoskin who has a dozen relevant studies on his website. Usoskin specialises in correlating cosmogenic isotopes with global temperature reconstructions over 1150 to many thousands of years. There is also a Hadley Centre Technical Note No 62 prepared for the 4AR. Both the Schwartz and Spencer and Braswell papers I referred to as interesting discussions. The Spencer and Braswell paper is more relevant to changing shortwave forcing. But this is about time lag. The Mizimi post adds another element to uncertainty in the TOA fluxes – CERES calibration – on top of cloud changes and early 20th century TSI changes – as well as other changes in Earth albedo – snow and ice, black carbon, land clearing etc. I have trouble accepting PDO data prior to WW2, let alone calculated TOA fluxes to 1880. The uncertainties are far greater than the changes being modelled. If we add to this the more recent ocean cooling. At a very minimum – a lack of heating since 2004. Does that imply a new climate equilibrium has been reached? Hardly, climate is not and never has been in equilibrium which is the fundamental flaw in all of the climate equilibrium models.
    0 0

1  2  Next

You need to be logged in to post a comment. Login via the left margin or if you're new, register here.


The Consensus Project Website

THE ESCALATOR

(free to republish)


© Copyright 2024 John Cook
Home | Translations | About Us | Privacy | Contact Us