


 Arguments


Douglass & Knox 2012 pre-bunked
Posted on 26 February 2012 by Rob Painting
The global energy imbalance, the difference between energy entering and leaving Earth's atmosphere, is one of the most important metrics of global warming in that it indicates how much warming is 'in the pipeline'. Given its importance, it is a topic we have frequently blogged about in one form or another, most recently in SkS posts: Breaking News…The Earth Is Warming…Still, and Search For 'Missing Heat' Confirms More Global Warming 'In The Pipeline'.
A yet-to-be-published paper, Douglass & Knox (2012) takes a cherry-picking approach to the Earth energy imbalance, and contradicts just about every single paper which has examined this subject in the last few years. Unlike Loeb (2012), however, these authors do not attempt to reconcile their calculations with the top-of-the-atmosphere flux observed by satellites. Douglass & Knox (2012) ascribes warming to mysterious step-changes. But, quite conveniently, it has already been pre-bunked by a number of mainstream peer-reviewed papers.
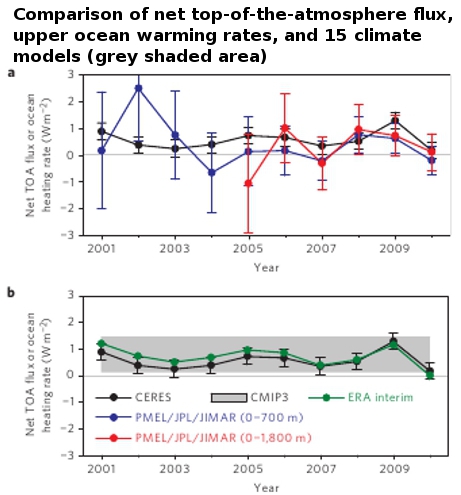
Figure 1: Comparison of net TOA ?ux and upper-ocean heating rates. a) Global annual average (July to June) net TOA ?ux from CERES observations and 0–700 and 0–1800 meter ocean heating rates from PMEL/JPL/JIMAR. Uncertainties for upper-ocean heating rates are given at one standard error derived from OHCA uncertainties. b) Net TOA ?ux from CERES, ERA-Interim reanalysis and the one standard deviation about the 2001–2010 average of 15 CMIP3 models (grey bar) are anchored to an estimate of Earth’s heating rate for July 2005–June 2010. From Loeb (2012).
The Oceans are More than 700 Meters Deep
As discussed in the SkS post: Ocean Heat Content And The Importance Of The Deep Ocean, climate modeling (Palmer [2011]) suggests that in order to reconcile changes in radiation flux happening at the top-of-the-atmosphere (TOA) over decadal time scales, ocean heat content (OHC) has to be measured right to the bottom.
Figure 2: The 90% prediction interval for decadal trend in total energy (average TOA in the models) associated with OHC from the surface to deeper ocean layers. As deeper layers of the ocean are included in measurements, the average TOA and OHC show closer agreement. See Palmer (2011) for details.
Unfortunately the ARGO float network, the most advanced and precise system for measuring ocean temperature, only goes down to 2000 meters, and the average depth of the ocean is more than twice that.
Measurements of (what we'll call here) the abyssal ocean (depths below 2000 meters) are very sparse, and therefore prone to great uncertainty. The most recent studies to examine the abyssal ocean were Purkey & Johnson (2010) and Kouketsu (2011). Both papers found substantial warming of the abyssal ocean, and although this is small in comparison to that of the surface ocean, both papers cautioned that deep ocean warming was not negligible and must be included in sea level rise, and global energy budgets. Indeed Kouketsu (2011) state:
"Thus, we conclude that the HC (heat content) changes in the deep ocean cannot be ignored when considering the decadal changes in ocean heat budgets."
For some reason Douglass & Knox (2012) choose only to consider the top 700 meters of ocean. They state (emphasis added):
"Using 700-m OHC data in Eq. (1) involves the assumption that other sources of rates of change of climate system heat content such as those of the atmosphere and the deep ocean are negligible. This assumption is discussed in the supplementary material of paper [4] and in Section 4 below."
In section 4 they make a weak argument, which does not stand up to scrutiny:
"Purkey and Johnson [21], in a recent deep-ocean analysis based upon a variety of time periods generally in the 1990s and 2000s, suggest that the deeper ocean contributes on the order of 0.09 W/m2."
However, this value only accounts for the global oceans below 4000 meters, plus the Southern Ocean from 1000 to 4000 meters.
Heat Content Increase Outside 0-700 Meter Oceans is Significant
Douglass & Knox have almost entirely neglected the ocean heat content between 700 and 4000 meters, claiming it is negligible. However, according to the National Oceanographic Data Center (NODC), the OHC increase from 700 to 2000 meters accounts for approximately 30% of the 0 to 2000 meter OHC increase since 1970 (Levitus et al. in preparation). Thus Douglass & Knox are incorrect to assume that heat changes outside the upper 700 meters of the oceans is negligible (Figure 3, Table 1).
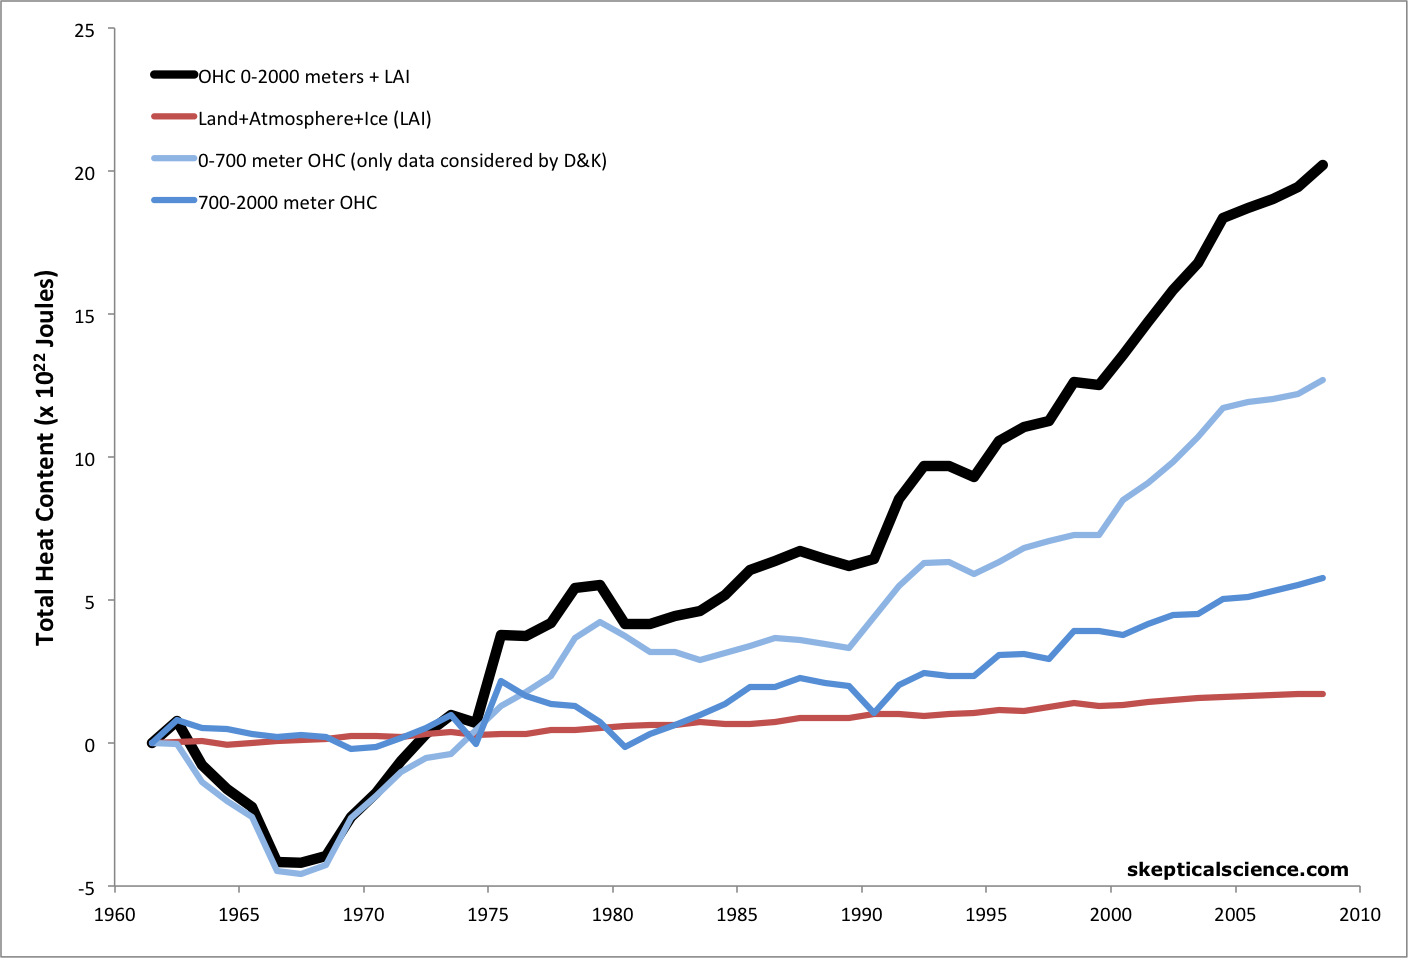
Figure 3: 0-700 meter OHC (light blue; the only heat content data considered by Douglass & West) and 700-2000 meter OHC (dark blue) pentadal average (Levitus et al. in preparation). Land, atmosphere, and ice heating (red, Church et al. 2011), and the sum of the three (black).
Table 1: Heat Content Increase in Oceans and Land + Atmosphere + Ice
| Timeframe | 0-700 meter OHC (W/m2) |
700-2000 meter OHC (W/m2) | 0-2000 meter OHC + LAI (W/m2) |
| Since 1970 | 0.21 | 0.086 | 0.32 |
| Since 1980 | 0.23 | 0.12 | 0.37 |
| Since 1990 | 0.29 | 0.14 | 0.46 |
| Since 2000 | 0.33 | 0.15 | 0.50 |
The second column in Table 1 (0-700 meter OHC increase) is the only heating taken into consideration by Douglass & Knox. However, this only represents approximately two-thirds of the heating of the 0-2000 meter oceans plus land, atmosphere, and ice.
Douglass & Knox also claim that the "recent [2002-2008] value of flux imbalance" is −0.034 ± 0.06 W/m2 (0.053 W/m2 from the upper 700 meters, after they subtract 0.087 W/m2 of geothermal flux). However, using the NODC pentadal data (5-year running average), the 2000 meter OHC flux since mid-2001 is 0.47 W/m2, and even limiting ourselves to 0-700 meter data is 0.30 W/m2. It is possible to obtain a smaller trend similar to that claimed by Douglass & Knox if the start and end points in the NODC quarterly data (with a 1-year running average) are picked like plump cherries; a statistically-unsound method which the authors justify by invoking "climate shifts" (more on this below).
Climate Sensitivity and Feedbacks
Douglass & Knox build upon the errors discussed here to draw a very wrong conclusion about the net climate feedback, and thus global climate sensitivity (emphasis added):
"Is the recent value of flux imbalance −0.034 ± 0.06 W/m2 consistent with what is expected from various climate forcings? The change in total solar irradiation (TSI) from 2003 to 2010....represents a solar forcing of −0.086 W/m2. The geothermal flux is +0.087 W/m2 [4,24], so that TSI and geothermal contributions just about cancel each other. For this same period, CO2 increases from 375.8 to 389.8 ppm [25]. Using dF = 5.35 ∗ ln(C/C0), the predicted no-feedback CO2 forcing is 0.196 W/m2, compared with −0.034 ± 0.06 W/m2, well outside the uncertainty in the observations. Therefore, the CO2 forcing feedback would have to be negative to obtain agreement, whereas the models apparently have positive feedback."
There are a number of errors in this paragraph. First, as shown above (i.e. Table 1), the heat imbalance in recent years is not -0.034 W/m2, and this critical error is the basis of this incorrect conclusion. In fact, the heat imbalance is consistent with the findings of mainstream peer-reviewed studies on the subject (discussed further below), in the ballpark of 0.5 W/m2.
Secondly, Douglass & Knox have completely ignored all radiative forcings other than solar and CO2. They assert that if the CO2 forcing is larger than the global heat flux, it must mean that the net feedback is negative. However, there are other radiative forcings that they have completely ignored, the main one being aerosols. For example, Kaufmann et al. (2011) found that the anthropogenic aerosol forcing has increased in recent years, and Solomon (2011) concluded that aerosol cooling has offset one-third of the CO2 warming since 2000. Douglass & Knox have completely neglected this factor.
Moreover, since they are playing with such short periods of data, the Douglass & Knox argument is highly dependent upon their choice of start and end points. The authors justify their choice by claiming there were "climate shifts" in 2002 and 2008, and so we only need to consider data in that "climate shift" window. Most of their proposed "climate shifts" occur less than 10 years apart, and remind us of The Escalator: playing with short-term noise to find the statistically-insignificant trends that we want to see.
For example, while the 0-700 meter annual OHC trend (used by Douglass & Knox) is small when starting in late-2002 and ending in mid-2008, the trend from late-2004 to mid-2008 is much larger. Was there another "climate shift" between late 2002 and late 2004, or are these "climate shifts" simply a case of playing games with short-term noise?
And why base a determination regarding climate feedbacks on just the most recent "climate shift"? Performing the same analysis on one of their rapid warming climate shifts would lead Douglass & Knox to conclude that the net feedback is strongly positive. That they only applied this estimate to one of the flatter of their "climate shifts" suggests they have simply opted for a result they liked, and just simply ignored the conflicting data. Their conclusion is therefore unsupported, and not reliable.
Handwaving Dismissal of Conflicting Results
In the last page of their paper, the authors attempt to dismiss the findings of mainstream peer-reviewed studies which have found that the oceans are warming, and that the Earth's energy imbalance is positive - meaning that it is steadily accumulating heat.
First up they dismiss Lyman (2010) who reported ocean warming of 0.63 ± 0.28 W/m2 over the period 1993–2008. Quite ironically Douglass & Knox state Lyman's estimate has little meaning because it spans the arbitrary break in the data (their 'climate shifts'). In other words, Douglass & Knox dismiss long-term trends in favor of short-term noise.
It's useful to point out here that Lyman (2010) utilize a different analysis method for data gaps in ocean temperature measurements, than the Levtitus methodology used by NODC. Levitus fills the data gaps with the averaged value of the missing data. This has the tendency to underestimate any anomalies, as they tend toward zero (the average), whereas Lyman (2010) infill the data gaps with anomalies from nearby grids. The end result is that Levitus is likely to underestimate any warming trend. See Lyman (2008).
Douglass & Knox then move on to Von Schuckmann & Le Traon (2011), who reported ocean warming of 0.55 ± 0.1 W/m2 in the 10-1500 meter layer from 2005-2010. Repeating their analysis for the 0-2000 meter layer (see Hansen [2011]) they get 0.59 ± 0.1 W/m2, which is equivalent to 0.41 ± 0.07 W/m2 globally from the upper 2000 meters of oceans over the period in question. Douglass & Knox dismiss these results because they do not include data prior to 2005; apparently short-term data are only acceptable when the start and end points are appropriately cherry picked. Douglass & Knox also dismiss the Loeb (2012) results discussed above (0.5 ± 0.43 W/m2) for the same reason. However, this is incorrect: the Loeb (2012) analysis actually spans the period of January 2001 to December 2010, which mostly falls within the supposed "climate shift" period in question.
A Fundamentally Flawed Paper
Ultimately, the biggest problem in this paper is that Douglass & Knox ignore the nearly 30% of global heating which has gone into the 700-2000 meter layer of oceans over the past few decades. By ignoring this heat, they are able to focus on the less complete and thus noisier 0-700 meter data. We criticized Roger Pielke Sr. not long ago for this same behavior (claiming that the 700 meter OHC data accurately represents global heat content), and Pielke has not surprisingly heaped praise on Douglass & Knox for following his cherry picking lead.
However, the problems in the paper extend much further yet. The authors also attribute short-term noise to "climate shifts." They cherry pick convenient data points and ignore aerosol effects to make a wholly unjustified argument that the net climate feedback is negative. Had they chosen different endpoints, or analyzed another of their "climate shift" periods, or considered aerosol effects, or considered data outside the upper 700 meters of oceans, Douglass & Knox would not have been able to make this faulty argument.
Douglass & Knox then attempt to justify why their faulty conclusion differs from every mainstream heat content study by coming up with tenuous arguments to dismiss all other results, their favorite being that the other studies didn't use their cherry picked data points.
Douglas and Knox is a fundamentally flawed paper, whose conclusion rests wholly upon analysing only carefully selected short-term periods which the authors preferred. Utilizing other short-term periods from the data contradicts the authors conclusions, and demonstrates their claims are unfounded.


Comments