


 Arguments


Five bits of research that shaped climate science in 2014
Posted on 7 January 2015 by Guest Author
Five bits of research that shaped climate science in 2014 by Roz Pidcock was originally posted on The Carbon Brief on Dec 26, 2014.
 Climate science never stops developing. Over the course of the year we've covered a myriad of scientific studies, some of which have made the news, and others which have been more quietly received. Here's our pick of the papers that have shaped scientific discussion about climate change in 2014.
1. Pacific winds drive surface warming slowdown
In February, a paper by Matthew England and colleagues helped shed light on why surface temperatures have risen more slowly over the last 15 years or so than in previous decades, even though we're emitting greenhouse gases faster than ever before.
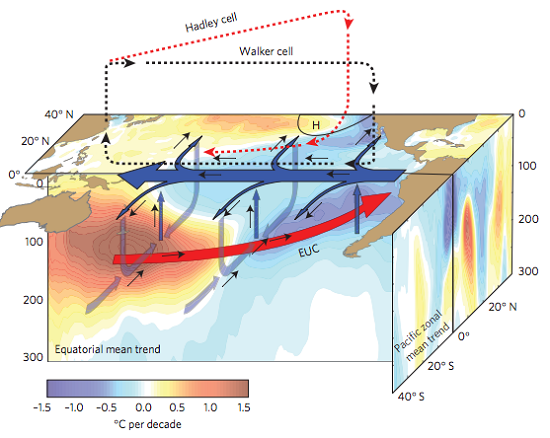
Colours show temperature trends in the Pacific during 1992-2011 at the sea surface. Trade winds blowing east to west are shown by the blue arrow. Thin arrows indicate a strengthening circulation, with more water transported to deeper layers. Source: England et al. (2014)
A few pieces of research last year pointed towards the tropical Pacific as holding the key. The England paper added a layer of detail by describing the process that could be at play.
Trade winds have been particularly strong since about 2000, which is driving heat deeper into the oceans and bringing cooler water up. This has made earth's average surface temperature0.1 to 0.2 degrees cooler than it would otherwise be, the scientists estimate.
While scientists suggest there could be an additional role for the Atlantic in driving the hiatus,evidence for the Pacific Ocean mechanism seems to be winning out at the moment.
For more on how the ocean deeps influence what we feel up here on earth's surface, here's our top to bottom look at the oceans and climate change.
England, M. et al. (2014) Recent intensification of wind-driven circulation in the Pacific and the ongoing warming hiatus. Nature. doi:10.1038/nclimate2106
2. West Antarctic glaciers show signs of collapsing
Scientists have long suspected the west Antarctic ice sheet is vulnerable to collapsing under rising temperatures - potentially raising global sea levels by several metres, eventually.
A paper by Ian Joughin and colleagues in May suggested the chain of events leading to collapse may already be underway. It won't be quick - probably taking several centuries. But beyond a certain point, the process is likely to be unstoppable, the scientists warned.
A separate paper by Eric Rignot described extensive satellite, air and ground surveys, which found not only are West Antarctic glaciers shrinking but there are no landscape features - like ridges, or other obstacles - stopping the ice from melting away completely.
Here's NASA glaciologist Eric Rignot to explain.
So are the glaciers retreating or collapsing entirely? And do scientists think the collapse of the WAIS glaciers is "unstoppable"? We've answered some questions the research raised, here.
Joughin, I., Smith, B. E. & Medley, B. (2014) Marine Ice Sheet Collapse Potentially Underway for the Thwaites Glacier Basin, West Antarctica DOI: 10.1126/science.1249055
Rignot, E. et al. (2014) Widespread, rapid grounding line retreat of Pine Island, Thwaites, Smith, and Kohler glaciers, West Antarctica, from 1992 to 2011. Geophysical Research Letters. DOI: 10.1002/2014GL060140
3. Antarctic sea ice measurements hit record high
This year, the amount of ice surrounding Antarctica reached a record high of 22.11 million square kilometres. Antarctic sea ice extent has grown at a rate of about 1.5 per cent per decade since 1979, according to satellite data.
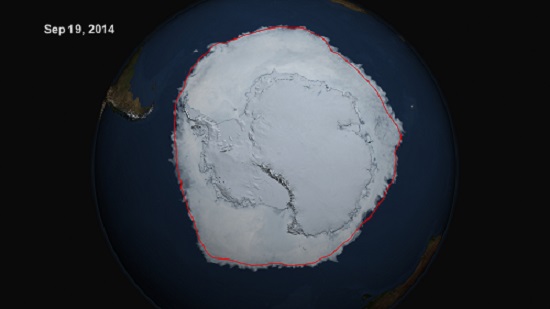
On Sept. 19, 2014, the five-day average of Antarctic sea ice extent exceeded 20 million square kilometers for the first time since 1979. The red line shows the average maximum extent from 1979-2014. NASA's Scientific Visualization Studio/Cindy Starr Scientists know the Greenland and Antarctic ice sheets are losing ice, and that Arctic sea ice loss is accelerating. But pinning down why the opposite is happening in Antarctica is proving more difficult.
Scientists say changes in local wind patterns and ocean circulation are the most likely candidates, delivering cold water to the surface which then freezes.
But a paper back in July by Ian Eisenmann and colleagues suggested there may be another explanation - a change in the way measurements are made, rather than in the sea ice itself.
In 2007, NASA updated its main sea ice dataset. Eisenmann found this had the effect of pushing sea ice values down a bit before 1991 and up a bit afterwards, which makes the growth in sea ice appear quite a lot bigger than before.
The authors say they can't be sure yet if the old dataset is wrong, or the newer one, so it may well not be that significant. But if it's the latter, that raises the possibility that Antarctic sea ice growth has been overestimated. You can read more about what other scientists had to say about the new paper, here.
Eisenman, I. et al., (2014) A spurious jump in the satellite record: has Antarctic sea ice expansion been overestimated? The Cryosphere DOI: 10.5194/tc-8-1-2014
4. The link between Arctic sea-ice loss and extreme winters got a bit stronger. Maybe
Temperatures in the Arctic are increasing almost twice as fast as the global average - a phenomenon known as Arctic Amplification.
A paper published in October by Masato Mori and colleagues was the latest in a series linking rapidly increasing temperatures in the Arctic to very cold winters in the northern hemisphere.
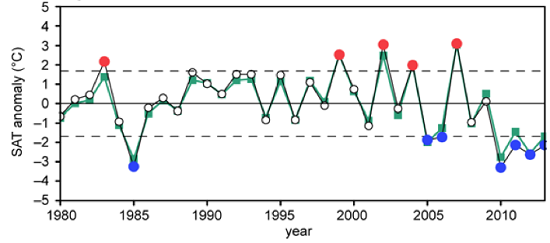
Surface air temperatures over the Barents and Kara seas during winter, compared to the 1979-2013 average. Blue and red dots indicate severely cold and warm winters, respectively.
Jennifer Francis and Steve Vavrus first put forward the hypothesis that Arctic Amplification could affect northern hemisphere weather by influencing the jet stream - a band of fast-flowing air high up in the atmosphere.
While Francis told us she thinks the recent paper means the mechanism is a "done deal", not everyone is as convinced. It's a very new area of research and there is relatively little data to work with, as Arctic amplification only emerged as a strong signal in the mid-1990s.
The long-term picture suggests these cold winters might only be a temporary feature before further warming takes hold, Mori and colleagues suggest.
Mori, M. et al. (2014) Robust Arctic sea-ice influence on the frequent Eurasian cold winters in past decades, Nature Geoscience, doi:10.1038/ngeo2277
5. Record summer heatwaves are ten times more likely with climate change
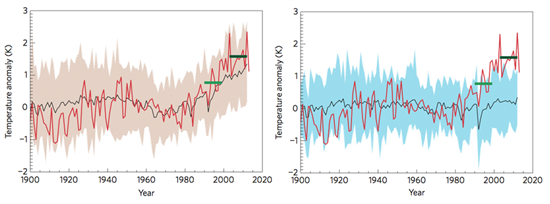
European summer average temperatures with climate change (left) and without climate change (right). Red lines show actual temperatures relative to the long-term average. Christidis et al. (2014)
Climate change is raising the odds of summer heatwaves in Europe by a factor of 10, according to research from the Met Office. Over the past 10 to 15 years, the likelihood of a 'very hot' summer has risen - from once every 50 years to once every five years.
The summer of 2003 was the hottest ever recorded for central and western Europe, with average temperatures in many countries as much as five degrees higher than usual.
To see how climate change is affecting the likelihood of heatwaves and other extreme events, researchers carry out single-event attribution studies. The first of these studies back in 2004 found the 2003 heatwave was made more than twice as likely because of climate change.
The new paper finds the rising impact of humans on the climate means the risk of 'extremely hot' summers is now ten times greater than when the 2003 European heatwave struck.
As the frequency of heatwaves increases, so do risks to human health. Building resilience to high temperatures is critical for limiting deaths during extended hot weather, the authors warn.
Christidis, N. et al. (2014) Dramatically increasing chance of extremely hot summers since the 2003 European heatwave, Nature Climate Change, doi.org/10.1038/nclimate2468


wrt #4:
Dr. Francis has a new paper out with more evidence of this trend.
iopscience.iop.org/1748-9326/10/1/014005
So one more study to add to the series. How many more of these would it take for the "Maybe" at the end of #4 to fade away?
(Thanks to Sigmetnow at neven's Arctic Sea Ice forum for this link and text.)
Correct me if I'm wrong , but this article confirms that warming has slowed over the last 15 years counter to rising co2 , and climate predictions . Antarctic sea ice has increased significantly . Polar warming is offset by mid latitude cooling . And I don't want to sound clueless but during the unusually warm period in Europe and the eastern arctic between the 20's and 40's wasn't there a whole lot of previously ice covered land exposed ? From what I've read from contemporary accounts it sounded much more extreme than now . Just asking . I try to find out as much as I can , keep an open mind .
[Rob P] - You're wrong. The rate of global surface warming in the last 16 years has slowed when compared to the previous 16 years, but the slower warming rate is nevertheless similar to the long term trend:
This plot is for only one of the surface temperature data sets (NASA GISS), but all surface temperature data and the lower troposphere temperature data of UAH all demonstrate ongoing warming. More importantly, the oceans continue to absorb heat. So we know that more surface warming is in the pipeline.
Posthocergopropterhoc @2, courtesy of Tamino, here is the global temperature trend up to 1999:
And here is that trend, with the additional years since added in:
You will notice that 2014 lies almost exactly on the trend line. It takes chutzpah to argue that, because the most recent annual temperature, for an ENSO neutral year, lies on the continuation of the trend, therefore the trend has been refuted. Even more chutzpah to argue the trend is falsified when every selection of period long enough to statistically distinguish between the model predicted trend and zero lies very close to the model predicted trend, and excludes zero.
I wasn't making a case for anything , I was just repeating what the first line of case #1 said : " surface temperatures have risen more slowly over the last 15 years or so than in previous decades , even though we're emitting greenhouse gasses faster than ever before ." Are you saying that that is not true. ? I'm just going by what the article says . I take it you were angry that I was trying to falsify something ? It was hard to tell as your syntax was a bit hard to wade through . theres's no doubt we are in a warming period . It's just hard to sort through all the hyperbole on both sides , separate instrument data from proxy data , apples from oranges , conflicting ideologies And arrive at objective views . Your comments about chutzpah and " falsified " anything are quite over the top , IMHO . As one wise fellow noted , methinks he doth protest too much .
[JH] You are skating on the thin ice of concern trolling. Future posts of this nature will be summarily deleted.
Please note that posting comments here at SkS is a privilege, not a right. This privilege can be rescinded if the posting individual treats adherence to the Comments Policy as optional, rather than the mandatory condition of participating in this online forum.
Please take the time to review the policy and ensure future comments are in full compliance with it. Thanks for your understanding and compliance in this matter.
I'm pretty sure I don't protest too much. I am, however, tired of a constant stream of ingoramuses repeating denier myth after denier myth with no apparent connection between their synapses.
posthocpropterhoc
"I take it you were angry that I was trying to falsify something ?"
No, they are annoyed because you are falsifying straw men and distorting the OP's message.
First, in the absence of increasing CO2 the air temperatures would go through decades of warming and cooling naturally, because of factors like those explained in the OP. The warming caused by increasing CO2 is simply superimposed on that variation. So the fact that rates of atmospheric warming vary over decadal scales does not run counter to projections of the effects of CO2 on climate. In fact, heat has been building up as espected based on CO2, given what we know of the forcings.
Second, Antarctic sea ice is increasing in extent despite the fact that air and sea temperatures are also increasing and land ice on antarctica is shrinking. Clearly other factors affect Southern Ocean sea ice extent in the austral winter, and the OP suggests there may be measurement artifacts as well (you failed to mention this despite it being the main point of that section of the OP!).
Third, the OP says nothing about warming in the Arctic being "offset" by mid latitude cooling. That is your invention, disproven by the global temperature trends shown above. The OP simply states that colder winters in some temperate areas are being linked to declining sea ice and warmer temperatures in the Arctic because of the effects on position and motion of the Jetstream.